1 Introduction
There is extensive evidence of a substantial premium to earning a bachelor’s degree from an elite college or university. But, students may instead attend less prestigious but less costly undergraduate schools, with the expectation of earning a more prestigious graduate degree. In fact, this seems to be conventional wisdom, as indicated by this quote from the New York Times: “College counselors have used this chestnut to assuage ambitious, cash-strapped students for decades: Don’t worry about attending a top college. What matters is where you go to graduate school. A stellar master’s degree can ‘scrub’ an undergraduate diploma from a less prestigious, and more affordable, institution.”Footnote 1
The assumption underlying this advice is that the benefits to an elite graduate degree dominate any benefits from an elite undergraduate degree to the point that the status of the undergraduate degree is nearly irrelevant. Thus, in deciding among colleges, differences in costs associated with undergraduate institutions are more relevant than differences in benefits from the status of the undergraduate degree. But, there is no prior empirical support for this premise.
The question I address in this article is whether students who did not attend an elite undergraduate institution can catch up monetarily by earning a postbaccalaureate degree from an elite institution. Although there are a large number of studies examining the premium to elite undergraduate education, whether the premium to an elite undergraduate degree persists among those with graduate degrees has not previously been examined. I find that the substantial premium to an elite undergraduate degree remains even among those who earn graduate or professional degrees at elite institutions. In combination with the far lower likelihood that graduates of non-selective institutions earn graduate or professional degrees of any kind, these findings have implications for individuals when choosing colleges as well as for the mechanism by which educational policy can affect income mobility.
A key challenge to examining whether undergraduate institution continues to be related to earnings among those with elite graduate education is availability of data on a sufficiently large sample of graduate degree holders that also has information on educational institutions and on labor market outcomes. I use data from five waves of the National Survey of College Graduates (NSCG) conducted between 2003 and 2017. Data from these 5 survey years provide information on a nationally representative sample of 456,861 college graduates, including 222,915 respondents with postbaccalaureate degrees.
The NSCG reports substantial information on individuals including field of degrees, college major, earnings, and extensive individual and employment characteristics. I categorize institutions using available information on the Carnegie classification, which, as I show, is highly related to the commonly used Barron’s selectivity categories. I limit the analysis to those earning postbaccalaureate degrees from elite institutions. Graduate school admissions are based largely on standardized test scores and grades (as well as selectivity of undergraduate institution), so conditioning the analysis sample on graduation from an elite postbaccalaureate program provides a lower bound on ability measures that are available to graduate admissions committees but unavailable in the NSCG. The motivating assumption is that irrespective of their undergraduate institution, students in comparable graduate programs should be subject to common quality standards.
The main finding of this article is that the premium to an elite undergraduate degree remains large and statistically significant among those with elite graduate degrees even with extensive controls for individual characteristics, family background, and employment characteristics. I discuss possible mechanisms that may relate to the persistence of a premium to elite undergraduate degrees among those with elite graduate degrees.
At the individual level, it is widely established that family income is an important influence on whether a student attends a selective institution. As the New York Times quote in the first paragraph suggests, it seems to be conventional wisdom that attending a more-affordable college will not harm careers, and, furthermore, that a prestigious graduate degree can offset a less prestigious undergraduate credential. However, this article challenges this advice on two dimensions. First, “scrubbing” a less prestigious undergraduate degree is rare – students who attend non-selective institutions for their bachelor’s degrees rarely move up to an elite graduate or professional school for a postbaccalaureate degree. Second, even when students do earn a more illustrious postbaccalaureate degree, my calculations show that any likely savings from attending a less prestigious school is quickly swamped by the lower earnings resulting from combining an elite graduate education with a non-selective undergraduate credential. At minimum, college counselors and high school students (and their parents) should recognize that even those students planning postbaccalaureate education face substantial long-run consequences from their initial college decisions.
2 Empirical motivation
The question of interest is whether graduation from an elite postbaccalaureate program can offset the earnings premium associated with a bachelor’s degree from an elite institution. This question relates to two widely analyzed issues. First, it is well-established that graduates of more selective colleges have higher earnings.Footnote 2 Second, there is extensive evidence that high ability students from low income households do not attend, or even apply to, selective colleges that they would otherwise be qualified for (Hoxby & Avery, Reference Hoxby and Avery2013). Although most of the focus has been on low income households, there is also evidence that a substantial share of high ability students across all household income levels attend colleges below their ability level (Dillon & Smith, Reference Dillon and Smith2017).
In line with the most common approach used in the large literature estimating the returns to elite undergraduate education, I estimate earnings equations controlling for a measure of college quality of the following form:
 $$ {lnY}_i={\boldsymbol{X}}_i\beta +{Z}_i\gamma +{\varepsilon}_i $$
where Y is a measure of earnings, X is a vector of individual characteristics, Z indicates college quality,  $$ \beta $$
and
 $$ \gamma $$
are parameters to be estimated,
 $$ \varepsilon $$
is a random error term, and i indexes individuals. The main coefficient of interest is
 $$ \gamma $$
, which represents the relation of college quality with earnings.
In the literature examining the returns to elite undergraduate education, college quality Z is measured various ways, such as by Barron’s selectivity categories, expenditures per student, and average SAT scores of enrolled students. Because higher ability applicants are more likely to be admitted to selective colleges and universities, in order to mitigate the expected upward bias of the estimated return to college quality, studies typically include in the vector X indicators of individual ability, such as SAT percentile and high school GPA or class ranking, as well as often highly detailed information on family background and high school characteristics. Some studies include limited labor market information as part of the X vector, but most do not. Graduate degrees earned, if any, are not taken into account in the earnings equation estimations, for reasons of research interest (which generally has been focused on whether attending an elite institution for undergraduate studies pays off in the form of higher earnings even if more costly than a non-elite alternative) as well as data availability, as noted below.
Although not being able to definitively prove causality, these studies, using a variety of data sets and identification strategies, consistently find a substantial premium to elite undergraduate education that is not solely due to ability.Footnote 3 A second approach that supports a causal interpretation is by use of a discontinuity introduced by an admissions cutoff. Hoekstra (Reference Hoekstra2009) shows in a regression discontinuity analysis that there is an earnings premium of 20% for white men to graduation from a state’s flagship institution relative to just falling short of the admissions cutoff. Studies also using a regression discontinuity design based on non-U.S. data similarly find a premium to earning a degree in a more selective university or program (Anelli, Reference Anelli2016; Canaan & Mouganie, Reference Canaan and Mouganie2018; Hastings et al., Reference Hastings, Neilson and Zimmerman2013; Kirkebøen et al., Reference Kirkebøen, Leuven and Mogstad2016). However, this approach requires data that are rarely available, specifically information on where the student falls relatively to an admissions cutoff matched to earnings postgraduation.
Although there is substantial and consistent evidence of a premium to elite undergraduate education net of measures of individual ability, it is unknown whether the earnings premium associated with an elite undergraduate education continues even among graduates of elite graduate programs. There are several reasons to expect that the premium to elite undergraduate education can be offset by earning an elite graduate degree, net of the role of ability, so that catching up monetarily is possible. There are also several reasons other than ability that catching up monetarily is unlikely.
Starting with reasons why catching up seems possible, one important factor is that those who earn graduate and professional degrees comprise a highly selected group who have received substantial information through the course of their undergraduate career about their ability, and accordingly deem their prospects sufficiently attractive to warrant the considerable opportunity cost, as well as direct costs, of continuing their education. Second, because graduate programs focus on field-related education, employers may consider the graduate degree to be more informative than the undergraduate degree about job-specific skills. Third, graduate school admissions are based largely on standardized test scores and grades. To the extent that students attend undergraduate institutions below their ability level, the graduate degree-granting institution may indicate a closer ability match, and thereby have a more important relation to earnings than status of an individual’s undergraduate institution.
Fourth, non-cognitive skills matter in educational as well as in labor market outcomes.Footnote 4 Graduation from an elite graduate program demonstrates actual motivation, ambition, and persistence. Fifth, Arum and Roksa (Reference Arum and Roksa2011) find little improvement in critical thinking, complex reasoning, and writing during college, leaving an important role for other types of abilities correlated with postbaccalaureate BA degree attainment that are not necessarily directly influenced by status of undergraduate institution.
There are also reasons to expect that catching up by earning an elite graduate degree may be unlikely. One obvious barrier is that the quality of subject-specific education at less-selective institutions is less challenging, placing graduates at a disadvantage in highly demanding graduate programs regardless of standardized test scores and grades. Second, many of the same family and social background characteristics that are more prevalent among graduates of selective institutions, such as parents who are more educated and college peers who are from families with higher socioeconomic status, may continue to prove valuable to graduates of selective institutions throughout their careers.
Third, an additional disadvantage arises from differential access on the basis of undergraduate institution to highly selective graduate programs. Also categorizing institutions using Carnegie classifications, Eide et al. (Reference Eide, Brewer and Ehrenberg1998) find that graduates of elite institutions are more likely to earn postbaccalaureate degrees as well as more likely to earn their graduate degrees from higher-status institutions. Status and type of undergraduate institution are related to not only the likelihood of attending graduate school, but also the type of graduate program an applicant is admitted to, whether the individual completes the graduate program, and the type and status of jobs available after earning a graduate degree. Even among applicants with similar standardized test scores, selectivity of undergraduate institution matters in graduate school admissions (Attiyeh & Attiyeh, Reference Attiyeh and Attiyeh1997). There is evidence that grading has become more generous over time at elite undergraduate institutions while remaining the same at less selective institutions, and that grades are higher at private institutions than at equally selective public institutions (Rojstaczer & Healy, Reference Rojstaczer and Healy2012), both factors which may also increase the likelihood of admission to top graduate programs among graduates of selective undergraduate programs.
Fourth, for a number of reasons, such as lack of information or advice from their faculty advisors, even qualified graduates from less selective institutions may not apply to the most selective graduate programs. Thus, applicants from less-selective undergraduate programs may not be represented within the most highly selective graduate programs, which, especially within professional programs such as law and business, may limit their access to the highest paying jobs (Rivera, Reference Rivera2012).
The NSCG used to estimate Equation (1) does not provide information on the specific institution or on Barron’s selectivity categories and does not provide information on individual standardized test scores or grades. However, no other data set would be adequate to address the question of interest. The data sets that have been used to examine the returns to elite undergraduate education that do include information on individual ability would not provide enough observations for a reliable examination of whether earning an elite graduate degree can offset a less prestigious undergraduate degree. Specifically, because most high school students do not graduate from college, even initially large samples become fairly small after restrictions to college graduates with reported earnings are imposed.Footnote 5 Further restrictions to those with graduate degrees would lead to a far smaller number of observations, with especially few observations for those with an undergraduate degree from a non-selective undergraduate institution but a graduate degree from an elite institution. As indicated by the paucity of studies that have available some source of exogenous variation that may be helpful in identifying a causal relation of elite education on earnings (e.g., admission cutoff to the state flagship university as in Hoekstra, Reference Hoekstra2009), it likewise seems unlikely that there is some unexplored exogenous variation that would be useful in identifying a causal effect of elite graduate education on earnings across a range of degrees and fields, and even less likely that this approach would be feasible to study the question of interest here.
As I discuss in the next section, in order to construct a measure of college quality Z, I use information available in the NSCG on Carnegie classification to group institutions on the basis of selectivity. Because the NSCG used in this article does not include information on standardized test scores or on grades, I restrict the sample used to estimate the earnings equation to those who earned a graduate or professional degree from an elite institution. As discussed earlier, graduate school admissions are based largely on standardized test scores, grades, and selectivity of undergraduate institution. Restricting the earnings sample to those with a postbaccalaureate degree from a selective institution largely places a lower bound on test scores and undergraduate grades. Indeed, as the ethnographic study conducted by Posselt (Reference Posselt2014) identifies, admissions committees at highly ranked PhD programs express great risk aversion and rely strongly on high GRE scores and grades to minimize the risk of admitting applicants who they fear would waste faculty members’ time, as they anticipate students with weaker observable credentials are more likely to struggle with a demanding graduate program. It seems unlikely that selective graduate programs would apply lower standards for standardized tests or grades to students from non-selective undergraduate institutions, as these students would seem to be more risky. Those individuals who move up for their graduate degrees, and successfully earn an elite graduate degree, may be more motivated and ambitious than their counterparts who had an easier path to an elite graduate program. Furthermore, admission test scores are used as inputs into the widely followed U.S. News rankings.Footnote 6 It likewise seems unlikely that graduate programs would risk a decline in their U.S. News & World Report (U.S. News) ranking by admitting graduates of less selective undergraduate institutions who have lower standardized test scores.
Furthermore, to the extent that GRE scores of admitted students differ by type of undergraduate institution, the value of GRE scores diminishes quickly in predicting graduate school success. Studies show that the GRE is a far better predictor of first year graduate school grades than of degree attainment (Kuncel et al., Reference Kuncel, Hezlett and Ones2001; Sedlacek, Reference Sedlacek2004). In addition, the characteristics that result in professional success can be hard to identify ex ante and may only be loosely related to test scores and grades. For example, as Conley and Önder (Reference Conley and Önder2014) demonstrate, even the highest ranked economics PhD programs that enroll the best students produce few graduates who would achieve a tenurable publication record at a medium research university in 6 years, and graduates of lower ranked programs have records not dramatically weaker than graduates of top programs. Presumably, if applicants are matched to PhD programs by their objective information (GREs and grades) so that the highest ranked PhD programs have the highest ability students and lower ranked PhD programs are mainly comprised of lower scoring students, the top PhD programs would produce a far larger share of successful students relative to lower ranked programs.
The empirical analysis that is restricted to those with a graduate degree from an elite institution accounts for a diverse set of factors including ability, motivation, and other unobserved individual characteristics. The full relation of earning a bachelor’s degree from a selective institution over a non-selective institution is provided by the coefficient on Z in Equation (1). To the extent that graduates of less-selective schools are disadvantaged in graduate admissions net of actual ability for graduate study, and are admitted to lower ranked schools within the group of elite institutions, the coefficient on Z correctly reflects the full relation of earning an elite undergraduate degree relative to a non-elite degree. And, by inclusion of a sufficiently rich set of covariates, bias arising from selection on observables is expected to be mitigated.
To examine the labor market mechanisms by which undergraduate institution is related to earnings among those with a graduate degree from an elite institution, I also examine the separate contributions of undergraduate background, type of degree earned, and employment characteristics by estimating an expanded version of Equation (1) as follows:
 $$ {lnY}_i={\boldsymbol{X}}_i\beta +{Z}_i\gamma +{\boldsymbol{M}}_i\delta +{\boldsymbol{D}}_i\theta +{\boldsymbol{LM}}_i\rho +{\varepsilon}_i $$
As in Equation (1), X is a vector of individual characteristics and Z indicates college quality. M is a vector representing undergraduate major, D is a vector representing type of graduate or professional degree, and LM is a vector of employment characteristics. Undergraduate major, type of graduate or professional degree, and employment characteristics may be influenced by type of undergraduate institution. A smaller coefficient on Z in Equation (2) relative to Equation (1) indicates that part of the return to an elite undergraduate degree is manifested through factors such as access to higher paying undergraduate majors, completion of higher paying graduate or professional degrees, or access to jobs and occupations with characteristics associated with higher pay. I report earnings estimates separately by gender; many studies examine men only or else pool men and women in order to have a sufficiently large sample for adequate statistical power. The specific variables included in each vector are discussed next.
3 The NSCG
I use data drawn from fives waves of the NSCG for the survey years 2003, 2010, 2013, 2015, and 2017. This survey is nationally representative of the U.S. population of college graduates and includes 456,861 college graduates residing in the United States who were under age 76 in the year they were surveyed.Footnote 7 Individuals who participate in the survey report detailed information about their education and degrees, employment characteristics, earnings, and personal characteristics, including parents’ education. Most notably, there are 222,915 respondents with postbaccalaureate degrees.
Although the NSCG does not report information on specific institutional quality or selectivity, it does report the 1994 Carnegie classification for respondents who are graduates of U.S. institutions, and this information is used in this article to categorize institutions. The Carnegie classifications are designed to group institutions based on similarity of structure and mission (e.g., undergraduate teaching, graduate education) and take into account institutional focus (e.g., priority given to research, federal research funding) and field breadth and quantity of graduate degrees (if any) awarded. The NSCG survey also indicates whether the institution is private or publicly funded.
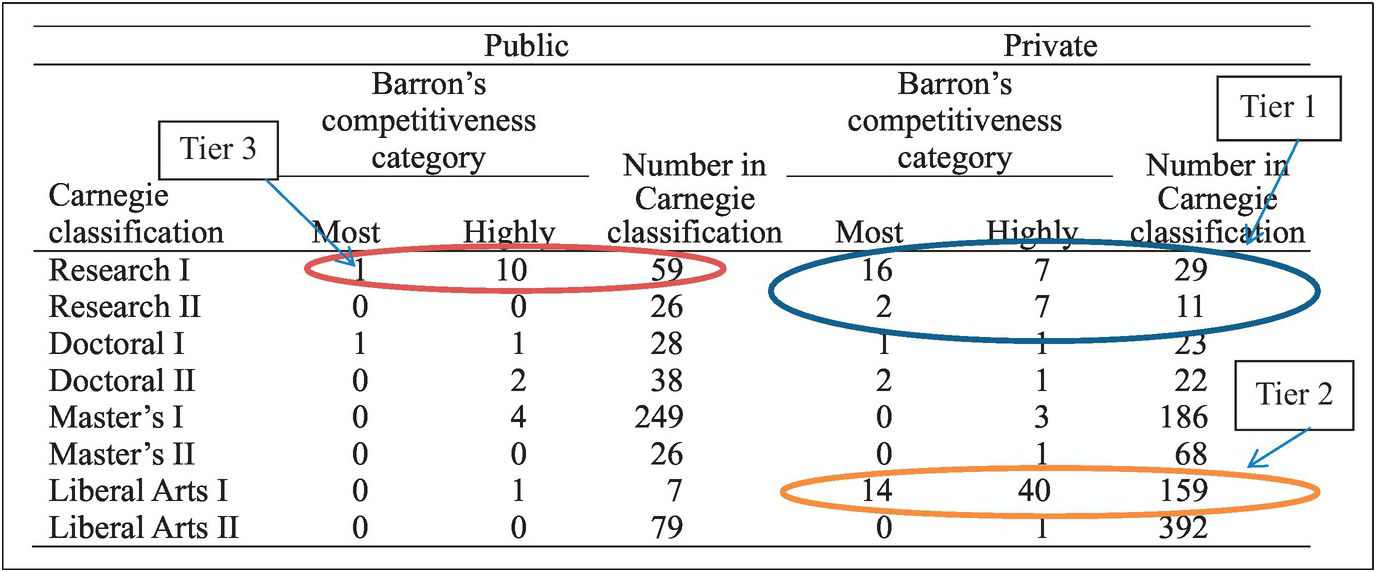
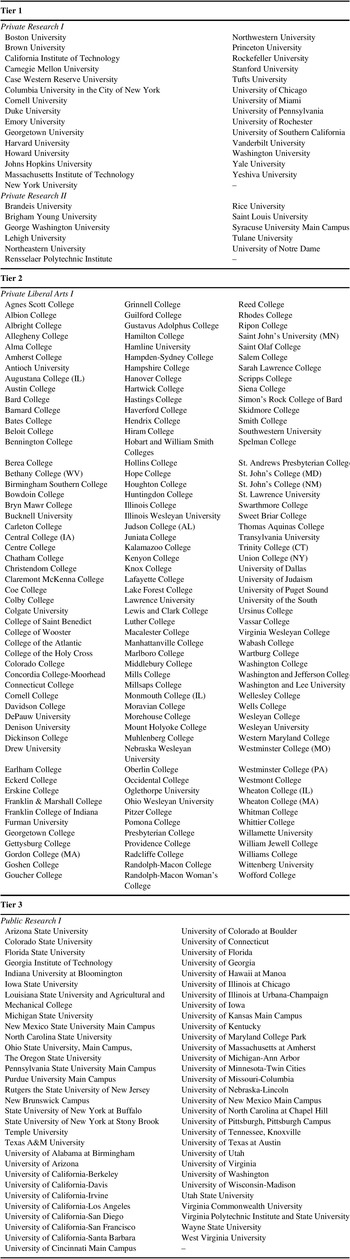
The Carnegie classifications are not designed to rank institutions by selectivity. By comparing the individual institutions within the 1994 Carnegie classifications to Barron’s Profiles of American Colleges for 1994, Hersch (Reference Hersch2013) creates a grouping into four tiers. Barron’s rankings are based on quality indicators of the entering freshman class (SAT or ACT, high school GPA and high school class rank, and percent of applicants accepted) and are widely used in studies estimating the return to college status. Hersch’s tier groupings are constructed so that the share of schools rated by Barron’s as most or highly competitive is significantly different between groups.Footnote 8Figure 1 shows the number of institutions grouped into tiers 1–4 by Carnegie classification that are categorized by Barron’s as most or highly competitive. All schools in the chart that do not fall into tiers 1–3 are grouped into tier 4. Tier 1 institutions are private Research I and private Research II universities; tier 2 institutions are private Liberal Arts I colleges (selectivity is taken into account in the distinction between Liberal Arts I and Liberal Arts II); tier 3 are public Research I universities; and tier 4 are the remaining 4-year colleges and universities with Carnegie classification available, excluding specialized institutions which focus on a narrow curriculum, such as schools of art, music, and design or theological seminaries, and professional schools in fields such as law, business, and medicine.
Comparison of Carnegie classifications and Barron’s selectivity categories. This table reports by Carnegie classification and public or private institutional control the total number of institutions awarding bachelor’s and higher degrees and the number of institutions that are classified by Barron’s as most competitive or highly competitive. See Carnegie Foundation for the Advancement of Teaching (1994) and Barron’s Educational Series (1994).

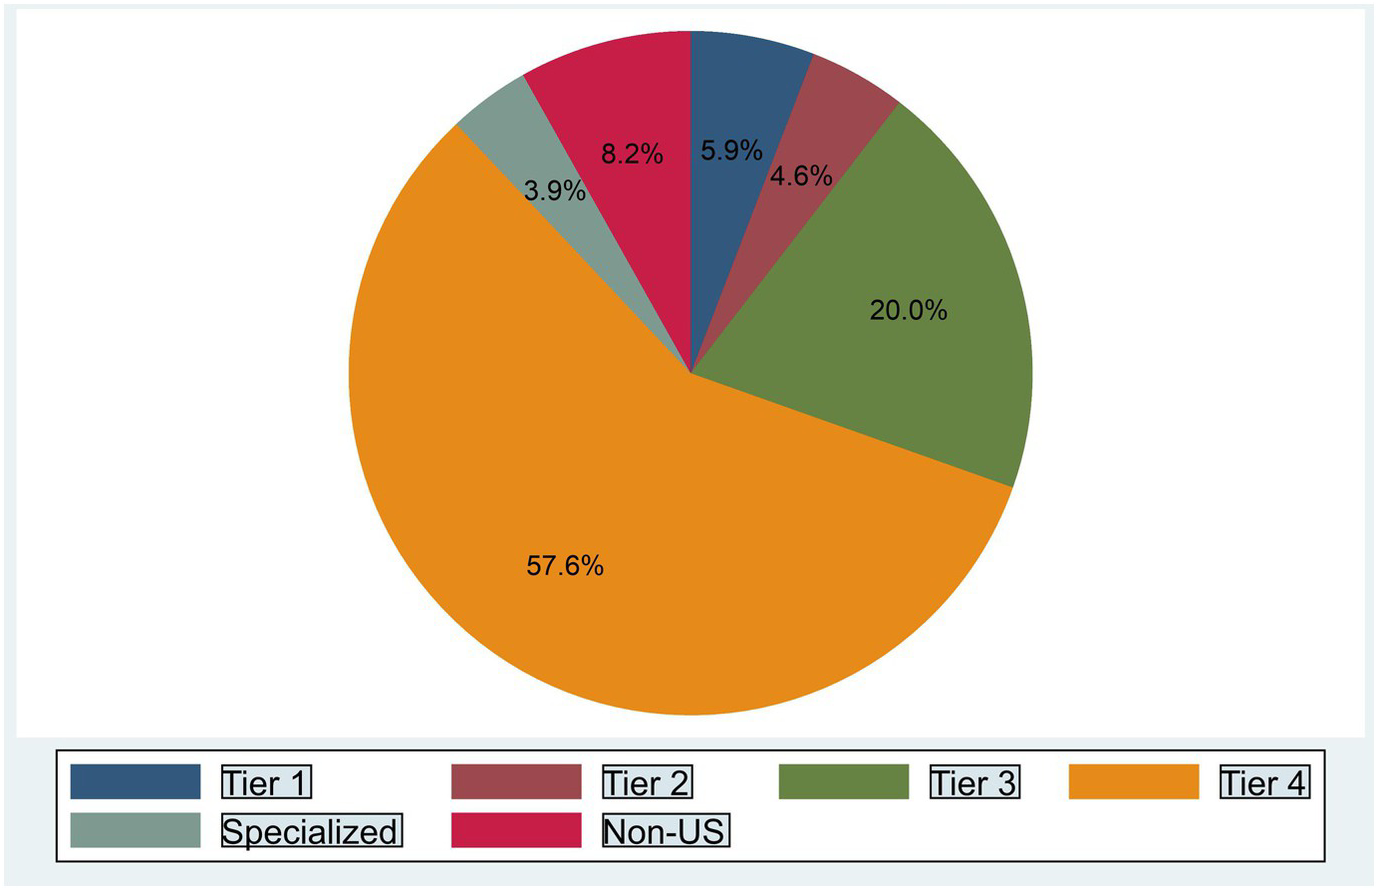
Figure 2 shows the distribution of the NSCG respondents based on their bachelor’s degree institution type. More than half of the college graduates – 58% – graduated from colleges and universities in tier 4. The share of the U.S. population that enroll in tier 4 schools is actually far higher, because graduation rates are far lower in these schools than in the more-selective institutions in tiers 1–3 (U.S. Department of Education & National Center for Education Statistics, 2018a).
Distribution of undergraduate institution type.

Barron’s is a ranking of undergraduate institutions, and there is no corresponding system that ranks universities overall based on their professional and graduate degree programs, although numerous rankings of specific programs exist.Footnote 9 Postbaccalaureate degrees are therefore also grouped into tiers using the same Carnegie classifications and are indicated by the prefix “post-BA.” I also compared these constructed tier classifications with the U.S. News rankings of corresponding specific degree programs.
The relative ranking of post-BA tiers requires some explanation. As noted above, post-BA tier 1 includes private Research I and private Research II institutions and post-BA tier 3 includes public Research I institutions. Tier 2 institutions are selective private liberal arts colleges. Liberal arts colleges offer few graduate degrees, although many do offer some graduate degrees, and the status of graduate programs awarded by tier 2 institutions varies.Footnote 10 For example, a review of U.S. News rankings of law and MBA programs offered by tier 2 institutions indicates that they are typically ranked below the corresponding programs in tier 1 and tier 3 institutions and are ranked similarly to tier 4 institutions.Footnote 11 Other master’s degrees offered by tier 2 institutions, however, are typically ranked similarly to the overall institution. Because so few respondents earn graduate degrees from tier 2 institutions, no results are affected by how these respondents are treated in the analyses.
Finally, the relative ranking of specialized institutions that do not fall into tiers 1–4 defined above differs by type of degree. There are 18 law schools and 12 business schools classified as specialized by the 1994 Carnegie classifications, and these institutions are typically ranked below those in tiers 1–4 based on U.S. News rankings (or are not ranked at all). But 42 of the 141 accredited medical schools are classified in the Carnegie classifications as specialized, including some associated with major public research universities as well as medical schools associated with major hospitals such as the Mayo Clinic. The U.S. News ranking of medical schools classified as specialized varies considerably, with, for example, 7 ranked in the top 25 and 17 unranked. There are too few graduates of other specialized graduate programs such as arts or theology to analyze separately.
Clearly, each tier grouping includes schools that range in selectivity. For example, although 32 of the 40 schools combined into tier 1 are rated by Barron’s as most or highly competitive, the grouping combines schools recognized as the most prestigious (such as Harvard) together with other schools that are grouped into the same Carnegie classification (and, for that matter, the same Barron’s category) but are not Harvard. As discussed earlier, if graduates of less-selective institutions are disadvantaged in admission to the highest-ranked graduate programs within a given tier, then the premium to elite undergraduate in Equation (1) correctly reflects the full relation of earning an elite undergraduate degree relative to non-elite undergraduate degree. But, because the NSCG data used here does not provide information on test scores or grades, nor on the actual school awarding degrees, a direct test of whether the estimated premium to elite undergraduate institutions is due to unobserved ability cannot be conducted.Footnote 12 However, my analysis of the data (discussed later) suggests that graduates of less-selective undergraduate institutions are not necessarily disproportionately represented in the lower ranked graduate programs.
The NSCG data report two measures of earnings. One question asks about basic annual salary on the principal job, excluding additional sources of income such as bonuses and overtime. A second question asks for total earned income from all sources in the preceding year.Footnote 13 Because the latter measure of earnings is more inclusive of the types of compensation received in many high-paying occupations, such as bonuses and commissions, the main results are based on total earned income from all sources in the preceding year. For both questions, for confidentiality, the survey does not report actual earnings for very high earners (those in the top 0.5% of earnings), but instead reports an average value among these very high earners.Footnote 14 All earnings values reported here are adjusted for inflation and are in $2017.
In the earnings analyses, I restrict the sample to those with annual earnings in the preceding year of at least $10,000 in $2017, in order to consider those with some minimal level of employment in the preceding year and to eliminate likely reporting errors (for instance, reported annual income is as low as $1 in the sample).Footnote 15
In addition to earnings information and Carnegie classification discussed above, the NSCG includes detailed information about educational attainment. I group field of bachelor’s degree into eight categories: Arts/Humanities; Business/Economics; Education; Engineering; Math/Computer Science; Science; Social Science; and other fields such as architecture, social work, communications, journalism, home economics, or library science. Combining information on field of study and type of degree (recorded as bachelor’s, master’s, professional, or doctorate), I create eight mutually exclusive categories for highest degree PhD, MD,Footnote 16 JD, MBA, MA in education, MA in a field other than education or business, other professional degree, and highest degree bachelor’s.Footnote 17
The labor market information available in the NSCG is quite detailed. The earnings regressions corresponding to Equation (2) control for tenure and potential experience (with potential experience defined as elapsed time since highest degree, as actual years of work experience are not requested by the survey). I also include indicators for full-time employment, class of worker (self-employed, government employer, or private employer), occupation grouped into nine categories based on the 2010 Standard Occupational Classification intermediate aggregation level (Management, Business, Financial; Computer, Engineering, Science; Education, Legal, Community Service, Arts, Media; Healthcare Practitioners and Technical; Service; Sales and Related; Office and Administrative Support; Natural Resources, Construction, Maintenance, Production, Transportation, Material Moving [referred to in tables as “traditional blue-collar”]; and a final category for occupations not reported), firm size (in eight categories of number of employees: less than 10; 10–24; 25–99; 100–499; 500–999; 1000–4999; 5000–24,999; 25,000 or more), and for employer located in the South.
Individual information includes indicators for ethnicity (whether Hispanic/Latino), race (white, Black/African-American, Asian, all other races or multiple races), age, and native-born U.S. citizen. Parents’ education is recorded for each parent in eight categories (less than high school, high school graduate, some college, bachelor’s degree, master’s degree, professional degree, PhD, education not reported). High school location is grouped into region (Northeast, West, Midwest, South, outside United States). Because about 80% of individuals who attend college were from the state where they enrolled, and there is a concentration of selective colleges in the Northeast, controlling for high school region provides a partial control for the costs of attending a selective college.Footnote 18
4 Parents’ education and degree attainment by undergraduate tier
4.1 Parents’ education
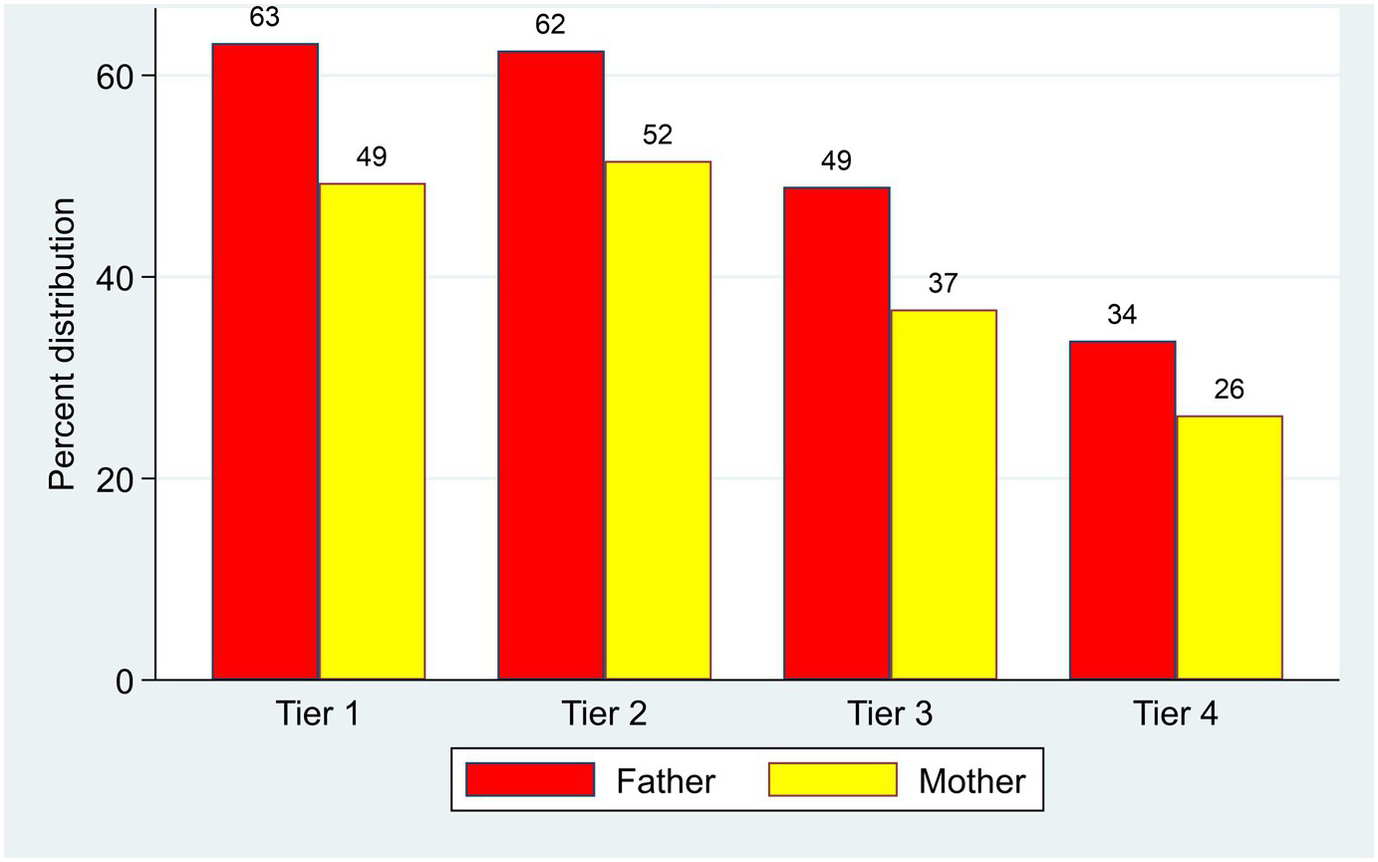
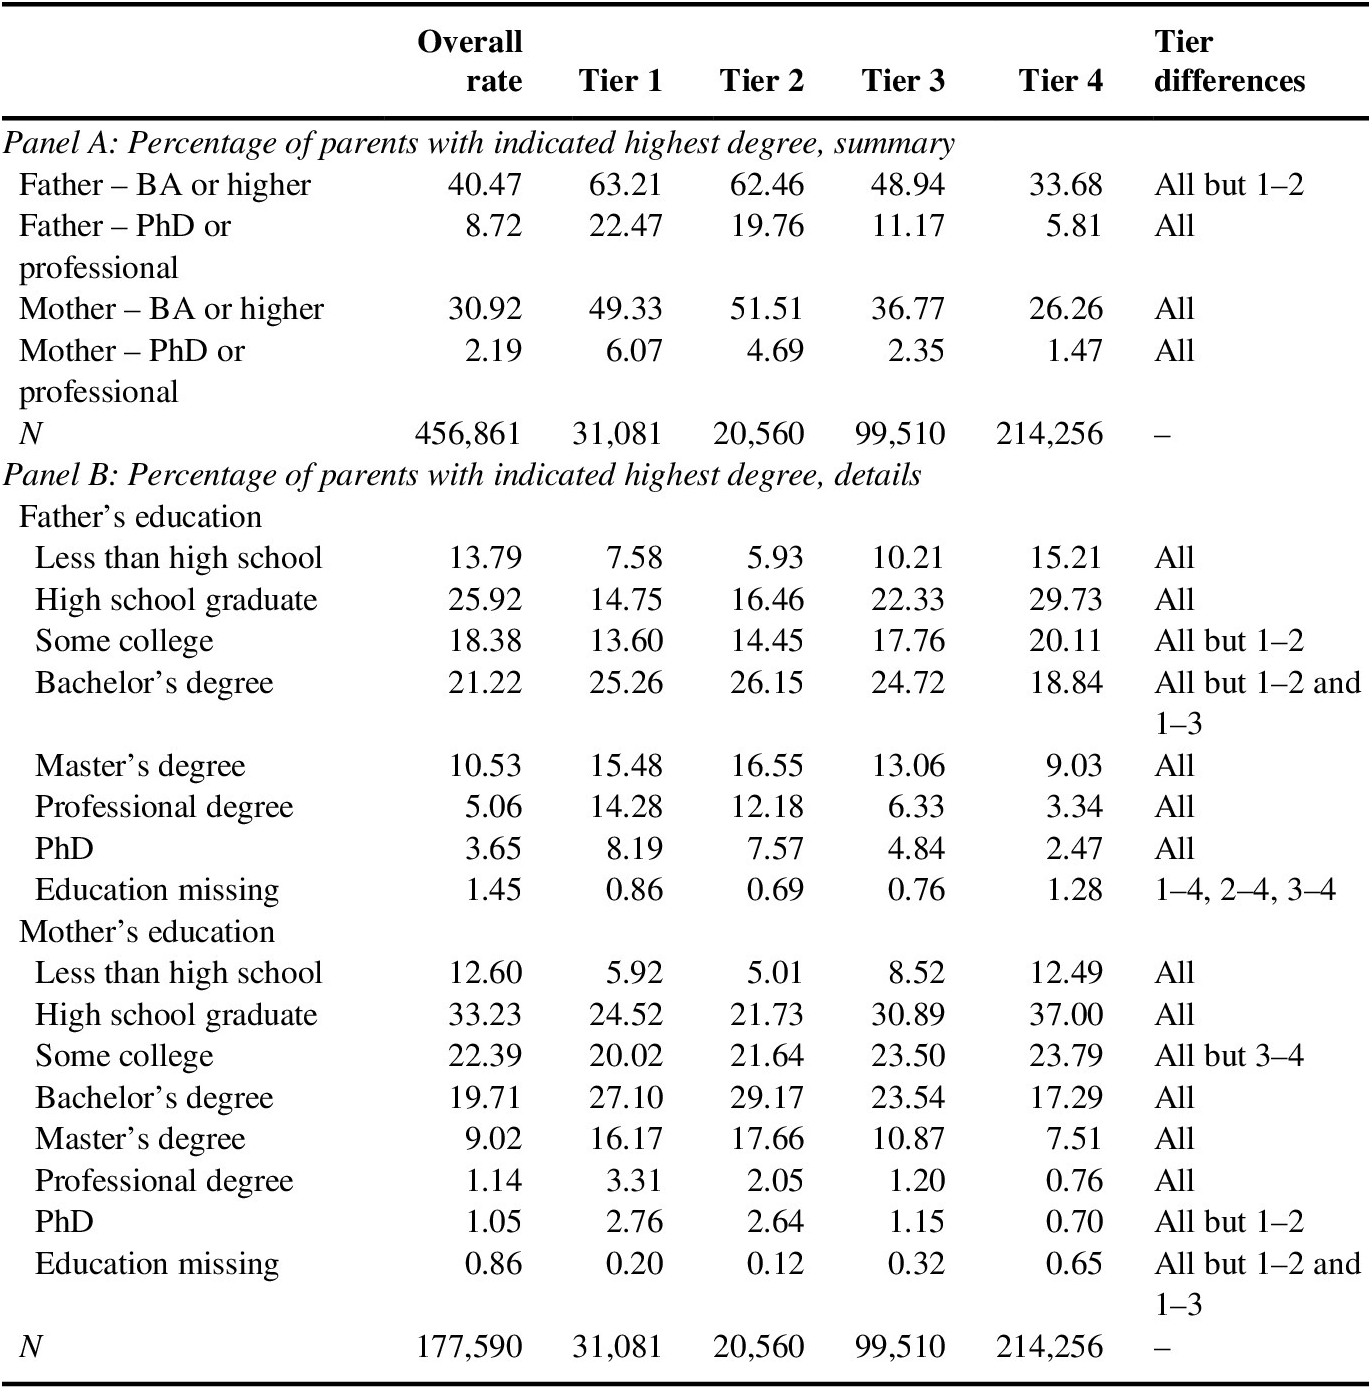
The NSCG does not report information on parents’ actual income or wealth. But, earnings are strongly related to education, and families with more-educated parents have higher income. Parents’ education is also a strong predictor of family wealth (Charles et al., Reference Charles, Hurst and Killewald2013). As we see from Figure 3, there is a substantial difference in parents’ educational attainment by tier. Bachelor’s degree graduates of tier 1 and tier 2 schools are nearly twice as likely as graduates of tier 4 schools to have parents who are themselves college graduates.
Percent with parents’ education BA or higher by tier.

Table A2 provides additional information on the distribution of parents’ educational background based on undergraduate tier of the sample member and indicates statistically significant differences between tiers. As Table A2 shows, not only are parents of tier 1 and 2 graduates more likely to have at least a bachelor’s degree, but they are also far more likely to have a professional degree or a PhD. Specifically, the fathers of 22% of tier 1 graduates have a professional degree or a PhD, in contrast to less than 6% of the fathers of tier 4 graduates.Footnote 19
4.2 Own highest degree by tier
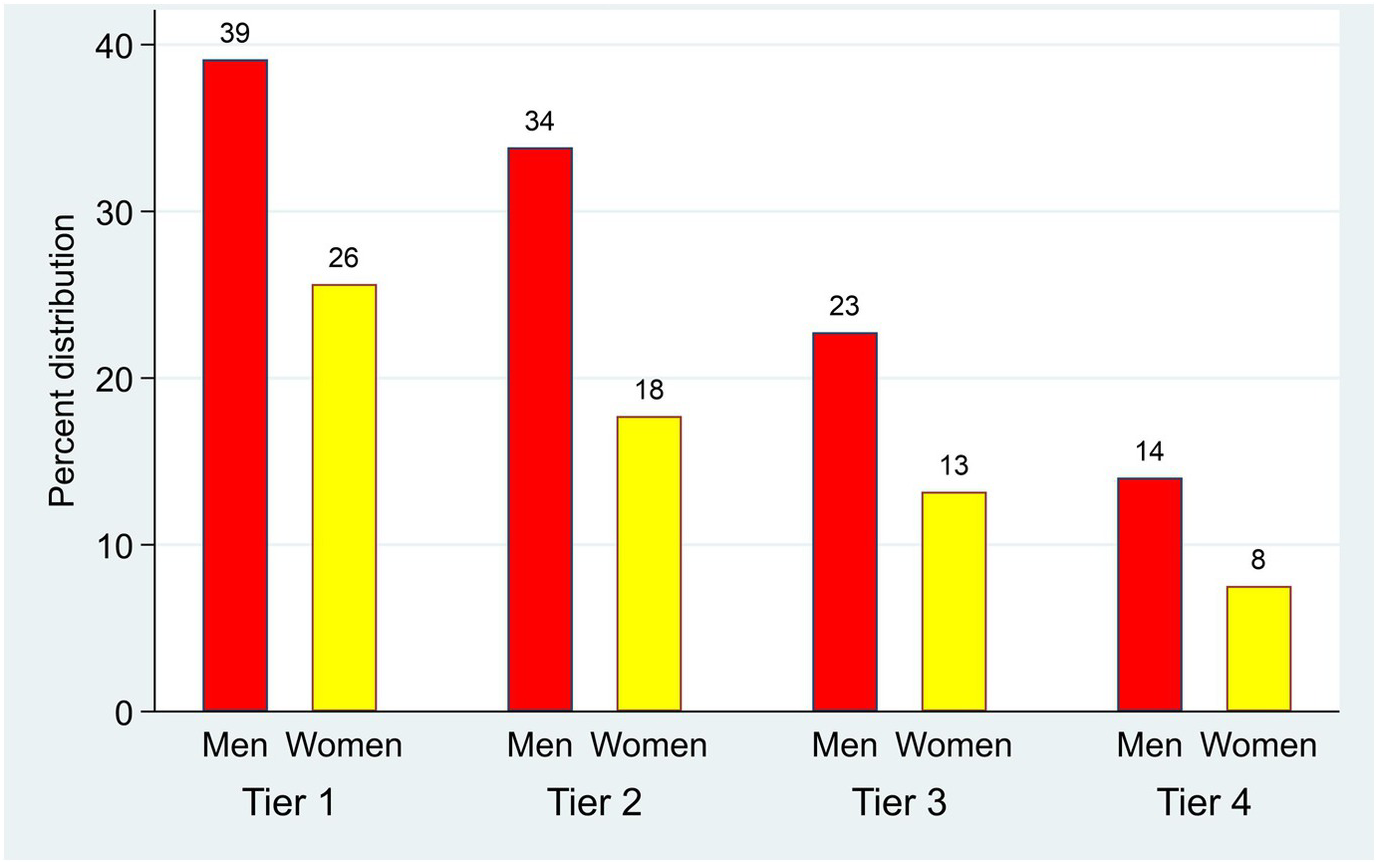
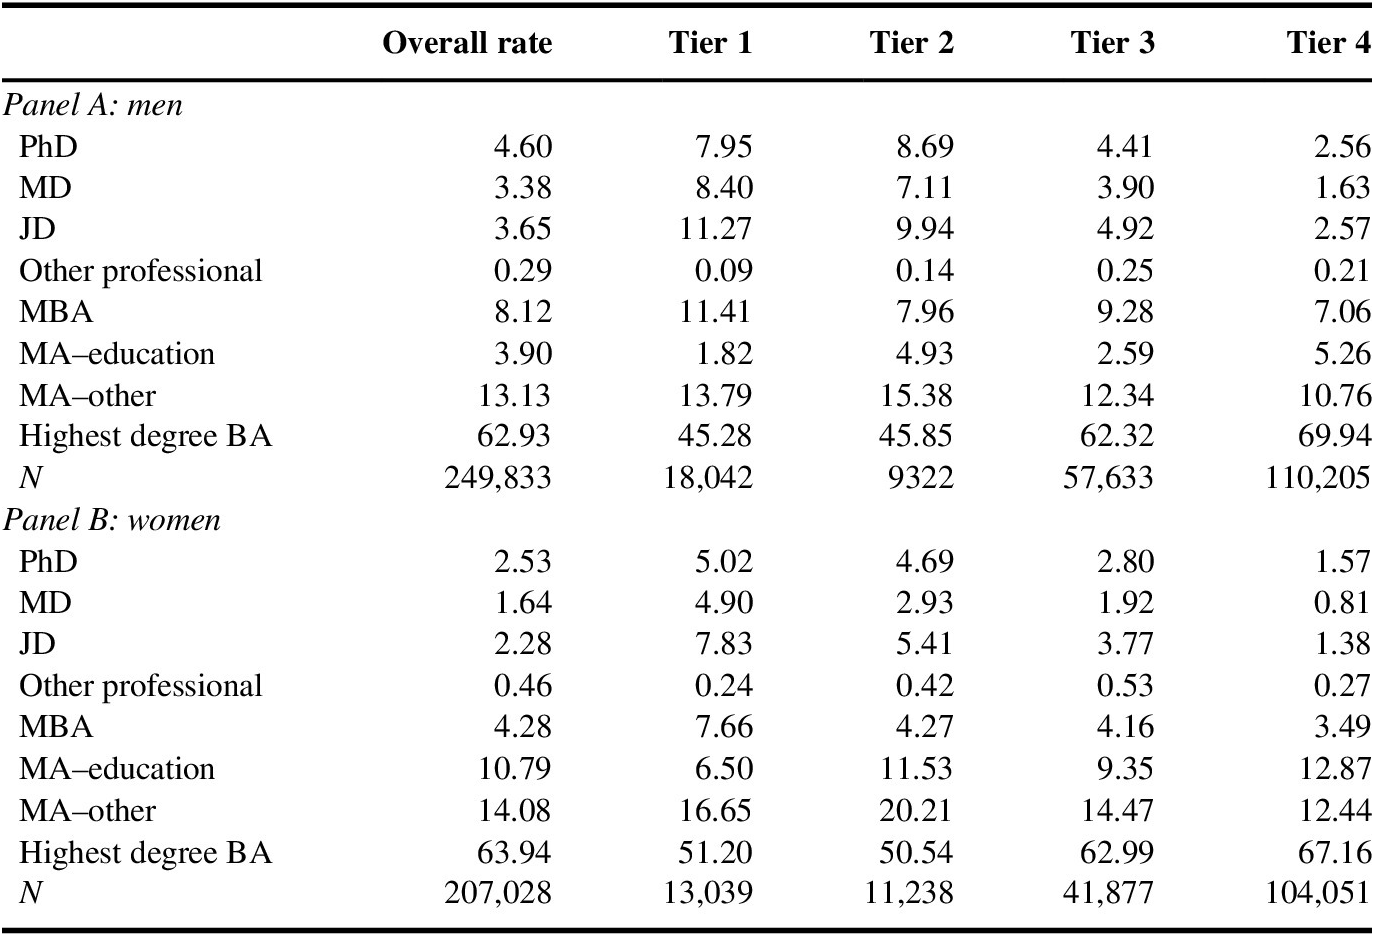
The likelihood of earning a postbaccalaureate degree and the type of graduate degree is strongly related to undergraduate institution. There are stark differences by undergraduate tier in the share of graduates who earn advanced degrees. Figure 4 gives the share by undergraduate tier and gender with highest degree PhD, MBA, or other professional degree such as MD or JD. (Additional detail is provided in Table A3.) As Figure 4 shows, looking within gender, the share of college graduates with a professional degree or a PhD drops steadily as we move from tier 1 to tier 4, with tier 1 graduates about three times as likely to earn a professional degree or PhD as those of the same gender in tier 4.
Percent with own professional, PhD, or MBA degree by tier and gender.

The detailed statistics reported in Table A3 show large differences in the likelihood of earning specific degrees as we move from tiers 1 and 2 to tier 4. For instance, among male tier 1 graduates, 8% have medical degrees and 11% have law degrees. In contrast, among male tier 4 graduates, less than 2% have medical degrees and less than 3% have law degrees.
4.3 Distribution of post-BA outcomes by undergraduate tier, all college graduates
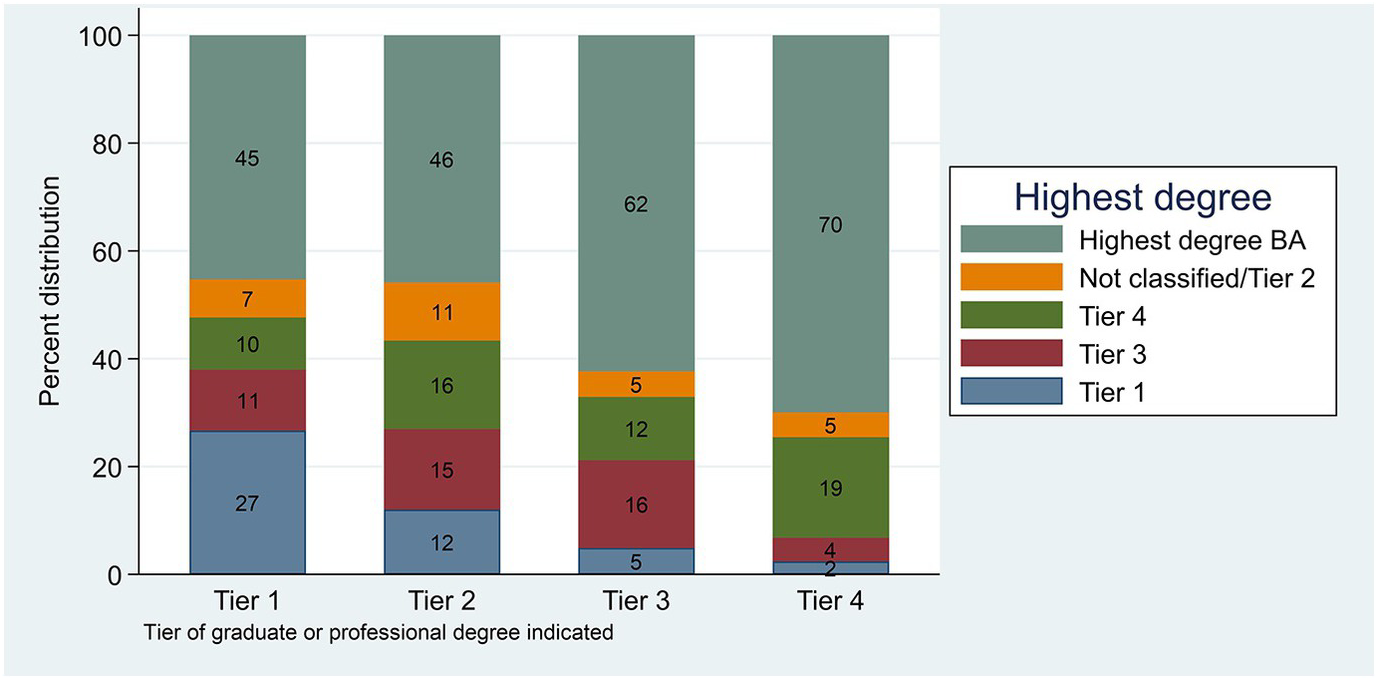
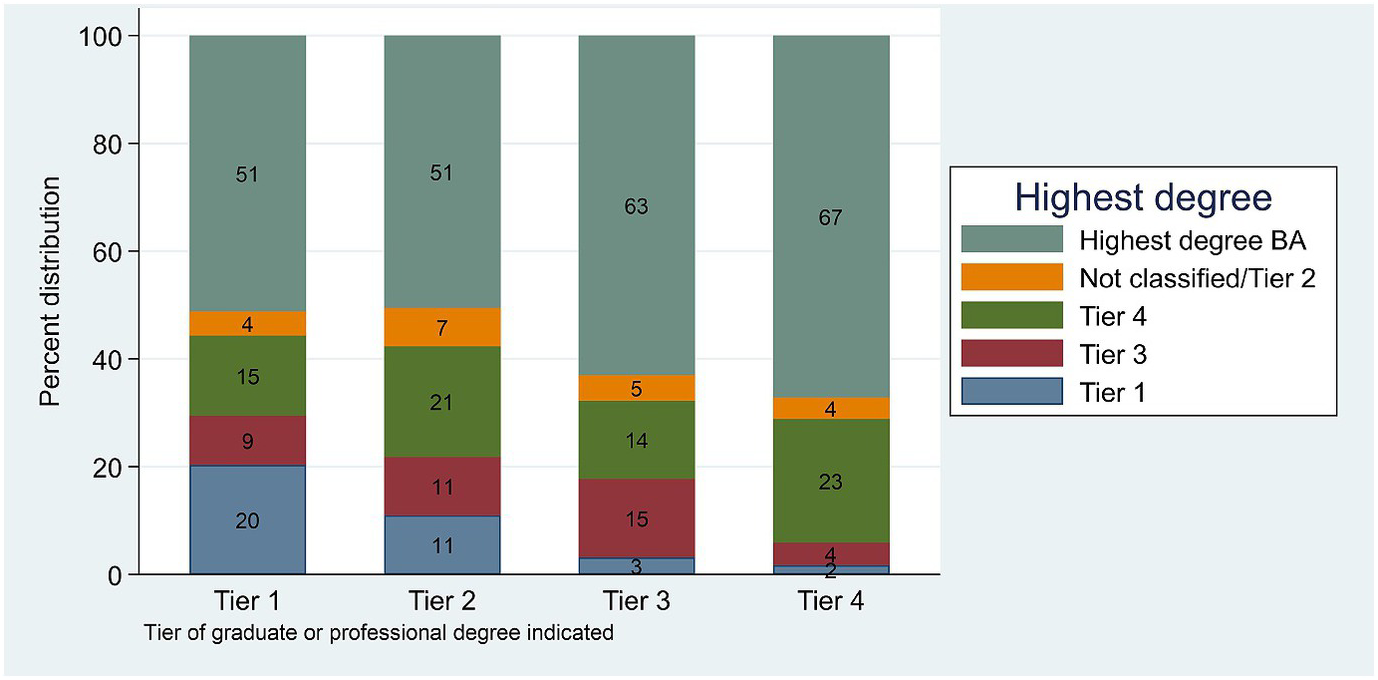
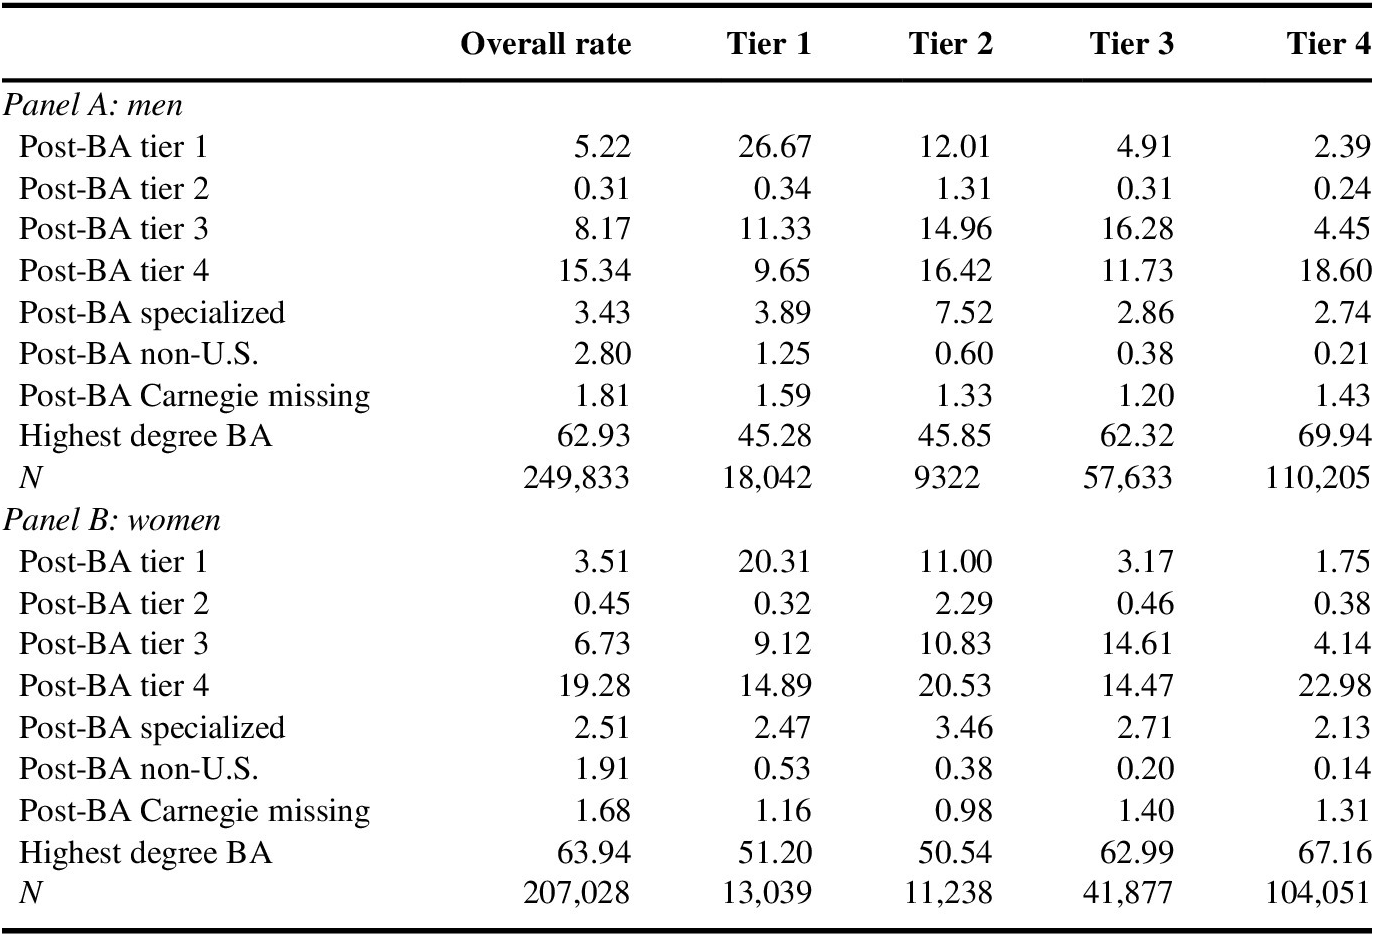
Figure 4 examines, by undergraduate tier, the likelihood of earning a professional, PhD, or MBA degree from an institution of any type. Figures 5 and 6 provide more detailed information on the relation between undergraduate tier and the likelihood of earning any postbaccalaureate degree (including master’s in addition to professional, PhD, or MBA) and the post-BA tier of the graduate institution awarding any postbaccalaureate degrees. (Additional detail is provided in Table A4.)
Distribution of men’s post-BA outcomes by BA tier.

Distribution of women’s post-BA outcomes by BA tier.

Among tier 4 graduates, the highest degree earned is the bachelor’s degree for 70% of men and 67% of women. In contrast, more than half of male tier 1 and tier 2 graduates have a postbaccalaureate degree, as do nearly half of the female tier 1 and tier 2 graduates.
Figures 5 and 6 also indicate the post-BA tier of those with graduate degrees. The likelihood of moving from a non-selective to a selective institution for a graduate degree of any kind is low. In part because tier 1 graduates are also far more likely to earn a graduate degree, tier 1 graduates are about 10 times more likely to have a graduate degree from a tier 1 institution than is a tier 4 graduate. Specifically, among tier 1 graduates, 27% of men and 20% of women also earn a tier 1 post-BA degree. In contrast, the odds of a tier 4 graduate having a graduate degree from a tier 1 institution are quite small – 2% among both men and women. The probability of a tier 4 graduate earning a graduate degree from a tier 3 institution is higher, in part because tier 3 institutions are considerably larger, but is still quite small, at 4% for both men and women.
4.4 Distribution of BA tier by post-BA tier
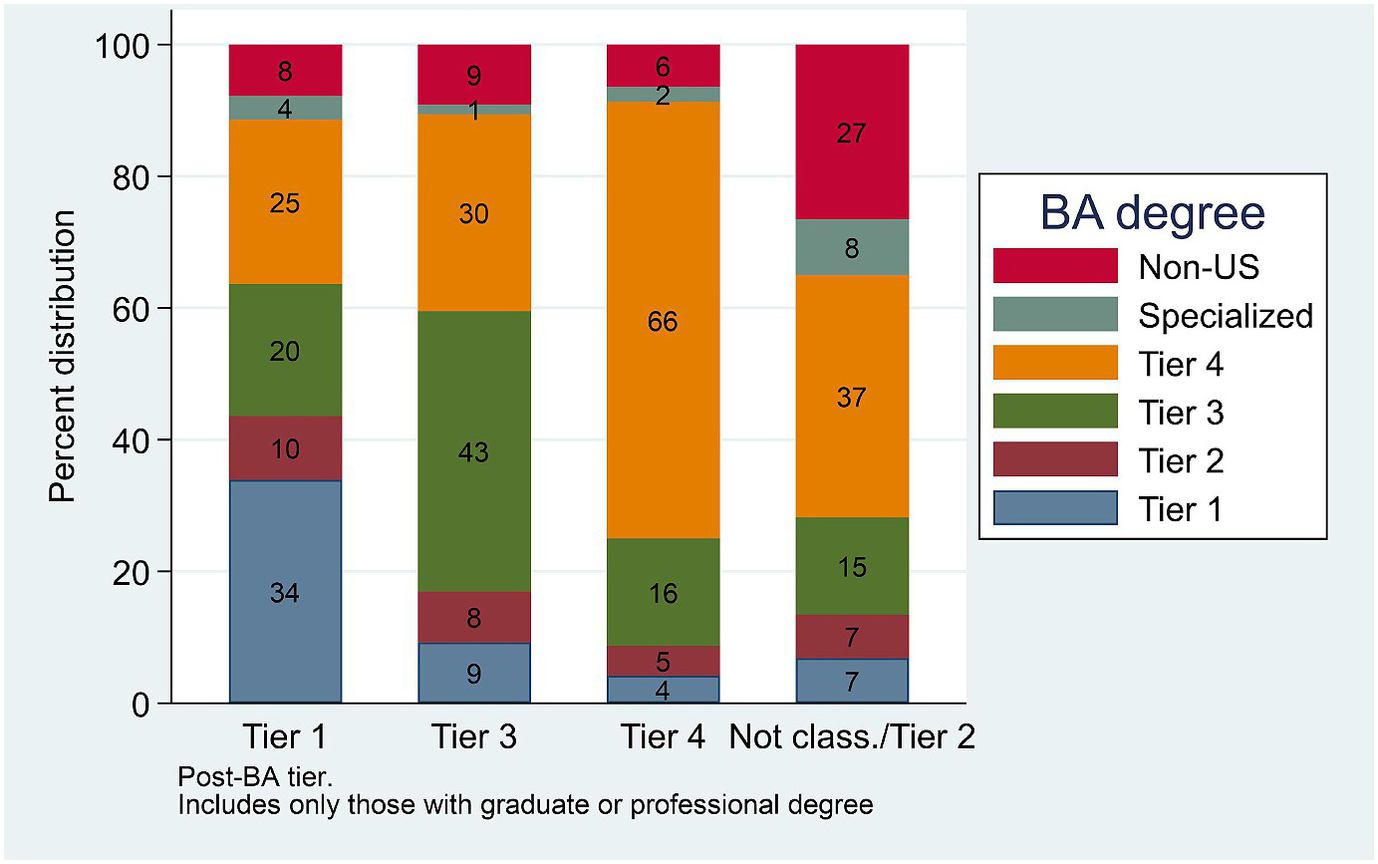
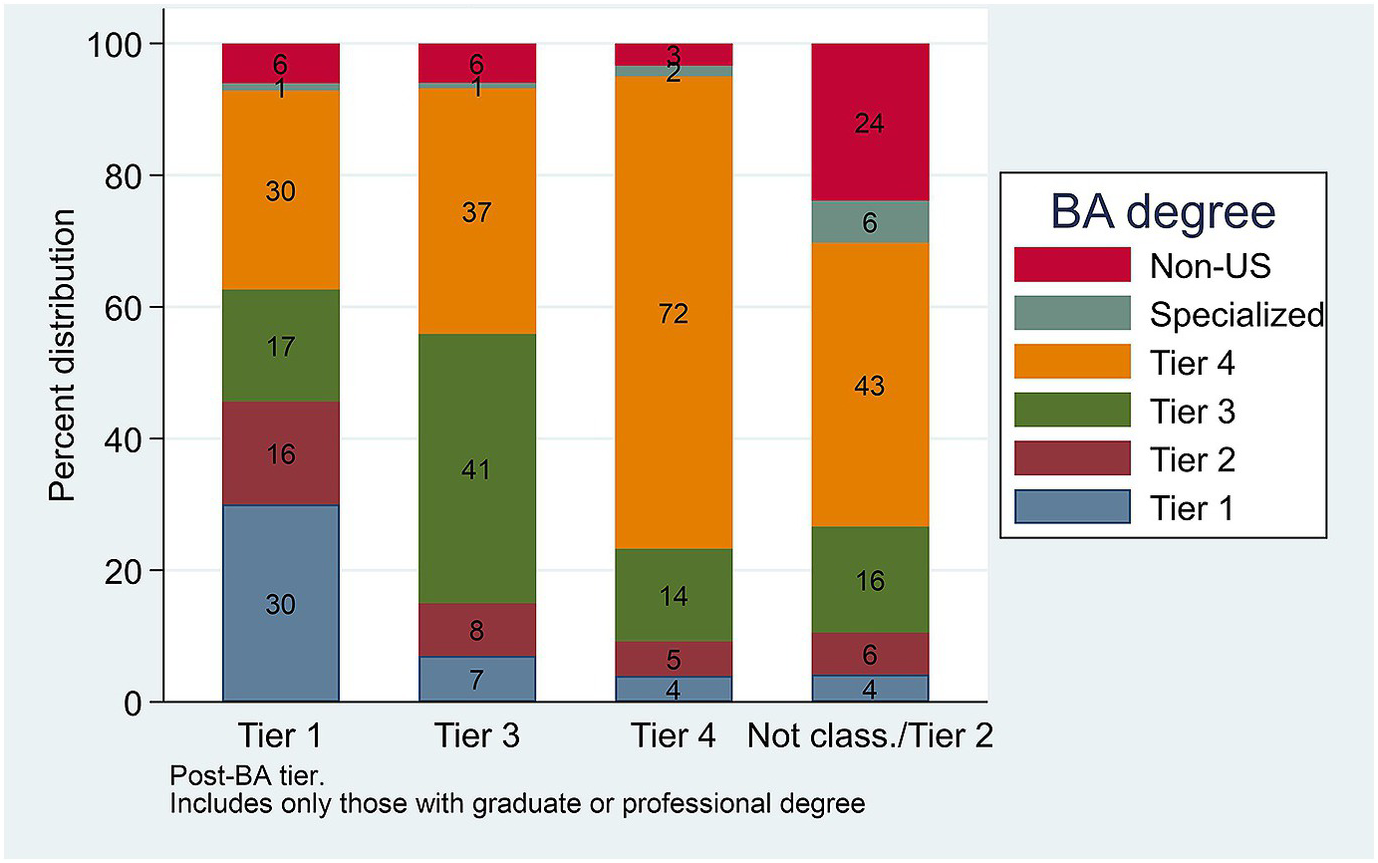
As Figures 5 and 6 show, not only does the likelihood of earning a postbaccalaureate degree differ by undergraduate tier, but also most college graduates who earn a postbaccalaureate degree earn their degrees from institutions similar to their undergraduate institution. But, because the majority of college graduates are graduates of tier 4 institutions, even though a smaller share of tier 4 graduates earn a post-BA degree, tier 4 graduates may well form a large share of elite graduate programs. Figures 7 and 8 show that BA graduates of tier 4 institutions remain in the minority among post-BA graduates of selective institutions.Footnote 20
Distribution of men’s BA degree tier by post-BA tier.

Distribution of women’s BA degree tier by post-BA tier.

These figures also offer suggestive information on whether undergraduates from tier 4 institutions systematically place lower in the graduate school hierarchy relative to graduates of tiers 1–3. Based on the tier groupings, tier 1 institutions are more likely to be highly selective than are tier 3 institutions. If BA graduates of tier 4 institutions are less qualified for graduate study than are tiers 1–3 BA graduates, we would expect them to form a larger share of post-BA tier 3 graduates relative to post-BA tier 1 graduates, but, as Figures 7 and 8 show, the difference is fairly minor. Among men, 25% of tier 1 post-BA graduates and 30% of tier 3 post-BA graduates have tier 4 BA degrees. Similarly, among women, 30% of tier 1 post-BA graduates and 37% of tier 3 post-BA graduates have tier 4 BA degrees. In contrast, BA graduates of tier 3 form a far smaller share of graduates with post-BA degrees from a tier 1 institution than from a post-BA tier 3 institution. Among tier 1 post-BA graduates, only 20% of men and 17% of women have tier 3 BA degrees, in contrast to 43% of men and 41% of women who are graduates of tier 3 post-BA institutions. Although clearly not conclusive, the pattern does not indicate that undergraduate tier 4 graduates are primarily sorting to lower ranked institutions within tiers.Footnote 21
5 Earnings by tier
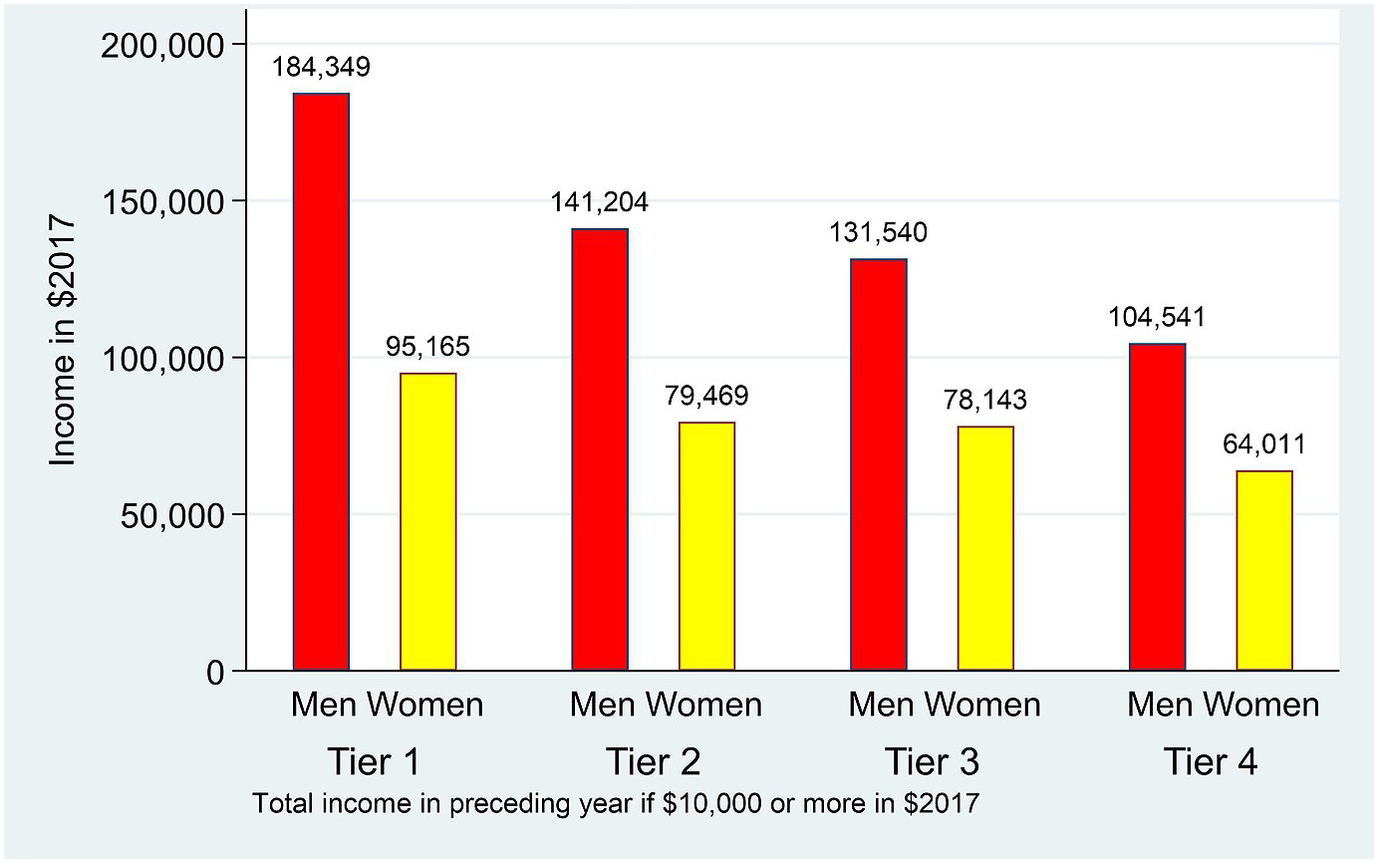
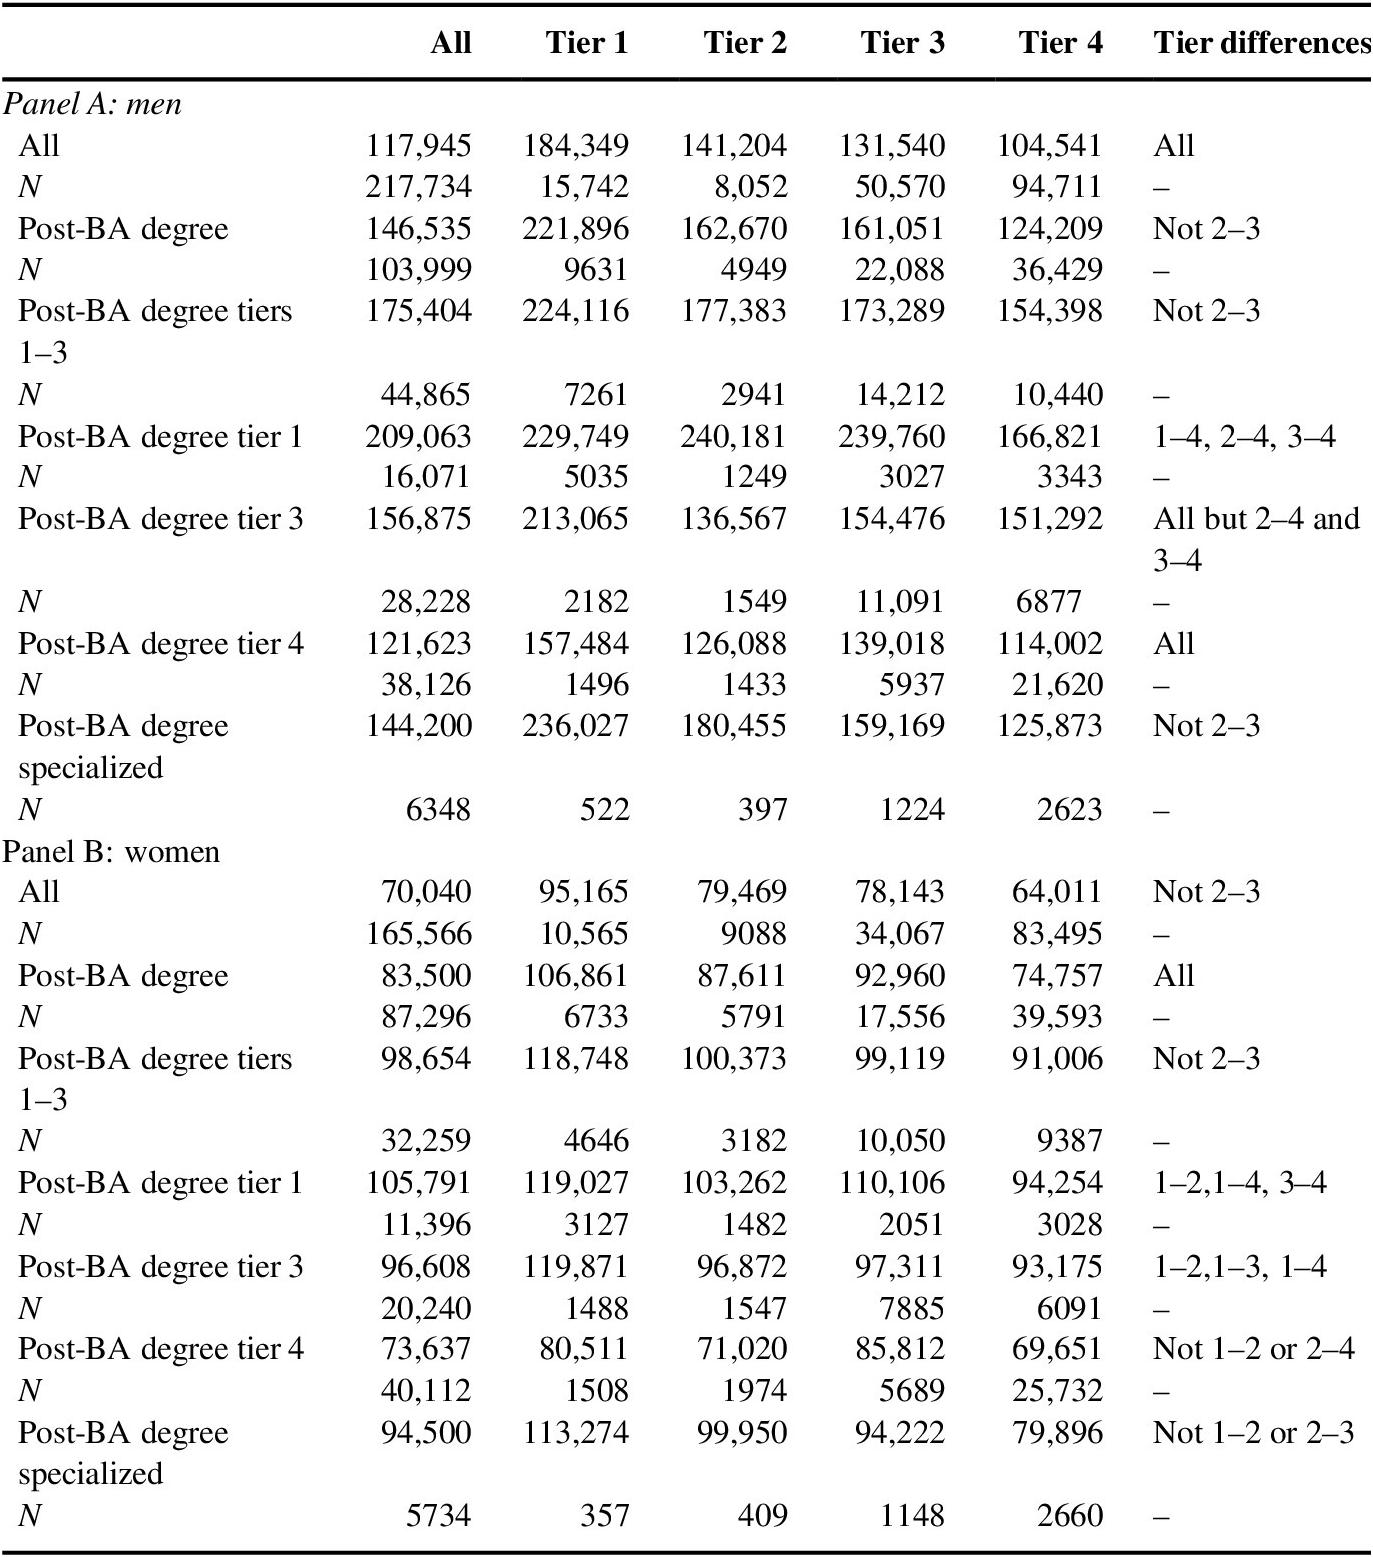
Before turning to regression estimates of earnings equations, it is useful to look at some descriptive statistics for earnings on the basis of undergraduate tier. (Table A5 provides additional information as well as reports tests for statistically significant differences between pairs of undergraduate tiers.) Figure 9 shows average income by tier and gender among those with income of at least $10,000 in the preceding year. A few things to note: first, the earnings pattern within gender follows the pattern of selectivity of the undergraduate institution, with tier 1 graduates having the highest average earnings and tier 4 graduates the lowest. Second, graduates of tier 1 schools earn considerably more than all other graduates. On average, male graduates of tier 1 schools earn 31% more than male tier 2 graduates, 40% more than male tier 3 graduates, and 76% more than male tier 4 graduates. Female graduates of tier 1 schools earn 20–22% more than female tier 2 or tier 3 graduates, and 49% more than female tier 4 graduates. Third, on average, women earn far less than men, even when they graduate from similarly selective schools, and even when we only include in our average those earning at least $10,000 per year (so that we are not averaging in zero earnings of those women who are not in paid employment). Fourth, although women’s average earnings decline as we move from tier 1 to tier 4, the disparity in earnings by tier is smaller for women than it is for men, reflecting the lower labor market activity and corresponding lower career investment made by female graduates of elite institutions as identified in Hersch (Reference Hersch2013).
Average annual income by BA tier and gender.

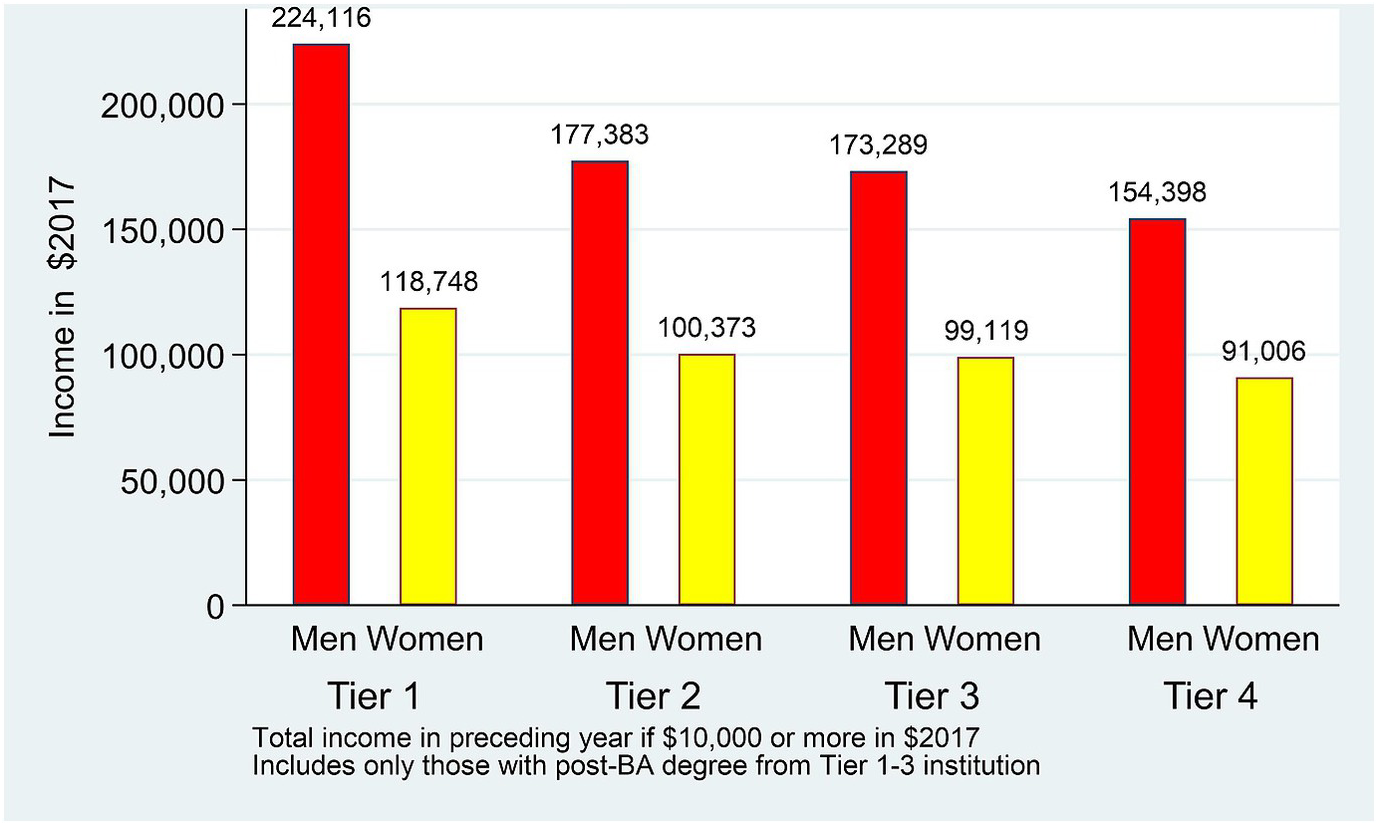
To examine a more homogeneous group, Figure 10 compares average income on the basis of undergraduate tier for those who earn a post-BA degree from an institution in tiers 1–3. To the extent that ability and motivation differences are reduced, we should see a smaller disparity in earnings on the basis of undergraduate tier among graduates with post-BA degrees from selective institutions.
Average annual income with tier 1–3 post-BA degree by BA tier and gender.

Figure 10 shows that, as expected, average earnings are higher among those with a postbaccalaureate degree from a selective institution than in the full sample that includes all college graduates, regardless of whether they have a graduate degree and the status of any graduate degree. But most importantly, even among those with graduate degrees from elite institutions, the earnings gap between those with bachelor’s degrees from tier 4 institutions and between those with bachelor’s degrees from institutions in tiers 1–3 remains large. For example, compared to those with post-BA degrees from similarly selective institutions, male tier 1 graduates earn on average around 26–29% more than male tier 2 and 3 graduates and 45% more than male tier 4 graduates. Female tier 1 graduates earn on average 18–20% more than female tier 2 or tier 3 graduates, and 30% more than female tier 4 graduates. Thus, although the disparity between tiers is reduced, earning an elite graduate degree does not eliminate the substantial pay gaps associated with an elite undergraduate degree.
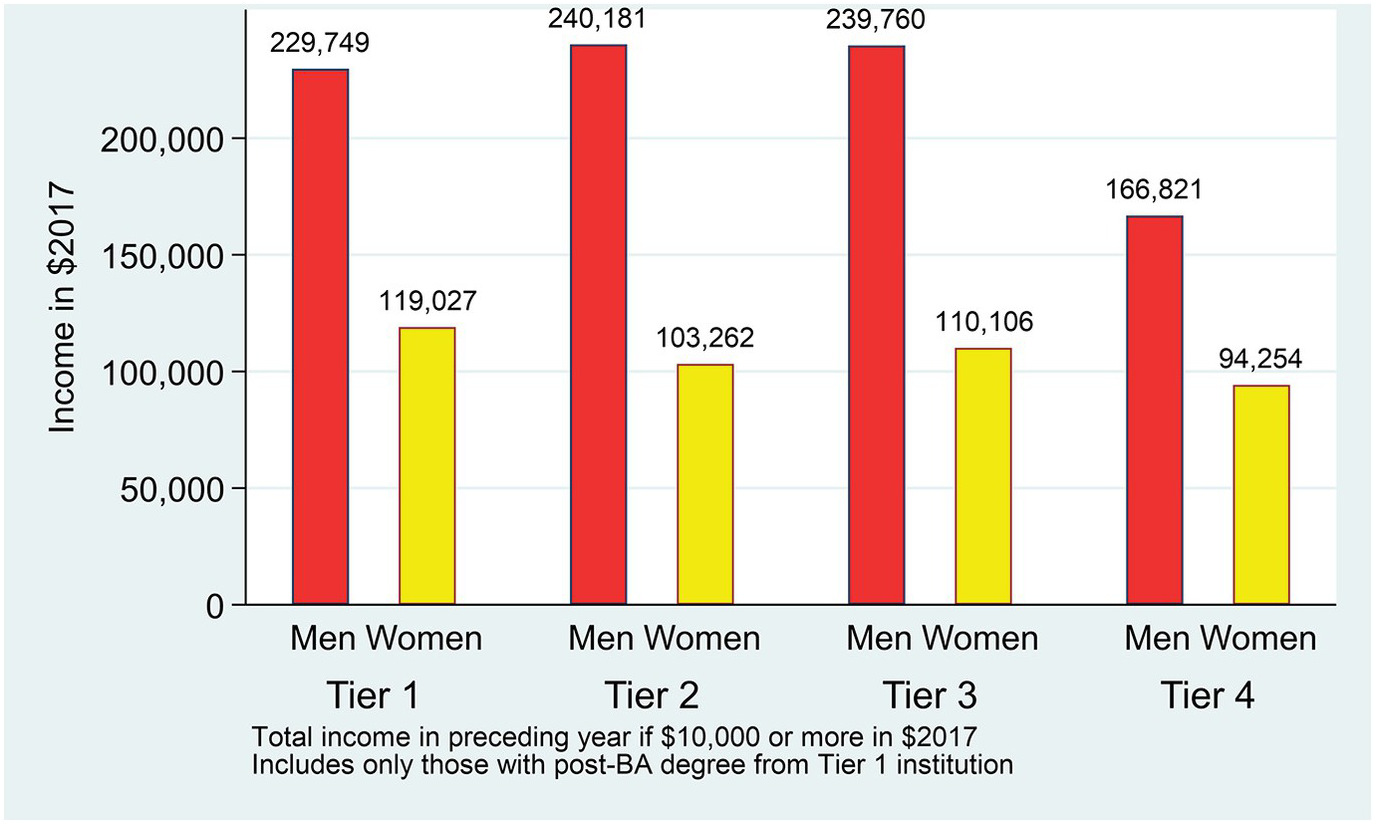
Finally, consider only those with graduate degrees from the most selective institutions that are grouped into tier 1. Figure 11 demonstrates that there is no remaining pay gap between men who have bachelor’s degrees from institutions in tiers 1–3. However, the earnings gap between men in tiers 1–3 relative to tier 4 remains substantial (as well as statistically significant), with men with bachelor’s degrees from tiers 1–3 earning on average 38–44% more than men with bachelor’s degrees from a tier 4 institution. Even among those with a post-BA degree from the most selective institutions, women with a bachelor’s degree from a tier 1 institution earn on average 26% more than women with a bachelor’s degree from a tier 4 institution.Footnote 22
Average annual income with tier 1 post-BA degree by BA tier and gender.

6 Earnings regressions: All elite post-BA degrees
The figures reporting average earnings do not take into account characteristics that influence earnings other than tier of undergraduate degree. In particular, even in Figures 10 and 11, which are restricted to those with elite graduate degrees, the averages do not take into account the far greater share of professional degrees earned by those with bachelor’s degrees from tiers 1–3 relative to those with bachelor’s degrees from tier 4 institutions. Of course, as noted earlier, because status of undergraduate institution is strongly related to type of graduate program and status of the post-BA institution, these unadjusted differences provide information of the full relation between earnings and attainment of an elite undergraduate degree.
In this section, I summarize estimates of the relation between earnings and undergraduate tier controlling for other individual and work-related characteristics. I estimate equations separately for men and women and restrict the sample to those with annual income of $10,000 or more in the preceding year, who earned a post-BA degree from an elite institution, and who are employed at the time of the survey.Footnote 23 The dependent variable in the regressions is the log of real annual income in the preceding year; estimates using basic annual salary on the current job as the dependent variable yield similar results.
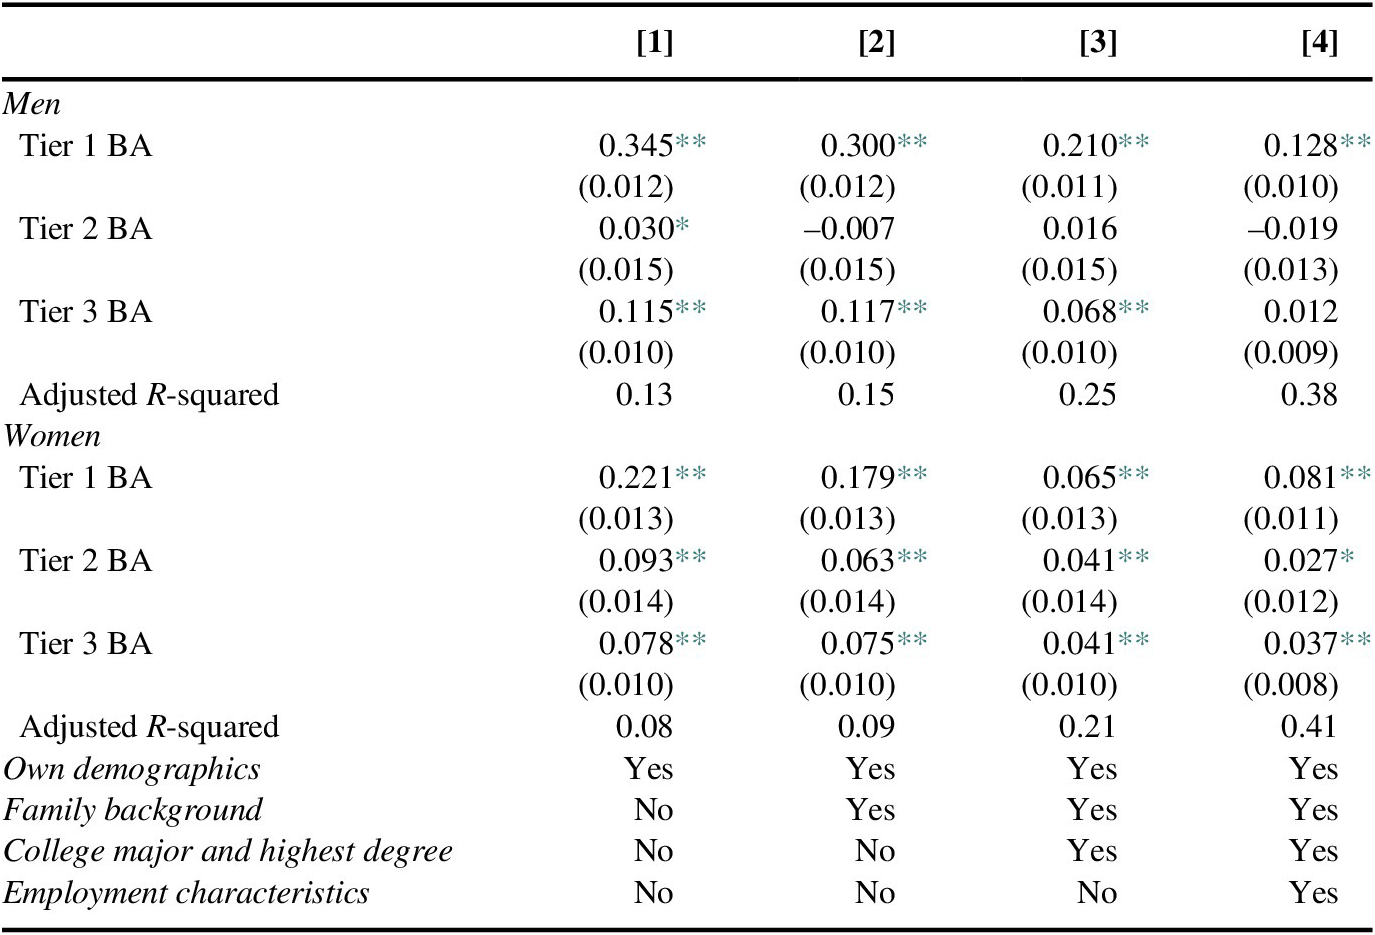
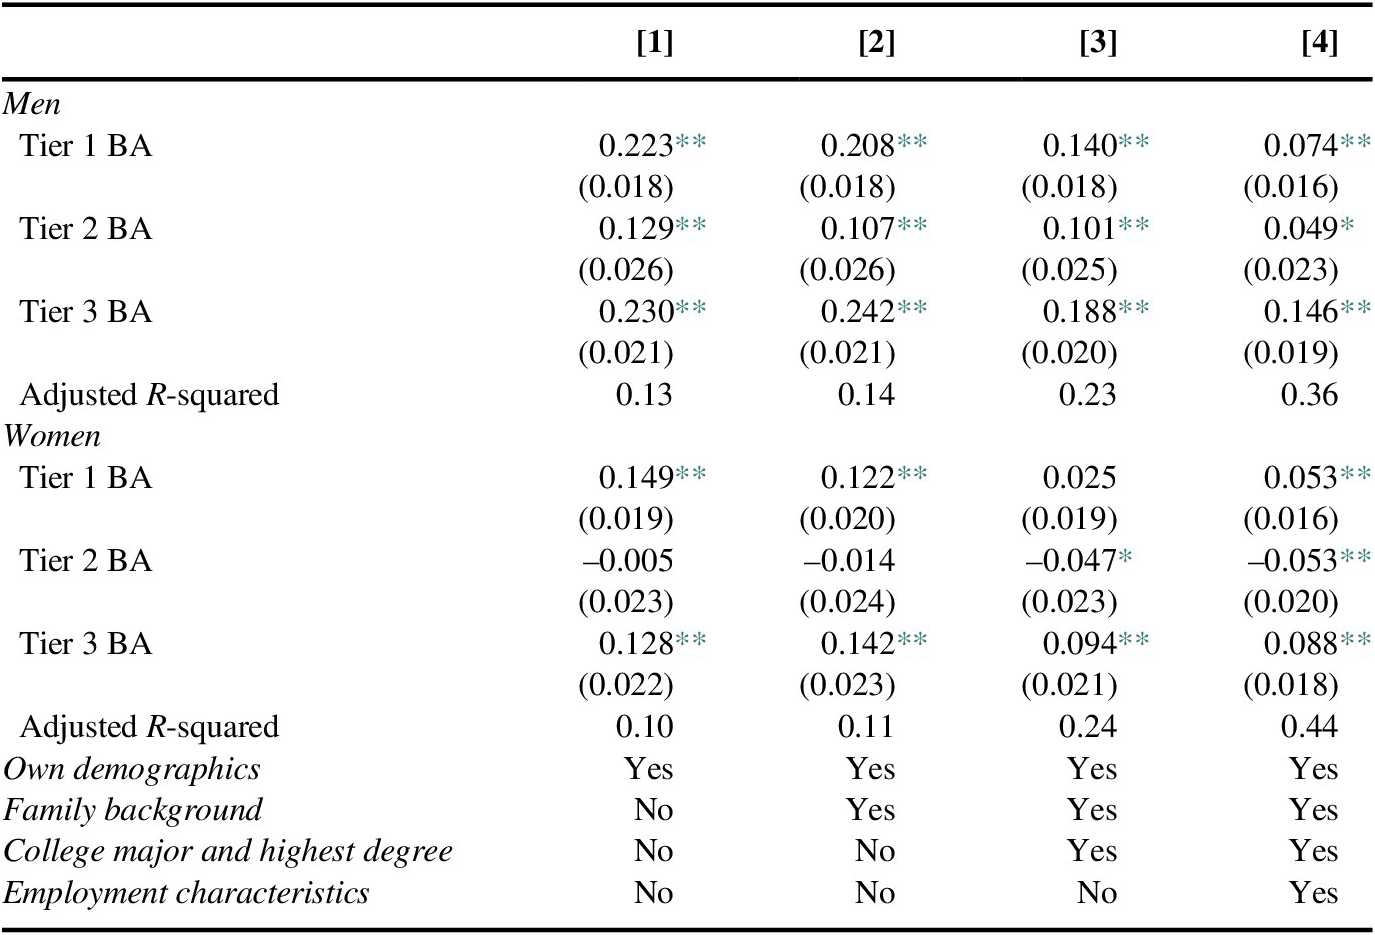
Table 1 summarizes results for those with post-BA degrees from an institution in tiers 1–3, and Table 2 summarizes corresponding results from those with post-BA degrees from tier 1 institutions in order to examine the smaller set of graduates from the most selective private institutions.Footnote 24 Column 1 of Tables 1 and 2 report estimates that correspond to Equation (1) and take into account only tier of undergraduate institution and demographic characteristics (Hispanic/Latino, race, native-born U.S. citizen, age and its square, location in South, and survey year). Because family background has consistently been shown to be strongly associated with whether a student attends an elite undergraduate institution, column 2 of Tables 1 and 2 add indicator variables for each parent’s highest education and for location of high school to the regressions summarized in column 1. The importance of unobserved characteristics associated with family background is indicated by a comparison of the coefficients on undergraduate tier reported in column 1 relative to column 2.
All tier 1–3 post-BA degrees. Dependent variable: log(real total income).

Note: Standard errors in parentheses. Sample includes those with a postbaccalaureate degree from an institution in tier 1, tier 2, or tier 3, with total income in preceding year of $10,000 or more in $2017 and employed when surveyed. Number of observations: men, 42,954; women, 30,784. All values are calculated using the National Survey of College Graduates sample weights. See text or Tables A6 and A7 for additional variables included in equations.
* Significant at 5%.
** Significant at 1%.
All tier 1 post-BA degrees. Dependent variable: log(real total income).

Note: Standard errors in parentheses. Sample includes those with a postbaccalaureate degree from an institution in tier 1 with total income in preceding year of $10,000 or more in $2017 and employed when surveyed. Number of observations: men, 15,379; women, 10,847. All values are calculated using the National Survey of College Graduates sample weights. See text or Tables A6 and A7 for additional variables included in equations.
* Significant at 5%.
** Significant at 1%.
Column 3 of Tables 1 and 2 add to the specification reported in column 2 indicator variables for college major and for highest degree. Institutions differ in types of undergraduate degrees offered, and graduates of elite undergraduate institutions are more likely than tier 4 BA degree holders to earn professional degrees that are typically high paying. The importance of college major and highest degree in explaining the premium to elite undergraduate education is demonstrated by a comparison of the coefficients on undergraduate tier in columns 1 and 2 relative to column 3.
Lastly, in order to gain some information on the mechanism by which elite undergraduate education relates to earnings among graduates of elite graduate programs, such as by improving access to private sector jobs in large firms, column 4 of Tables 1 and 2 provides estimates of Equation (2) by adding controls for job characteristics, specifically tenure and its square and potential experience and its square, and indicators for full-time employment, class of worker, occupation, and firm size.
Starting with the estimates summarized in Table 1, which are based on the sample with post-BA degrees from institutions in tiers 1–3, column 1 that controls only for demographic characteristics and tier shows a substantial earnings premium to a bachelor’s degree from a tier 1–3 institution relative to those with a bachelor’s degree from a tier 4 institution. For example, among those with graduate degrees from an institution in tiers 1–3, relative to those with tier 4 undergraduate degrees, earnings are 35 log points (41%) higher for men and 22 log points (25%) higher for women who have a bachelor’s degree from a tier 1 institution. Those with bachelor’s degrees from tier 2 or tier 3 institutions also have higher earnings relative to tier 4 graduates, but the coefficients are considerably smaller.
Inclusion of information on parents’ education and high school location, summarized in column 2, reduces the coefficients on undergraduate tier for women and for men, but with the exception of those men with their BA from a tier 2 college, all coefficients remain statistically significant. Thus, the comparison of estimates in columns 1 and 2 suggest that to the extent that unobserved characteristics are the source of the premium to elite undergraduate education, these unobserved characteristics would also need to have a low correlation with family background. Because ability and personality traits are linked to family status, these results suggest that undergraduate institutional status has a relation with earnings that is not explained solely by observed or unobserved characteristics.
The estimates summarized in column 3 add indicators for college major and type of graduate degree and, with the exception of men who are tier 2 graduates, continues to show a substantial and statistically significant premium to elite undergraduate education. For example, relative to those with a tier 4 undergraduate degree, earnings are 21 log points higher for men and 7 log points higher for women who have a bachelor’s degree from a tier 1 institution. Thus, even taking into account the larger share with professional degrees among those with elite undergraduate degrees, the premium to elite undergraduate education generally remains substantial. Once again, because unobserved characteristics are likely correlated with type of highest degree, these findings suggest that undergraduate educational status itself has a relation with earnings.
Lastly, column 4 of Table 1 adds employment characteristics. Even with extensive controls for characteristics that may be correlated with status of undergraduate institution, such as occupation and firm size, the results show a strong premium for both men and women to earning a BA from a tier 1 institution, and a smaller premium for women from a tier 2 or 3 institution, relative to graduation from a tier 4 institution. For example, relative to those with tier 4 undergraduate degrees, earnings are 13 log points higher for men and 8 log points higher for women with a bachelor’s degree from a tier 1 institution. The smaller coefficients on undergraduate tier in the comparison between columns 3 and 4 indicate that part of the premium to elite undergraduate education arises from favorable employment characteristics.
Table 2 reports estimates that correspond to the estimates in Table 1 but with the samples restricted to those who earned their post-BA degree from a selective private research university in tier 1. For both men and women, the estimates in columns 1 and 2 show that the premium to a bachelor’s degree from a tier 1 institution relative to a bachelor’s degree from a tier 4 institution is about half the size as shown in Table 1, although the magnitudes of the premium continue to be large at 22 log points for men and 15 log points for women (column 1) and 21 log points for men and 12 log points for women (column 2). Columns 1 and 2 also show that relative to those with bachelor’s degrees from tier 4 institutions, those with bachelor’s degrees from tier 3 institutions show a larger premium than reported in Table 1, with the premium comparable to those with bachelor’s degrees from a tier 1 institution. Thus, earning a post-BA degree from a tier 1 institution reduces but does not come close to eliminating the gap between tier 1 and tier 4 undergraduate degree holders, and largely equalizes the earnings premium of tier 1 and tier 3 graduates relative to tier 4 graduates.
As reported in column 3 of Table 2, inclusion of college major and type of degree further reduces the coefficient on undergraduate tier, although the premium remains statistically significant and substantial for all men and for women who are BA graduates of tier 3 institutions, ranging from 10 log points to 19 log points. Lastly, the estimates in column 4 which add employment characteristics shows a continued substantial premium to elite undergraduate tier, indicating that only some of the advantage to elite undergraduate degrees is associated with favorable employment characteristics.Footnote 25
7 Specific professional and graduate degrees: MBA, JD, MD, and PhD
Some graduate degrees may be more – or less – valuable in raising income beyond tier of undergraduate degree. For instance, law school is a prime example of a professional degree program in which first year grades have an important impact on career trajectory, influencing whether students are selected for the staff of the school’s flagship law review (selected after year 1), which in turn influences the likelihood of a prestigious clerkship, and distinctions such as Order of the Coif (top 10% ranking on the basis of grades). Graduates of more selective institutions likely arrive better prepared even relative to those with similar LSAT scores and undergraduate grades, and it would not be surprising to find that those with bachelor’s degrees from tier 4 institutions are unable to catch up with their peers in selective law schools. In contrast, PhD programs are of longer duration and there is less reliance on grades as a means of distinguishing top students, which may work to the advantage of high ability tier 4 students who have a longer period to catch up.
The regression estimates summarized in Tables 3 and 4 examine those who earn MBA, JD, MD, or PhD degrees from an elite institution. As noted earlier, although about one-third of the selective private liberal arts colleges classified into tier 2 offer some graduate degrees, none offer MD degrees, and the JD and MBA degrees, if offered, are generally not ranked highly. For these results by separate degrees, I include only those with their post-BA degree from a tier 1 or tier 3 institution. Most of the highly ranked MBA, JD, and PhD programs are associated with major research universities. Also, as discussed earlier, MD programs are offered in specialized programs such as by hospitals as well as by major research universities, with some specialized MD programs highly ranked and others unranked. The results for MDs compare, on the basis of undergraduate tier, those who earn their MD from an institution that is associated with a major research university.
Tier 1 or tier 3 MBA, JD, MD, and PhD degrees. Dependent variable: log(real total income).

Note: Standard errors in parentheses. Sample includes those with total income in preceding year of $10,000 or more in $2017 and employed when surveyed. Additional variables in each equation are own demographics, family background, and college major, and correspond to the variables listed in column 3 of Tables A7 and A8 (excluding indicators for highest degree type). All values are calculated using the National Survey of College Graduates sample weights.
+ Significant at 10%.
* Significant at 5%.
** Significant at 1%.
Tier 1 MBA, JD, MD, and PhD degrees. Dependent variable: log(real total income).

Note: Standard errors in parentheses. Sample includes those with total income in preceding year of $10,000 or more in $2017 and employed when surveyed. Additional variables in each equation are own demographics, family background, and college major, and correspond to the variables listed in column 3 of Tables A7 and A8 (excluding indicators for highest degree type). All values are calculated using the National Survey of College Graduates sample weights.
+ Significant at 10%.
* Significant at 5%.
** Significant at 1 %.
It is important to keep in mind that very few bachelor’s degree graduates of tier 4 institutions are graduates of elite professional or PhD programs. Despite the resulting reduction in statistical power from having few undergraduate tier 4 graduates within the estimating sample, most of the regression results continue to show statistically significant premiums to an elite undergraduate institution.
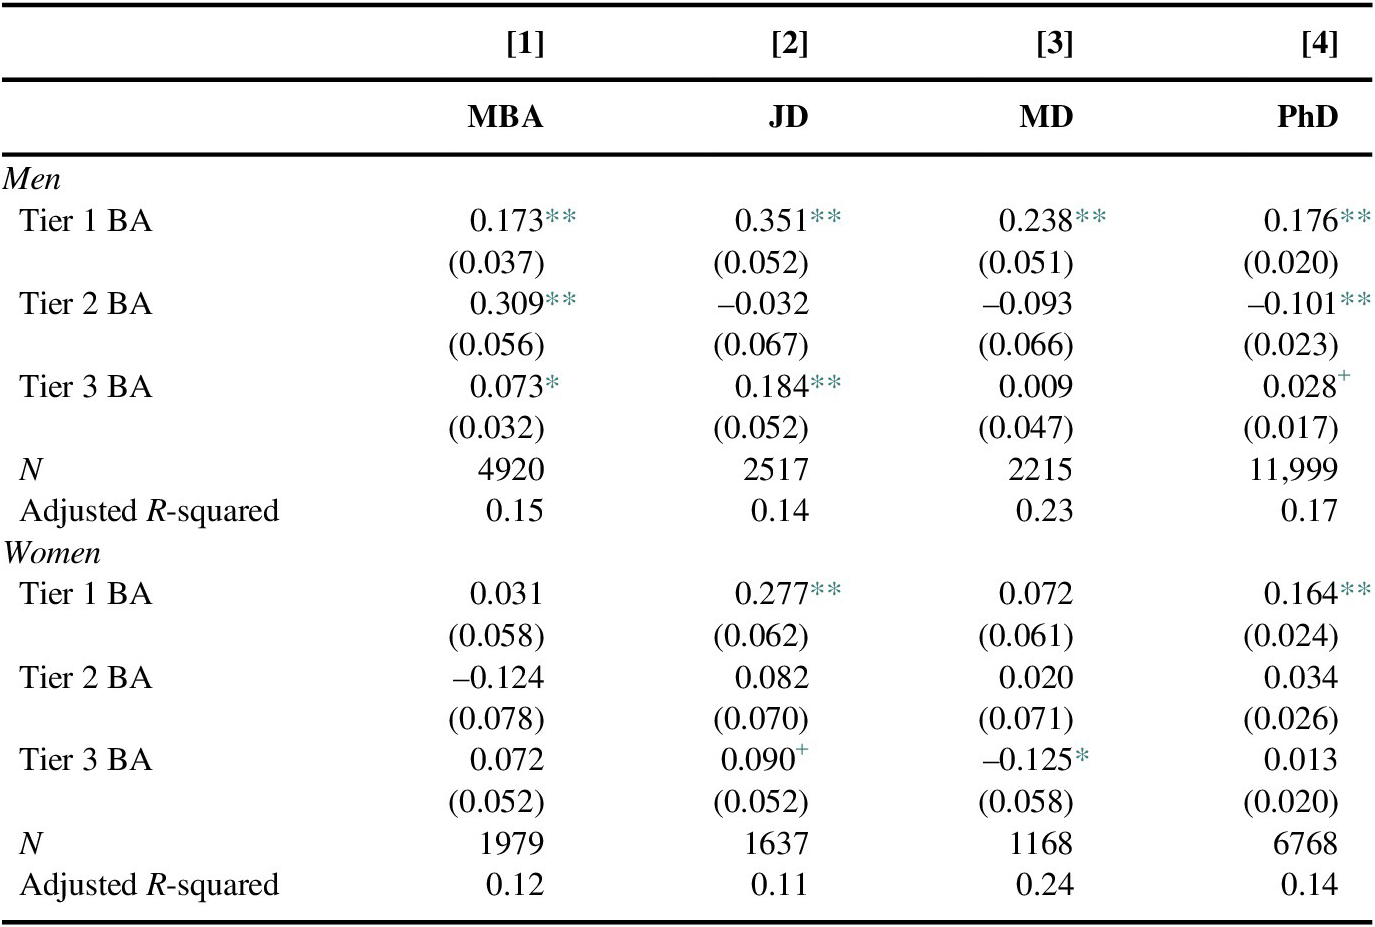
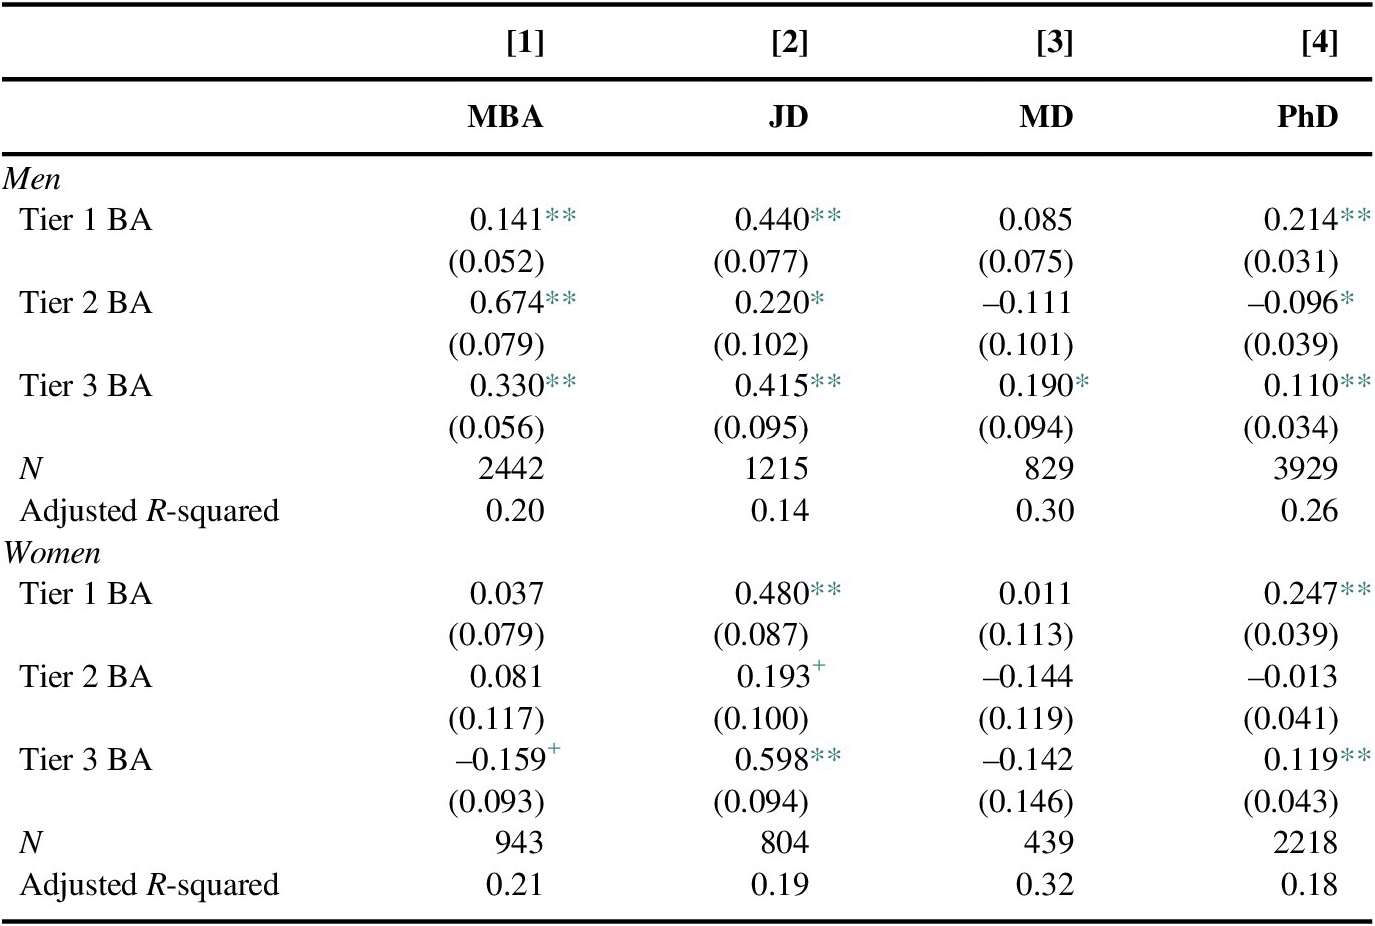
Table 3 reports the coefficients on undergraduate tier for those with post-BA degrees from tier 1 or tier 3; Table 4 reports the corresponding coefficients for those with post-BA degrees from a tier 1 institution. The regressions include information on individual demographics, family background, and college major (corresponding to the estimates in column 3 of Tables 1 and 2). In general, the pattern for specific post-BA degrees earned from an elite institution follows the pattern shown in Tables 1 and 2, which combine all observations with a post-BA degree from an elite institution.
Turning first to the estimates reported in Table 3, for all of the specific degrees, men with an undergraduate degree from a tier 1 institution who earn a post-BA degree from a tier 1 or a tier 3 university have a large and statistically significant premium relative to men with an undergraduate degree from a tier 4 institution. The premiums for these men relative to those with undergraduate degrees from a tier 4 institution is quite large, at about 17 log points for those with an MBA or PhD, 24 log points for those with MD degrees, and 35 log points for those with JD degrees. There are also substantial premiums for men with an undergraduate degree from tier 2 or tier 3 institutions that vary by type of degree. Among men with MBA degrees, those with undergraduate degrees from tier 2 institutions have the largest premium relative to men with an undergraduate degree from a tier 4 institution, at 31 log points. Many liberal arts colleges encourage development of strong interpersonal and social skills and also have strong alumni networks which would seem to provide advantages, at least for MBAs. The lower pay among PhDs of men with an undergraduate degree from a tier 2 institution may reflect the tendency of graduates of liberal arts colleges who earn a PhD to become employed at similar colleges that are generally lower paying.
Women with tier 1 undergraduate degrees who have either a JD or PhD degree have a large earnings premium relative to tier 4 graduates, of 28 log points for JDs and 16 log points for PhDs. But there is limited evidence that undergraduate tier is related to earnings among women with MBAs or MDs from a tier 1 or tier 3 institution; in fact, tier 3 graduates who earn MD degrees actually have lower earnings than tier 4 graduates.
Consider now those who earn post-BA degrees from tier 1 universities reported in Table 4. For most of the degrees, the gap between those with tiers 1–3 undergraduate degrees relative to those with tier 4 undergraduate degrees is not diminished and in many cases is larger. For example, among men with MBA degrees, those with undergraduate degrees from tier 2 institutions have the largest premium relative to men with an undergraduate degree from a tier 4 institution, at 67 log points. Among those with JDs, the premium to tier 1 or tier 3 undergraduate education for those with their JD from tier 1 universities relative to a tier 4 BA graduate remains large, at 42–44 log points.
The premium to tier 3 undergraduate education for men with MDs who earn their degree from a tier 1 medical institution relative to tier 4 graduates is also large at 19 log points. But, earning a top medical degree appears to eliminate the advantage of a tier 1 undergraduate education. And, among those with PhDs from a tier 1 institution, those with undergraduate degrees from tier 1 institutions have a large premium relative to those with undergraduate degrees from a tier 4 institution. However, for both men and women, the premium is about half the size of that for JDs, which is consistent with the possibility that the longer duration of PhD programs relative to JD programs may work to the advantage of those with undergraduate degrees from tier 4 institutions.
8 Benefit–cost comparisons
It is well-established that graduation from a more selective college pays off monetarily compared to the cost of the investment (Hoxby, Reference Hoxby, Devlin and Meyerson2001). Our interest here is whether the monetary calculation still holds among those earning an elite graduate degree. Although there is a clear continued premium to earning an elite undergraduate degree even among those with an elite graduate degree, it may still be a wise financial decision if the marginal costs of attending the more selective institution are sufficiently large. In this section, I report the present value of the marginal earnings advantage to an elite undergraduate degree among those with elite graduate degrees to provide some reference points to compare to the marginal costs. These comparisons include only the private benefits and costs to individuals. I do not provide calculations of the social rate of return to these educational investments, which, as identified in Blomquist et al. (Reference Blomquist, Coomes, Christopher, Koford and Troske2014), may be substantially higher than the private rate of return.
In the following comparisons, a key assumption is that students who successfully earn a graduate degree from an elite institution were, or could have been, admitted to colleges across a range of selectivity for their undergraduate degree. Furthermore, because the interest is in whether the motivating maxim – that an elite graduate degree can “scrub” a less prestigious undergraduate degree – the comparison is conditional on the assumption that the students expect to earn a postbaccalaureate degree and in particular, an elite graduate degree.
Many factors influence the college match process, the choice of major conditional on the institution they attend, and the career trajectory following graduation. From the standpoint of a high school senior, I assume that the benefit–cost comparison is based on average earnings of those with elite graduate degrees observed within the sample, without controlling for uncertain and possibly endogenously determined characteristics such as undergraduate major, graduate or professional degree type, or employment characteristics. That is, the present value calculations simply address the expected average difference in lifetime earnings from attending more or less selective undergraduate institutions among those with graduate degrees from elite institutions. I base the calculations on average earnings per year from ages 25 to 70, to allow time for many – but not all – to have earned their postbaccalaureate degree. The average earnings per year are based on the same sample as in the regression analyses; that is, annual earnings of at least $10,000 or more in $2017 and employed when surveyed, and all earnings values are weighted by the sample weights. I stratify by gender to account for gender differences in labor force participation. Because all of the salary comparisons are made based on current $2017, not adjusted for inflation over time, I assume a real discount rate of 3% to reflect the current interest rate on federal student loans of 5% with the assumption of a 2% rate of inflation over time.
To provide a baseline cost comparison, average total tuition, fees, room, and board for full-time students in 4-year degree granting institutions was $26,120 for private institutions and $19,189 for public institutions for 2015–2016 (U.S. Department of Education & National Center for Education Statistics, 2018b). Different institutions charge different amounts and provide different discounts to students, with many paying less than the listed price, but these values provide a ballpark showing that the cost difference between different tiers of institutions is likely to be small for most students.
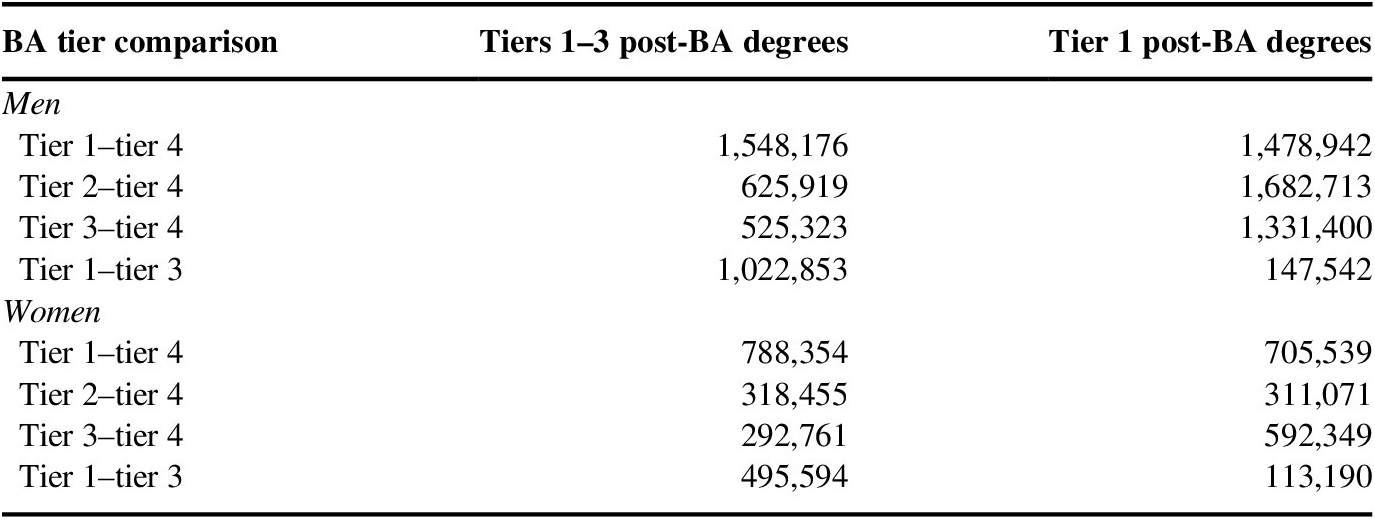
Table 5 summarizes these present value calculations and shows substantial greater lifetime earnings associated with a more selective undergraduate institution. For example, for men who earn a graduate degree from a tier 1, 2, or 3 institution, having an undergraduate degree from a tier 1 institution instead of a tier 4 institution is associated with lifetime earnings that is more than $1.5 million greater – a premium that dominates any plausible differences in the cost of attending the more selective institution. The corresponding premium for women is about half the size but also dominates any plausible differences in costs.
Present value of earnings differences between undergraduate tiers (in $2017).

Note: The table reports the present value in $2017 of the difference in lifetime earnings between those with undergraduate degrees in the indicated tiers. The present value is calculated assuming a 3% discount rate and a work life from ages 25 to 70. Sample includes those with elite graduate degrees and annual earnings of at least $10,000 or more in $2017 and employed when surveyed. All values are calculated using the National Survey of College Graduates sample weights.
A typical decision that students may face is between tier 3 and tier 4 institutions. Tier 3 institutions are large public research institutions and include most of a state’s flagship universities. Tier 4 includes a number of public universities as well as a number of private institutions. The tier 3 to tier 4 differences in the present value of earnings are around $525,000 for men and $293,000 for women. For students who are choosing between public institutions within a state, even substantial differences in the value of scholarships will be swamped by the earnings premium from attending the more selective institution.
9 Conclusion
The objective of this article is to identify whether the less prestigious undergraduate credential can be “scrubbed” by earning an elite graduate degree. If so, then talented graduate-school-bound students could choose their undergraduate institution based solely on cost or for any other reason. This article shows the perils of this strategy. The benefit–cost analysis shows that the substantial premium to elite undergraduate education is not overcome for those with a non-elite undergraduate degree even by earning a postgraduate degree from an elite institution. Few graduates of non-selective institutions continue on to graduate or professional schools, and among those who do, very few move to higher-ranked post-BA programs. And even when they do, their earnings do not catch up to their counterparts with elite undergraduate degrees, even taking into account type of degree and work characteristics that are themselves related to status of undergraduate degree. Furthermore, any costs savings from attending a lower cost institution for the undergraduate degree is generally quickly swamped by the persistent marginal earnings benefit to an elite undergraduate degree.
The relation between family background in influencing undergraduate institution status, and undergraduate institutional status in influencing postbaccalaureate outcomes, implies that “undermatching” may have permanent consequences if students who do not attend elite institutions for their bachelor’s degree are unable to overcome their initial placement by moving up to an elite graduate or professional school for a postbaccalaureate degree.
Appendix
Institutions categorized into tiers 1–3.

Note: Tier groupings are created in Hersch (Reference Hersch2013) and based on a comparison of the 1994 Carnegie Classification with Barron’s selectivity categories. See text for additional information. Institution names are listed in the indicated categories in Carnegie Foundation for the Advancement of Teaching, a Classification of Institutions of Higher Education/with a foreword by Ernest L. Boyer – 1994 ed.
Parents’ education by undergraduate tier of sample member.

Note: Author’s calculations from 2003 to 2017 National Survey of College Graduates (NSCG). The overall rates are based on all respondents in the NSCG sample. Percentages reported in columns headed tier 1–tier 4 report the education of the parents among those in the NSCG sample with a bachelor’s degree from an institution in that tier. Significant differences in percentages between tiers at the 5% level based on a Bonferroni multiple comparison test are indicated in the last column. All values are calculated using the NSCG sample weights.
Percentage with own highest degree type by undergraduate tier.

Note: Author’s calculations from 2003 to 2017 National Survey of College Graduates (NSCG). The overall rates are based on all respondents in the NSCG sample. Percentages reported in columns headed tier 1–tier 4 are based on those in the NSCG sample with a bachelor’s degree from an institution in that tier. All values are calculated using the NSCG sample weights.
Percentage with postbaccalaureate outcomes by undergraduate tier: full sample.

Note: Author’s calculations from 2003 to 2017 National Survey of College Graduates (NSCG). The overall rates are based on all respondents in the NSCG sample. Percentages reported in columns headed tier 1–tier 4 are based on those in the sample with a bachelor’s degree from an institution in that tier. All values are calculated using the NSCG sample weights.
Average annual income in $2017 by undergraduate tier and post-BA tier, by gender.

Note: Author’s calculations from 2003 to 2017 National Survey of College Graduates (NSCG). Sample includes those with total income in preceding year of $10,000 or more in $2017. The overall averages are based on all respondents in the NSCG sample with the indicated post-BA degree. Averages reported in columns headed tier 1–tier 4 are based on those in the NSCG sample with a bachelor’s degree from an institution in that tier. The rows headed “N” indicate the number of observations in that category. Significant differences in averages between tiers at the 5% level based on a Bonferroni multiple comparison test are indicated in the last column. All values are calculated using the NSCG sample weights.
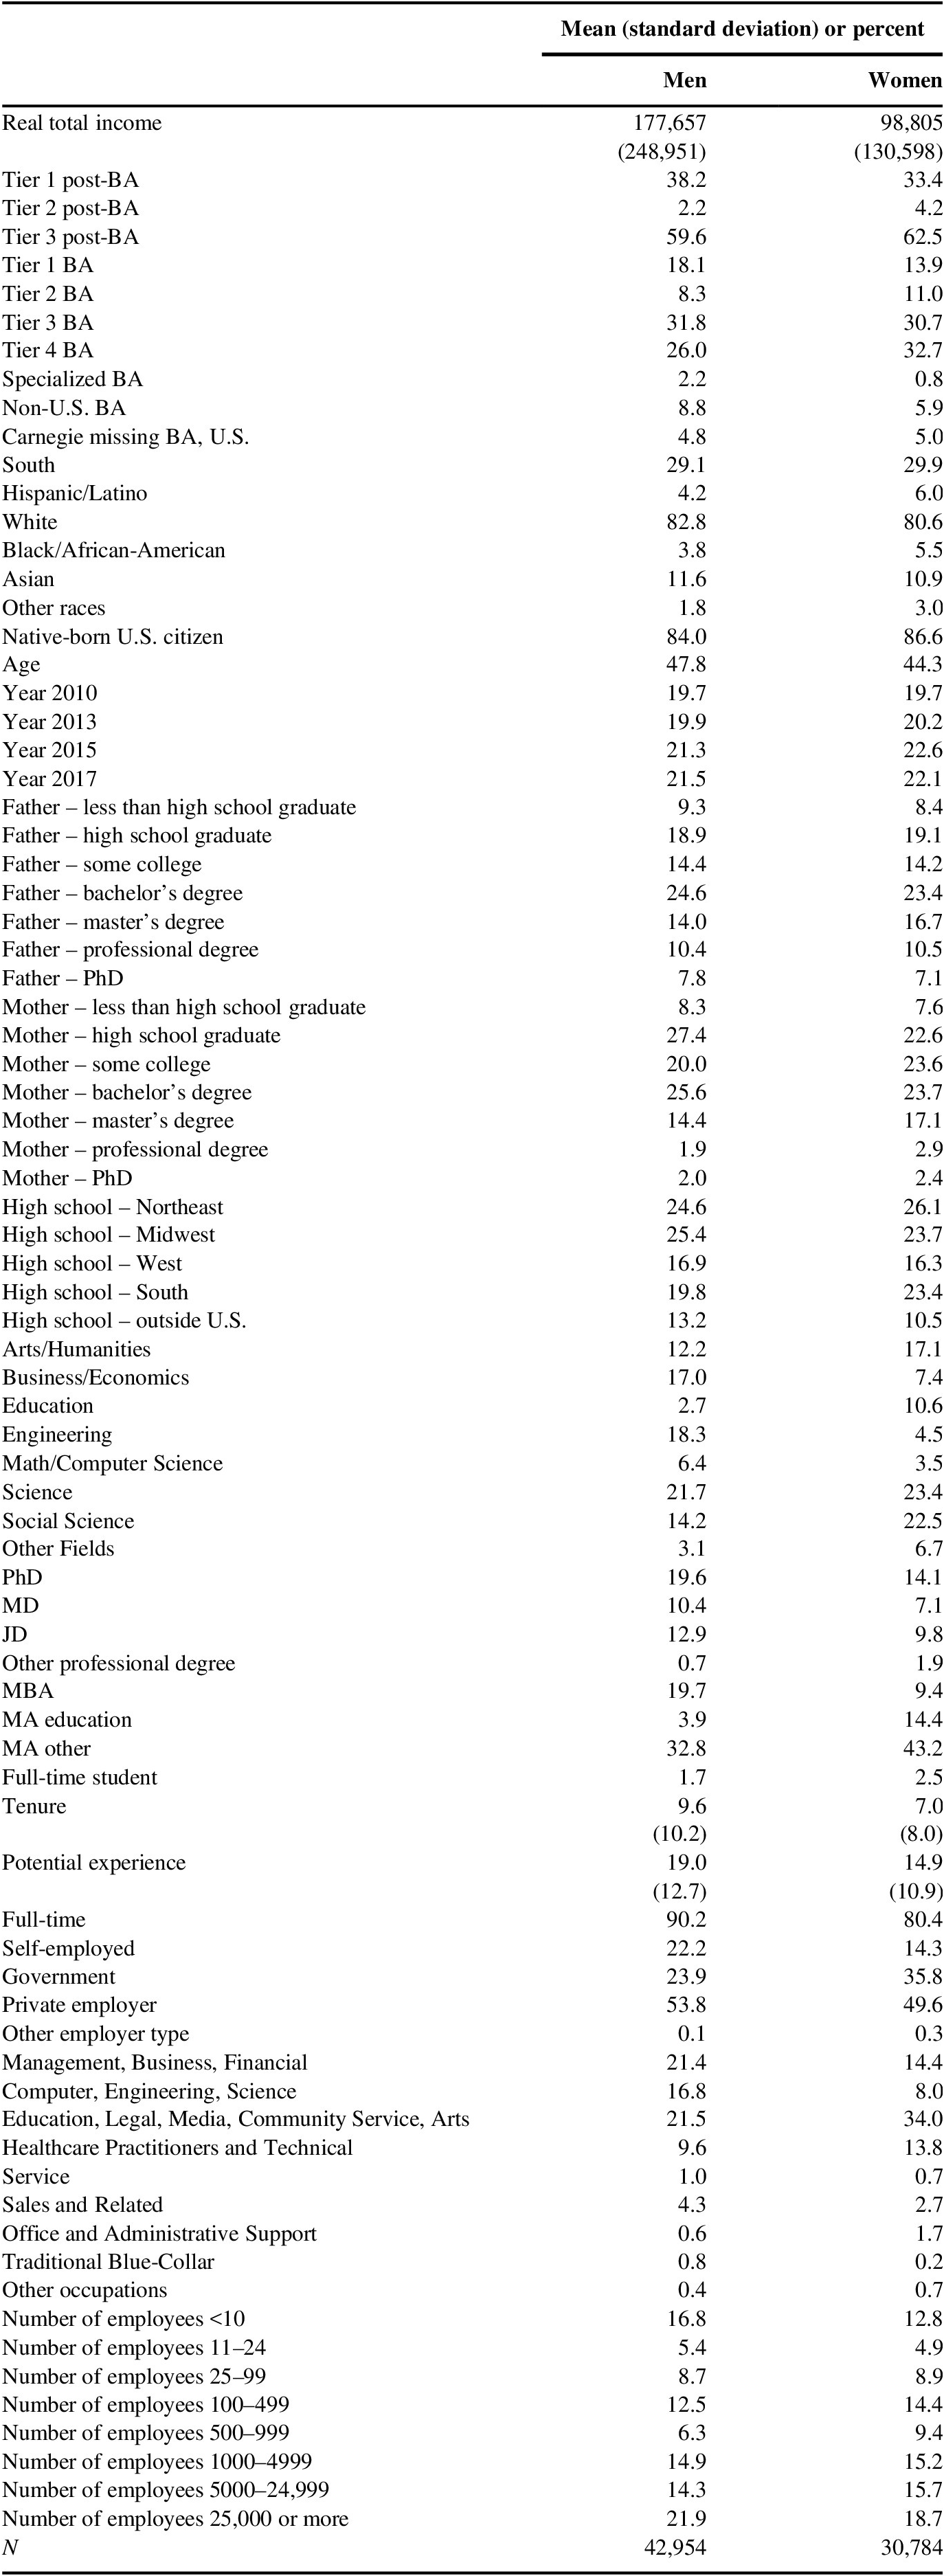
Descriptive statistics for samples used in earnings regressions.

Note: Author’s calculations from 2003 to 2017 National Survey of College Graduates (NSCG). Sample includes those with postbaccalaureate degree from an elite institution with total income in preceding year of $10,000 or more in $2017 and employed when surveyed. All values are calculated using the NSCG sample weights.
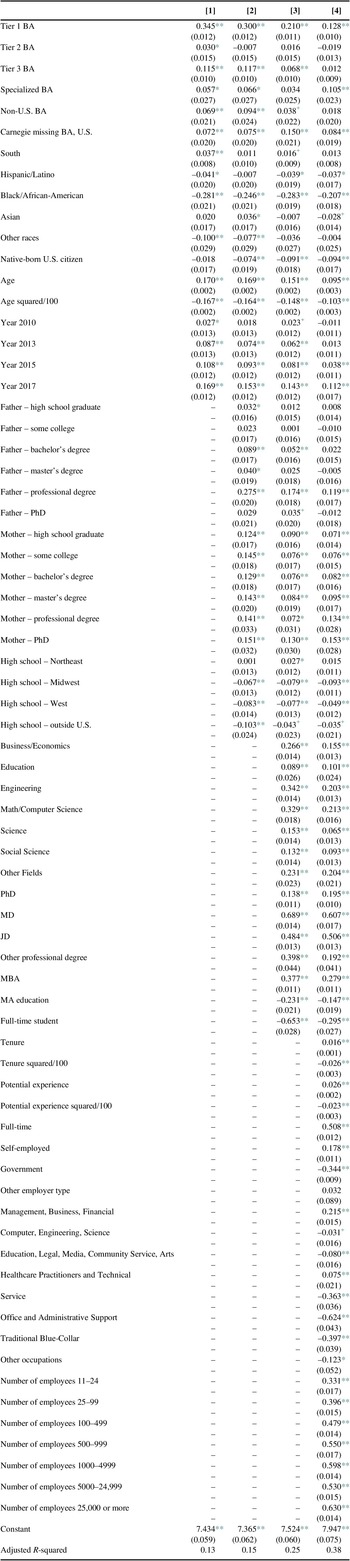
Earnings regressions for men with tier 1–3 post-BA degree. Dependent variable: log(real total income).

Note: Standard errors in parentheses. Sample includes men with postbaccalaureate degree from an elite institution with total income in preceding year of $10,000 or more in $2017 and employed when surveyed. Number of observations is 42,954. Omitted categories are as follows: for race, White; for parents’ education, less than high school; for college major, Arts/Humanities; for highest degree, MA other; for occupation, Sales and Related; for class of worker, private employer; for firm size, <10 employees. All values are calculated using the National Survey of College Graduates sample weights.
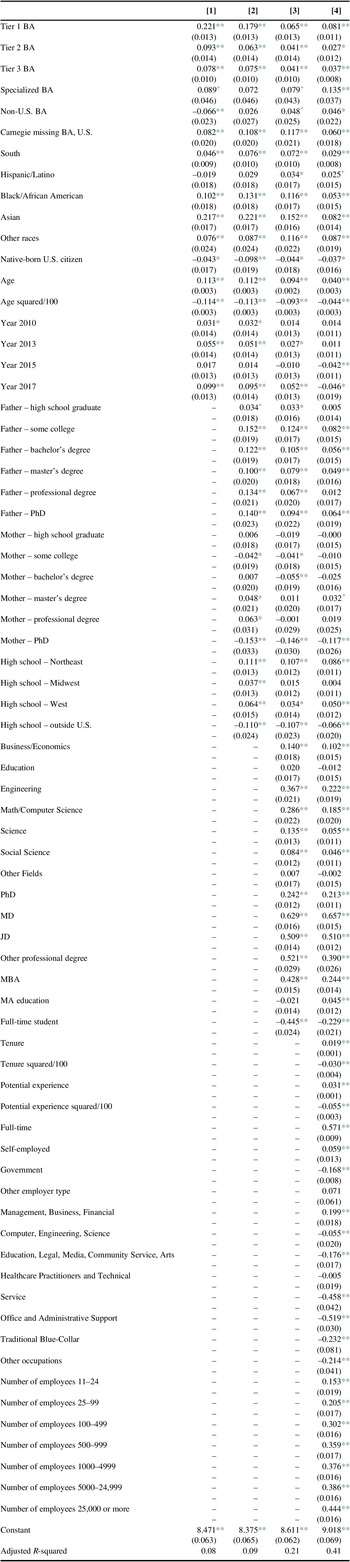
Earnings regressions for women with tier 1–3 post-BA degree. Dependent variable: log(real total income).

Note: Standard errors in parentheses. Sample includes women with postbaccalaureate degree from an elite institution with total income in preceding year of $10,000 or more in $2017 and employed when surveyed. Number of observations is 30,784. Omitted categories are as follows: for race, White; for parents’ education, less than high school; for college major, Arts/Humanities; for highest degree, MA other; for occupation, Sales and Related; for class of worker, private employer; for firm size, <10 employees. All values are calculated using the National Survey of College Graduates sample weights.