INTRODUCTION
Ever since Crofton (Reference Crofton1971) pointed it out, the aggregated distribution of parasites among individual hosts in a population has been accepted as an intrinsic ecological characteristic of metazoan parasites. Empirical evidence confirms this; whatever index is used to measure aggregation, practically all samples of hosts show a parasite distribution with more hosts harbouring few or no parasites, and also more harbouring high burdens, than expected from either a random or uniform distribution (Shaw and Dobson, Reference Shaw and Dobson1995). The variation observed in the number of parasites harboured, however, is tightly constrained by the mean number of parasites per host. For instance, Shaw and Dobson (Reference Shaw and Dobson1995) regressed log variance against log mean number of parasites per host across a large number of samples, and obtained an r 2 of 0·87, indicating that only about 13% of the observed variability in parasite aggregation levels remains to be accounted for by other factors.
The processes responsible for this ‘unexplained’ component of parasite aggregation are generally thought to involve heterogeneity in the rates at which parasites are acquired or lost from hosts (Anderson and Gordon, Reference Anderson and Gordon1982). Firstly, heterogeneity among host individuals in terms of exposure to parasites, resulting from the uneven distribution of infective stages in space and time relative to hosts, can lead to parasite aggregation (Keymer and Anderson, Reference Keymer and Anderson1979; Janovy and Kutish, Reference Janovy and Kutish1988; Leung, Reference Leung1998; Hansen et al. Reference Hansen, Jeltsch, Tackmann, Staubach and Thulke2004). Secondly, heterogeneity in numbers of parasites per host can result from either genetic or acquired variation in susceptibility to infection, arising from differences among hosts in behaviour or immune resistance (Poulin et al. Reference Poulin, Rau and Curtis1991; Lysne and Skorping, Reference Lysne and Skorping2002; Galvani, Reference Galvani2003). The very few experimental studies (e.g. Karvonen et al. Reference Karvonen, Hudson, Seppälä and Valtonen2004; Bandilla et al. Reference Bandilla, Hakalahti, Hudson and Valtonen2005) that attempted to distinguish between those two mechanisms, i.e. heterogeneity in exposure and heterogeneity in susceptibility, found that the former appears more important than the latter.
There may be a way to evaluate the general importance of heterogeneity in susceptibility using data from natural host samples. Despite efforts to minimize variability among individual hosts, there is no such thing as a homogeneous sample; at the very least, animals in a field-collected sample vary in body size, whether a little or a lot. Inter-individual variation in body size probably reflects variation in susceptibility (see below). If so, quantifying how much of the variance in parasite aggregation levels across different samples is explained by within-sample host body size variation would provide an estimate of the importance of heterogeneity in susceptibility in generating aggregated parasite distributions. Furthermore, comparisons among different types of host–parasite associations could identify those where heterogeneity in susceptibility plays a greater role in causing parasite aggregation.
There is no doubt that host body size is a reliable proxy for a range of factors closely tied with susceptibility to infection. If acquired immunity is involved, differences in age and thus past exposure to parasites between small and large hosts can be responsible for variation in susceptibility and therefore in parasite loads. In the absence of acquired immunity, all else being equal, larger individuals consume a greater quantity and in some cases also a greater diversity of food items, and thus face greater risks of infection by food-borne parasites than small ones. Larger hosts also have greater external surface areas, making them more vulnerable to ectoparasites or skin-penetrating parasites than smaller conspecifics. Finally, larger host individuals are older, and therefore have had longer to accumulate parasites than smaller ones. Not surprisingly, for all these reasons differences in host body sizes are associated with differences in infection levels. For example, within fish species, larger individuals typically harbour greater numbers of both ecto- and endoparasites than smaller conspecifics (see Grutter and Poulin, Reference Grutter and Poulin1998; Poulin, Reference Poulin2000). Therefore, even modest body size variation within an otherwise homogeneous host sample can account for some, if not most, of the observed aggregated distribution of parasites.
Properties of parasites themselves may also account for some of the variability in aggregation levels observed among samples. Recently, Lester (Reference Lester2012) has argued that aggregation levels are higher in fish parasites acquired trophically through the food chain than in those acquired otherwise. This conclusion was based on comparisons of very different parasites, i.e. copepods and monogeneans versus nematodes or cestodes, and not on similar kinds of parasites at different stages of their life cycle, such as juvenile trematodes versus adult ones. Nevertheless, characteristics of parasites are certainly a potential cause of aggregation in addition to heterogeneity in host exposure and/or susceptibility.
Here, two factors were tested that could explain the variability in parasite aggregation levels among host samples not already accounted for by variation in mean numbers of parasites per host. The contribution of (i) within-sample variation in host body size and (ii) parasite taxon and developmental stage, to the aggregated distribution of helminth parasites, was quantified using a large dataset on parasite distributions in natural samples of fish hosts. By seeking parasite groups in which variation in host body size is more tightly linked with parasite aggregation, it should be possible to identify systems, if any, where heterogeneity in host susceptibility plays a greater role.
MATERIALS AND METHODS
The dataset was compiled by checking every relevant article published in Journal of Parasitology (for the years 2000–2011), Journal of Helminthology (2000–2011), Parasitology (2000–2011), International Journal for Parasitology (2000–2011) and Comparative Parasitology (2002–2011). Although not exhaustive, this literature survey provided a vast and representative collection of published data from natural studies of helminth parasites (monogeneans, trematodes, cestodes, nematodes and acanthocephalans) in populations of fish hosts.
A host sample is defined as a number of conspecific host individuals collected in one location over a time-period too limited to allow for temporal variation in infections, and from which data on infection by a focal parasite species are recorded. Therefore, some studies included data on more than one host sample, and also some host–parasite species combinations were represented by more than one sample. Samples with fewer than 6 individual hosts infected by the focal parasite were excluded, to avoid inadequate estimation of infection parameters due to very low prevalence, while not biasing too strongly the dataset toward high-prevalence samples only. For each sample, the following information was recorded: (i) the parasite species name and the higher taxonomic group to which it belonged, i.e. trematode, cestode, monogenean, nematode or acanthocephalan; (ii) whether the parasite was at a juvenile or adult stage, in the case of helminths with complex life cycles; (iii) the host species name; (iv) the host sample size, i.e. the number of individual hosts examined; (v) the mean host body size and its standard deviation (N.B. in many cases, standard deviations were computed from the standard errors given), regardless of whether it was total or standard body length; and (vi) the mean number of parasites per host, including uninfected hosts, and its variance. Most studies did not present adequate data on host body sizes, or had separated the data into arbitrary host size classes with no natural variation, and could therefore not be included.
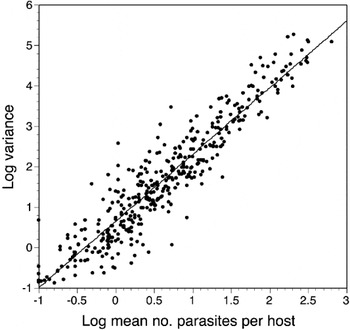
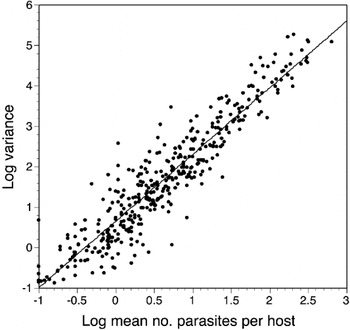
Three indices of aggregation are often used in the literature, all correlated with each other. The first is the variance-to-mean ratio, obtained by dividing the mean parasite abundance (calculated including uninfected hosts in the sample) by its variance. As the variance-to-mean ratio increases, so does aggregation. The second is the parameter k of the negative binomial distribution; smaller values of k indicate greater levels of aggregation. The third is the index of discrepancy, D, which measures the departure between the observed parasite distribution and a hypothetical one in which all hosts harbour equal numbers of parasites (Poulin, Reference Poulin1993); it ranges from zero to one, with aggregation increasing as it approaches one. The most widely available index from the studies surveyed is the variance-to-mean ratio; here, however, it is only used for descriptive purposes. The focus of this study is on the small portion of aggregation not explained by mere variation among samples in the mean number of parasites per host. Therefore, log-transformed variance was regressed against log mean number of parasites per host (Fig. 1), revealing a very strong relationship (r 2 = 0·88, P < 0·0001; very similar to the value of 0·87 found by Shaw and Dobson, Reference Shaw and Dobson1995). Residuals from this regression were used as a measure of aggregation, with positive values representing cases where aggregation is greater than expected from mean parasite load, and negative values corresponding to cases where it is lower.
Log variance as a function of log mean number of parasites per host, across 410 samples of helminth parasites of fish. The line is from a simple regression (r 2 = 0·88).
Initially, the within-sample variation in host body size was measured as the coefficient of variation in host body size, computed as the standard deviation in body sizes divided by the mean. This should represent a unit-free measure of variability, independent of mean body size and comparable across species regardless of how body size was measured. However, the coefficient of variation was correlated with the mean host size (in log-log space, r = 0·112, N = 410, P = 0·0291). Therefore, hereafter the coefficient of variation is only used as a descriptive measure. For analysis, to obtain a measure of variation truly independent of mean size, the standard deviations in body sizes were regressed against mean sizes (in log-log space, r 2 = 0·78, P < 0·0001), and the residuals were used thereafter. Positive residuals represent samples where host sizes vary more than expected from their mean value, and negative residuals correspond to samples where they vary less than expected.
Differences in aggregation levels among host samples were analysed using a mixed effect model. The response variable was aggregation levels, i.e. the residuals of log variance regressed against log mean number of parasites per host. Parasite species, host species and study of origin were included as random effects, to account for the idiosyncrasies of particular systems or researchers. The model included 3 fixed effects. First, parasites were classified into 9 groups based on their higher taxonomic affiliation and their developmental stage (i.e. monogenean, juvenile or adult trematode, juvenile or adult cestode, juvenile or adult nematode, and juvenile or adult acanthocephalan); ‘parasite group’ was treated as a categorical variable. Second, within-sample variation in host body size, taken as the residuals of log standard deviation in body size regressed against mean size, was included as a predictor. The interaction between parasite group and within-sample variation in host body size was also included in the model, in case variation in host body size influences aggregation differently in different parasite taxa. Finally, log-transformed host sample size, i.e. the number of individual hosts examined, was also included in the model as a potentially confounding variable. All analyses were implemented in JMP version 9.0.2 (SAS Institute, Inc).
RESULTS
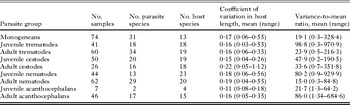
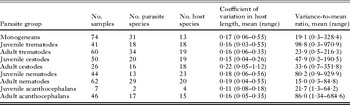
Overall, the dataset included 410 samples, comprising information on 180 parasite species and 68 host species, and compiled from 62 different studies. When split into the 9 groups based on taxonomy and developmental stage, most groups except juvenile acanthocephalans were well represented (Table 1). There were substantial differences among samples in aggregation and host size variability; variance-to-mean ratios in parasite numbers varied over 3 orders of magnitude among samples, whereas there was a 10-fold difference between the smallest coefficient of variation in host body size and the largest one (Table 1).
Summary statistics for the 410 host samples included in the dataset, split into the 9 parasite groups
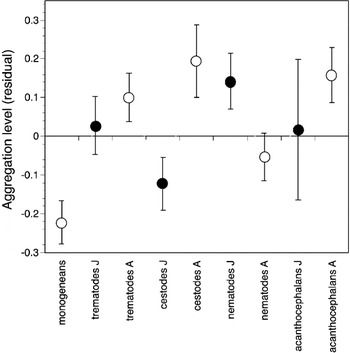
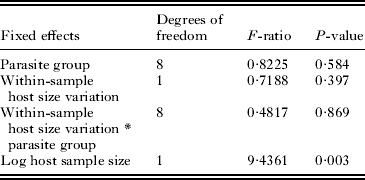
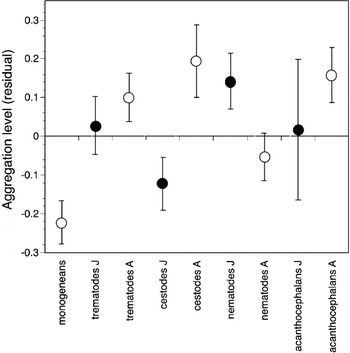
At first glance, aggregation levels appear to differ among parasite groups, but with no clear overall pattern (Fig. 2). For instance, aggregation was more pronounced among juvenile stages in nematodes, although the opposite trend was seen in the other 3 taxa with complex life cycles. However, the results of the mixed model indicate that there are no significant differences among the 9 parasite groups once other effects are taken into account (Table 2). There was also no significant effect of within-sample variation in host body size on parasite aggregation level within a sample (Table 2). In addition, there was no significant interaction between the parasite group to which a parasite belongs and within-sample variation in host body size.
Mean (±s.e.) aggregation levels in different groups of either juvenile (J, black circles) or adult (A, open circles) helminth parasites of fish. Aggregation is expressed as the residuals of log variance regressed against log mean number of parasites per host. See Table 1 for the number of samples in each group.
Summary of the mixed effect model with aggregation levels, i.e. the residuals of log variance regressed against log mean number of parasites per host, as the response variable
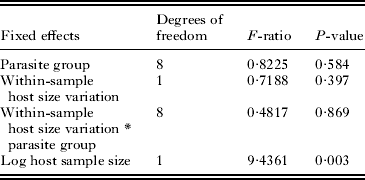
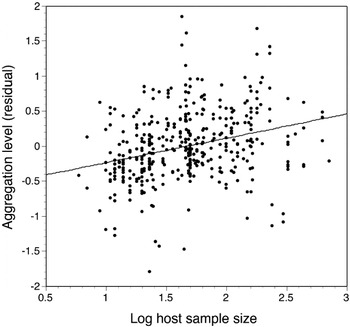
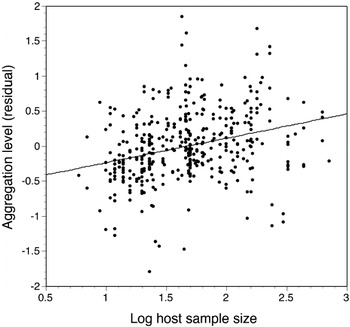
The only main effect that had a significant influence on parasite aggregation level was host sample size, which had initially been included only as a potentially confounding variable (Table 2). Generally, the more hosts were examined in a sample, the higher the observed aggregation level, although this pattern is relatively weak (Fig. 3) and accounts for only about 8% of the variability in the residuals of the log-variance vs log-mean parasite load regression.
Aggregation levels as a function of host sample size, i.e. the number of individual hosts examined for parasites, across 410 samples of helminth parasites of fish. Aggregation is expressed as the residuals of log variance regressed against log mean number of parasites per host. The line is from a simple regression (r 2 = 0·08).
However, the 3 random factors included in the mixed model, i.e. parasite species, host species and study of origin, were responsible for 12, 13 and 39%, respectively, of the unaccounted variance in aggregation levels not explained by the main effects. Therefore, almost two-thirds of the remaining variability in the residuals of the log-variance vs log-mean parasite load regression can be attributed to species-specific or study-specific effects.
DISCUSSION
The aggregated distribution of parasites among their hosts has been proposed as a general feature of metazoan parasites (Crofton, Reference Crofton1971) and as possibly the only universal law in parasite ecology (Poulin, Reference Poulin2007). However, the variance in infection levels among individual hosts in a population, which is the basis for any measurement of aggregation, is itself tightly constrained, as it covaries very strongly with mean parasite load. Indeed, based on Shaw and Dobson's (Reference Shaw and Dobson1995) results and those of the present study performed on a completely different dataset, only 12–13% of the variance in infection levels, i.e. the variance in parasite aggregation among parasite species, is left unexplained. It is this unaccounted variance that was the focus of the present study.
Two general explanatory factors were tested here. First, the results show quite clearly that within-sample variation in host body size has no effect on observed aggregation levels, either across all samples or within particular parasite groups. This is despite evidence that within samples, larger fish hosts almost invariably harbour more parasites than small ones (Grutter and Poulin, Reference Grutter and Poulin1998; Poulin, Reference Poulin2000), and despite the fact that across the samples in the dataset there was a 10-fold difference between the smallest and largest coefficients of variation in host body size. As explained earlier (see Introduction), host size should be a reliable proxy for various factors closely tied with susceptibility to infection. Perhaps, as seen in some experimental studies (e.g. Karvonen et al. Reference Karvonen, Hudson, Seppälä and Valtonen2004; Bandilla et al. Reference Bandilla, Hakalahti, Hudson and Valtonen2005), heterogeneity in host exposure to infective stages is more important than heterogeneity in host susceptibility to infection in generating aggregated parasite distributions. Alternatively, variability in susceptibility among individual hosts may be important but involves mechanisms unrelated to body size, such as slight inter-individual differences in feeding preferences or specialization (Knudsen et al. Reference Knudsen, Curtis and Kristoffersen2004) or immune condition (Morrill and Forbes, Reference Morrill and Forbes2012).
Second, the results do not support an effect of parasite taxon or developmental stage on observed aggregation levels. This finding disagrees with Lester's (Reference Lester2012) observations and conclusions. There are several reasons for the discrepancy; for instance, the present study included a larger number of samples, a larger number of species, and a more rigorous accounting for species-specific effects than that of Lester (Reference Lester2012). All that can be said is that despite some repeatable juvenile-versus-adult differences in specific taxa, there are no consistent, overall differences between the aggregation levels of different developmental stages, or between helminth parasites transmitting and accumulating through the food chain and those infecting fish via other routes. Juvenile and adult helminth stages differ in many more ways than just whether they are acquired by fish trophically or otherwise; for instance, juveniles and adults occupy different tissues or organs within the host. For this reason, generalizations detectable as clear empirical patterns are difficult to make. Therefore, the life cycle stage joins another parasite characteristic, their body size relative to host body mass, as variables explaining rather little of the interspecific variation in aggregation levels (Poulin and Morand, Reference Poulin and Morand2000).
Having said this, other parasite characteristics may nevertheless affect aggregation levels. When log-transformed variance is regressed against log mean number of parasites per host using only samples from the same parasite and host species, the slope of the regression can itself serve as an index of aggregation for that parasite species on that particular host species (Morand and Krasnov, Reference Morand and Krasnov2008). Using this approach, not only can small but consistent differences in aggregation levels be found by comparing slope values among parasite species, but they can also be related to parasite properties such as host specificity (Krasnov et al. Reference Krasnov, Stanko, Miklisova and Morand2006; Pérez-del-Olmo et al. Reference Pérez-del-Olmo, Morand, Raga and Kostadinova2011). There are thus some biological properties of parasites that create interspecific differences in aggregation levels, even if these differences are small and highly constrained.
In the present study, the only predictor included in the model that had a significant effect on aggregation levels was host sample size. This finding has a simple explanation: the more individual hosts are examined for parasites, the greater the chances of including one or a few of the rare hosts that harbour very high numbers of parasites. The influence of sampling effort on the measurement of aggregation has been discussed before (Gregory and Woolhouse, Reference Gregory and Woolhouse1993; Poulin, Reference Poulin1996), and was expected in the present analysis. Other indices of aggregation, such as the index of discrepancy, D, or the parameter k of the negative binomial distribution, are similarly sensitive to host sample size (Gregory and Woolhouse, Reference Gregory and Woolhouse1993; Poulin, Reference Poulin1996). They could not be used in this study because they are not as widely reported and cannot be computed from the data given in original sources. However, there is little reason to believe that using these alternative indices would have altered the present findings.
As demonstrated earlier for specific host–parasite systems (e.g. Elston et al. Reference Elston, Moss, Boulinier, Arrowsmith and Lambin2001), the inclusion of random effects can account for much of the apparent variability in aggregation levels. Here, the combination of parasite species, host species and study of origin explained almost two-thirds of unaccounted variability in aggregation levels not explained by the main effects. A closer examination of the variability is informative. Beginning with the regression of log-transformed variance against log mean number of parasites per host, we find that 87–88% (Shaw and Dobson, Reference Shaw and Dobson1995; this study) of the variability in the within-sample variance-in-infection-level is explained by the mean infection level (note the usage of ‘variability’ here to avoid confusion with ‘variance in infection level’). This leaves only 12–13% of the variability unexplained. Taking the residuals of this regression as measures of both this remaining variability and of aggregation, we find that 8% of it is accounted for by variation in host sampling effort and about 65% by random effects from species-specific or study-specific idiosyncrasies. This leaves only about 3% (i.e. a quarter of the above 12–13%) of the variability unexplained. It may be that the search for universal ecological causes of parasite aggregation, and for why it varies among parasite species, will prove futile as there is so little left to explain.
ACKNOWLEDGEMENTS
I thank Clément Lagrue and Haseeb Randhawa for constructive comments on an earlier version.