I. INTRODUCTION
Titanium (Ti) and its alloys are increasingly being used in aerospace and biomedical engineering applications.Reference Contieri, Zanotello and Caram1–Reference Lutjering and Williams3 Ti alloys are divided into three types based on the phases present in the microstructure—α, β, and α + β Ti alloys. α-Ti alloys are known for their high strength but have very low ductility and anisotropic properties due to the single phase HCP structure.Reference Weiss and Semiatin4 β-Ti alloys have a BCC structure and have a good combination of high strength and ductility.Reference Lutjering and Williams3,Reference Ghaderi, Hodgson and Barnett5 α + β Ti alloys have combined properties of high strength, suitable ductility, and excellent corrosion resistance.Reference Lutjering and Williams3,Reference Williams, Brunette, Tengvall, Textor and Thomsen6 Most of the Ti alloys are highly alloyed to stabilize the required phase (α, β, or α + β) and hence a wide range of compositions of Ti alloy exists. Although, many combinations of α + β Ti alloy exists, Ti–6Al–4V alloy is the one which is most widely used and is also known as the work horse of Ti-using industries.Reference Layens and Peters7–Reference Weigand9 The size, shape, type, and distribution of various phases in the microstructures of Ti alloys are usually decided by the thermomechanical processing history and have a direct influence on their mechanical behavior/properties.Reference Weiss, Froes, Eylon and Welsch10–Reference Peters and Lütjering13 In α + β Ti alloys, this is achieved by heating the alloy above (β phase field) or below the β transus (α + β phase field) and then cooling it at a desired rate.Reference Weiss and Semiatin4,Reference Weiss, Froes, Eylon and Welsch10,Reference Dabrowski14 The α phase, which precipitates during heating or cooling (diffusionless transformation) of the samples, can be classified as primary α (αp), Widmanstatten α (αw), globular α (αg), lamellar α (αl), and secondary α (αs) depending on shape and size.Reference Semiatin, Seetharaman and Weiss15 Faster cooling rate (water/oil quenching) promotes the diffusionless transformation of β → α′ or α″ (martensite) which is harder than α and increases the hardness and brittleness of the overall structure.Reference Pinke, Aplovi and Kovacs16,Reference Xu, Zeng, Zhao, Sun and Du17 α′ has a HCP structure and similar lattice parameters as that of the α phase, α″, on the other hand, is orthorhombic in nature.Reference Lutjering and Williams3,Reference Zhang, Tasan, Lai, Dippel and Raabe18 It has been reportedReference Pinke, Aplovi and Kovacs16 that α′ can be decomposed (reversion reaction) into α and β by suitable thermomechanical treatment and hence can be used to tailor the mechanical properties.Reference Duerig, Terlinde and Williams19–Reference Nwobu, Flower, West, Froes and Caplan25 The evolution of β phase primarily depends on the alloying elements and the processing temperature. If strong β stabilizing elements are added and the alloy is heated above the β transus followed by quenching, the β phase can be retained completely (this forms the basis of development of β-Ti alloys).Reference Weiss and Semiatin2,Reference Lutjering and Williams3,Reference Ivasishin, Markovsky, Matviychuk and Semiatin26 Shao et al.Reference Shao, Zhao, Ge and Zeng27 studied the relationship between cooling rate and microstructure in the TC21 titanium alloy and found that diffusionless transformation β → α′ takes place after water quenching and β → β + α phase on air cooling (AC) and furnace cooling (FC). The cooling rate is also important in deciding the shape and size of the α phase in the microstructure.Reference Semiatin, Knisley, Fagin, Zhang and Barker28 Gil et al.Reference Gil, Ginebra, Manero and Planell29 studied the effect of cooling rate on microstructure evolution and mechanical properties of the Ti–6Al–4V alloy during heat treatment in the β phase field. They reported that the size of αp increased with the decrease in the cooling rate. For the Ti–6Cr–5Mo–5V–4Al alloy, it was shown that the tensile strength and ductility were higher when the alloy was heated in the α/β phase field followed by aging than that of heating in the β phase field.Reference Li, Mi, Ye, Hui, Yu and Wang30 In the β-Cez alloy, orthorhombic martensite (α″) formed when quenched from the β and α + β phase field. The stress–strain behavior during uniaxial tensile testing was characterized by the double yielding effect due to the presence of α″.Reference Grosdidier and Philippe31 Depending on the composition of the alloy, cooling from the β phase field also gives rise to athermal omega phase (ωa), which acts as nucleation sites for the precipitation of α.Reference Ankem and Greene32 Jianwei et al.Reference Xu, Zeng, Zhao, Sun and Du17 showed the effect of cooling rate on the microstructure after heat treatment in the β phase field. They found lamellar structure for slow cooling rate (<15 °C/s) and combined lamellar and martensitic structure for 15–90 °C/s. Above 90 °C/s, the whole microstructure was martensitic. Slow cooling from the β phase field also supported the formation of α phase with same ‘a’ and different ‘c’ lattice parameters. One of the possible reasons for this was reported to be the development of residual stresses due to precipitation of different alloying elements.Reference Malinov, Sha, Guo, Tang and Long33,Reference Cullity34 In the present work, the effect of heating temperature and cooling rate on the microstructure and mechanical properties is investigated for an α + β Ti alloy. The microstructures were systematically studied at different length scales [optical microscopy (OM), scanning electron microscopy (SEM), transmission electron microscopy (TEM), and electron backscattered diffraction (EBSD)] and correlated with the mechanical properties.
II. EXPERIMENTAL
The chemical composition of the material used in the present investigation was Ti–6.5% Al–4.4% V–0.15% Fe (weight percentage). The material was obtained in the form of rod having 10 mm diameter. Small samples of length 20 mm were cut from this rod for subsequent heat treatment by electrical discharge machining. The β transus for the present alloy was determined by the metallographic method35 and was found to be approximately 995 °C. To investigate the influence of heating temperature and the cooling rate on microstructure and phase transformation, three different temperatures were chosen: (i) above the β transus (1066 °C, completely in the β phase field), (ii) just below the β transus (930 °C, in the α + β region), and (iii) well below β transus (850 °C, in the α + β region). The samples were maintained at the respective temperatures for 45 min followed by oil quenching (OQ), AC, and FC. Small samples of size Ø10 mm × 5 mm were cut from the heat treated rods for subsequent characterization. For OM, SEM, and SEM-EDS (energy dispersive spectroscopy to obtain chemical composition of the precipitates), the samples were polished using the standard metallographic procedure35 followed by polishing with a slurry of alumina (0.5 μm particle size) in water and finally with diamond suspension (0.1 μm particle size). The samples were then etched with Kroll’s reagent.35 Optical microstructures were obtained using a ZEISS, Gottingen, Germany, microscope equipped with AxioVision image analysis software, while SEM images were obtained in the secondary electron mode using a JEOL 6380A, Japan, SEM. For obtaining the composition of the precipitates, a BRUKER, Berlin, Germany, EDS attached to SEM was used. For X-ray diffraction (XRD) and EBSD measurements, the samples were electropolished (Struers, Ballerup, Denmark) instead of etching, using an electrolyte consisting of mixture of ethanol and perchloric acid in a ratio of 80:20 at 10 V DC and −10 °C. XRD 2θ scans were performed on a X’pert PRO MPD diffractometer (PANAlytical, Almelo, the Netherlands) using Cu Kα radiation and an X’celerator detector. EBSD scans were done on a FEI Nova Nano SEM (Hillsboro, Oregon) equipped with an EDAX, Mahwah, New Jersey EBSD system using identical beam and video conditions for all the samples. The accelerating voltage used was 20 kV and the working distance was kept 15 mm. Two different step sizes, 0.5 and 0.2 μm, were used to acquire the microtexture information. TSL OIM analysis software (version 7.1) was used to post-process the EBSD data.36 For TEM, thin foils of 100 μm thickness were prepared for as-received and all the OQ samples. TEM was performed due to the limitation of EBSD to observe the sluggish precipitation and phase transformation in the OQ samples. Subsequently, a 3-mm disc was cut from these thin foils followed by ion milling to make electron transparent samples. Bright field (BF), dark field images, and selected area electron diffraction (SAED) pattern were taken from the samples on a JEOL (Tokyo, Japan) JEM 2100 high resolution TEM. Microhardness was measured using MITUTOYO, Kawasaki, Japan microhardness tested and load displacement curves were obtained using the ball indentation test (CSM Instruments, Peuseux, Switzerland). 10 readings were taken for microhardness and 5 readings were taken for the ball indentation tests.
III. RESULTS
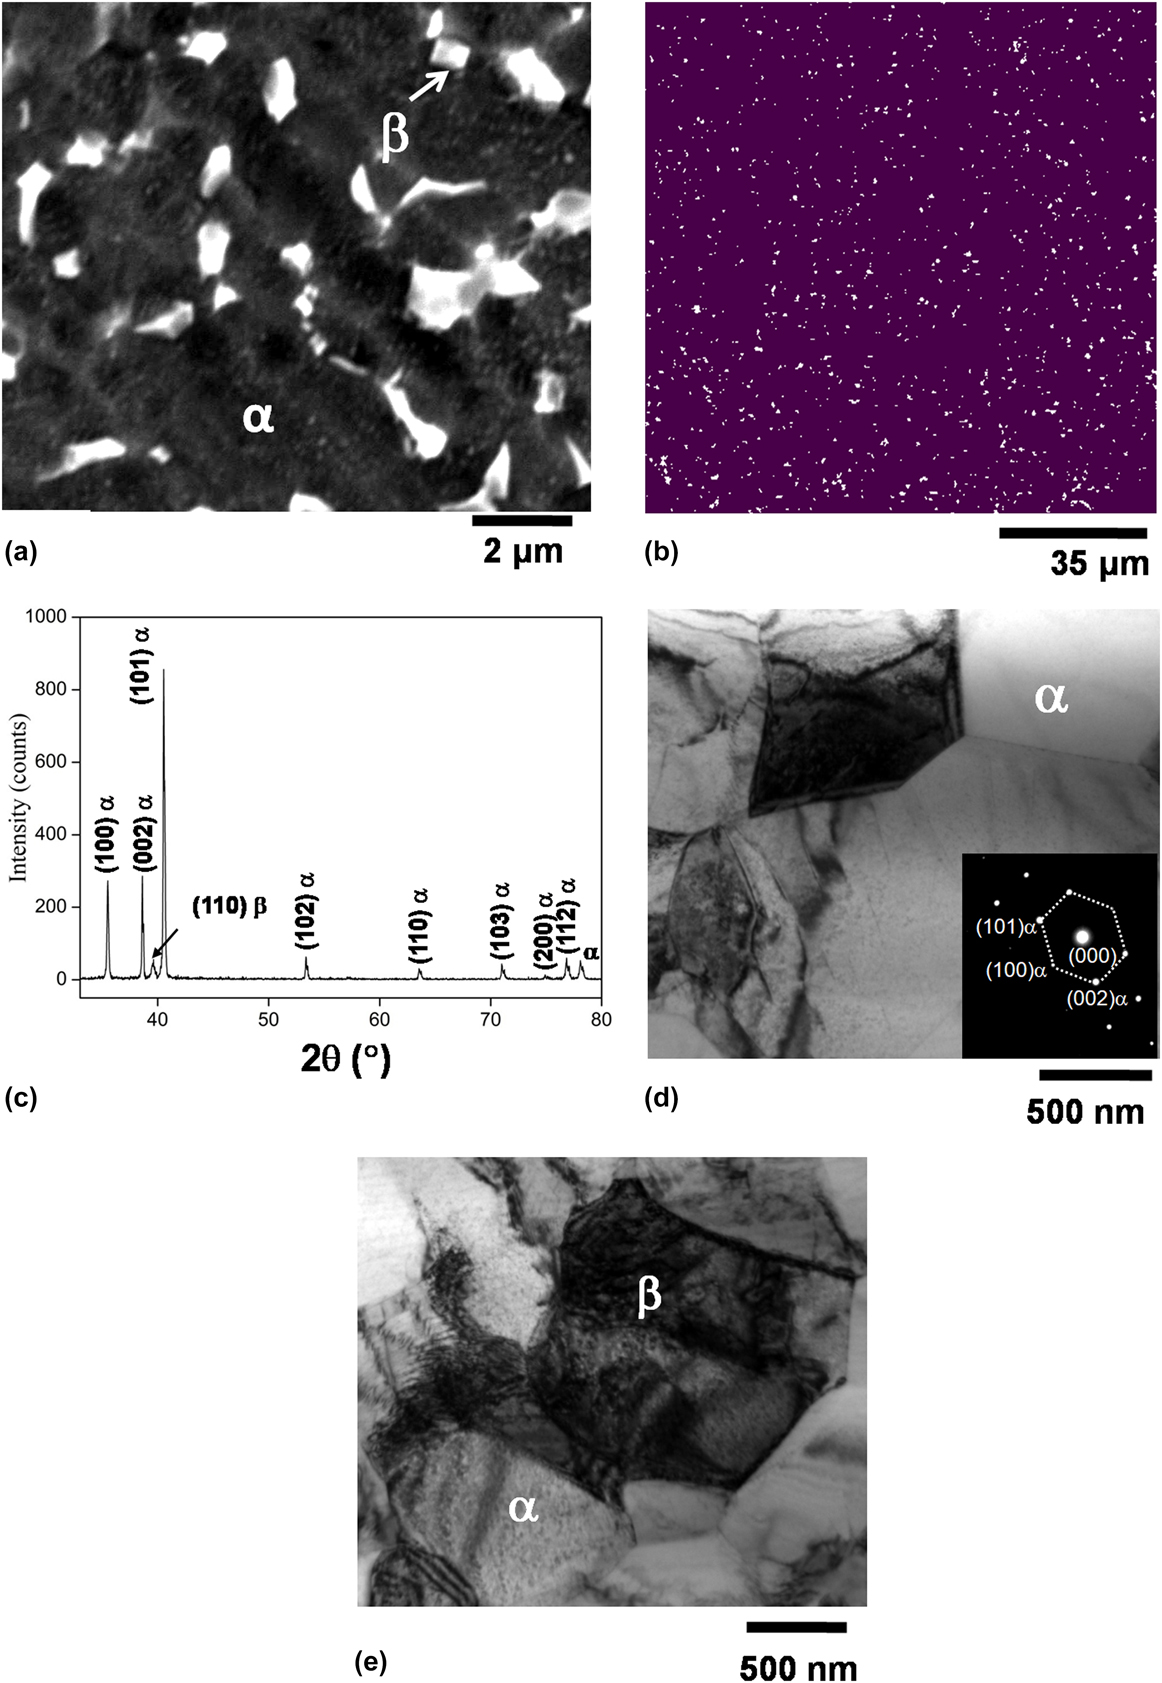
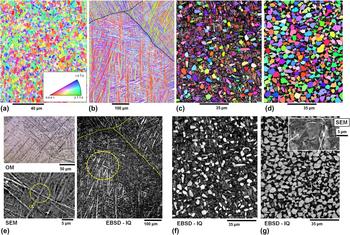
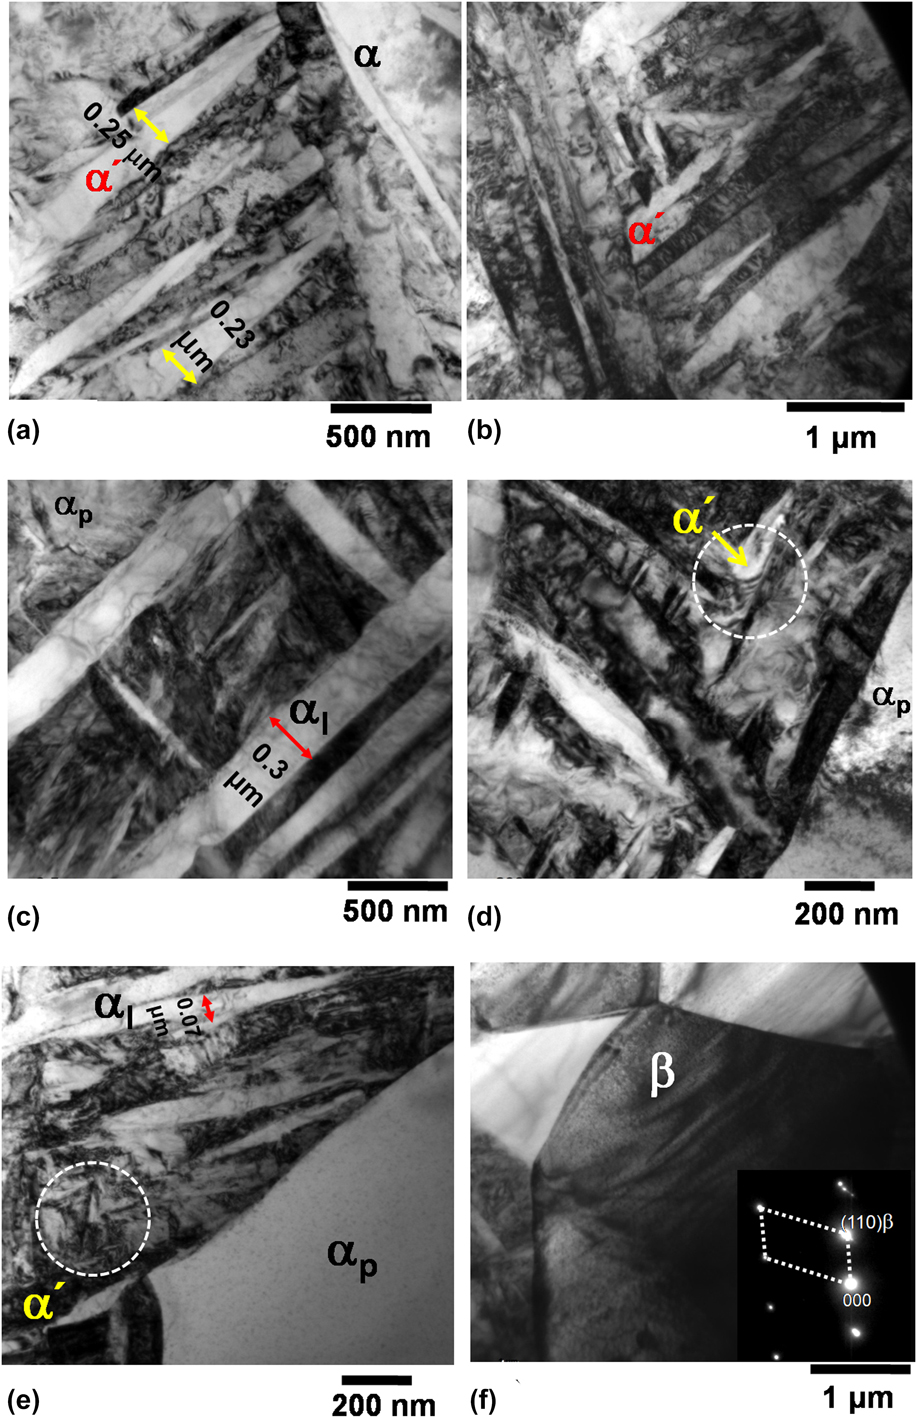
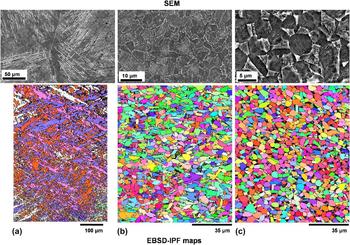
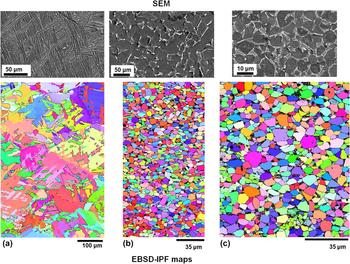
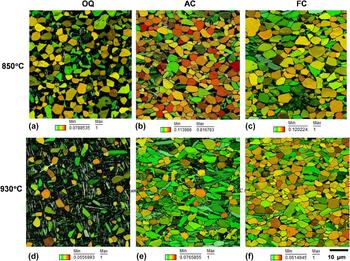
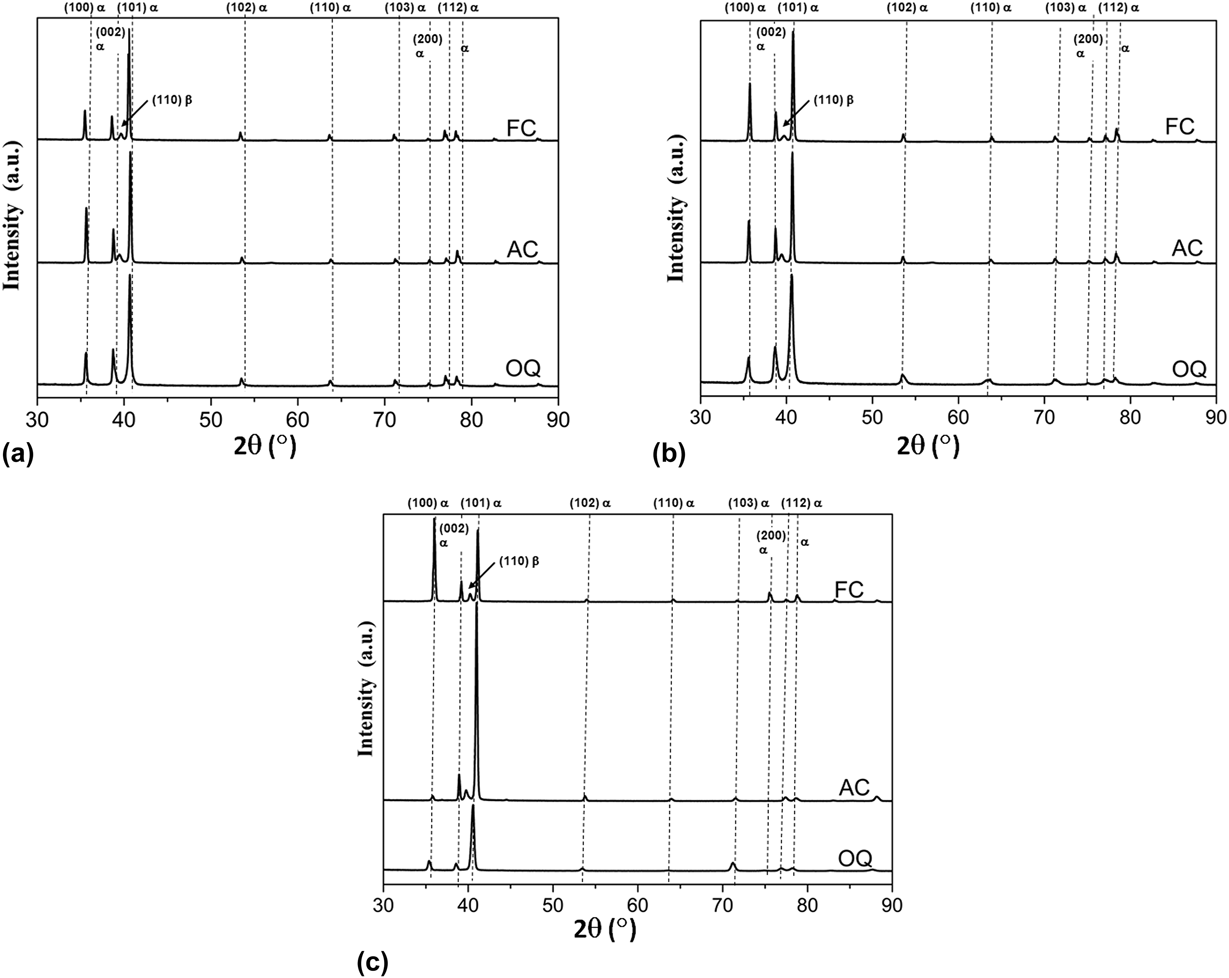
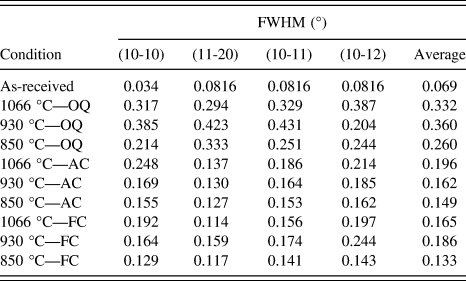
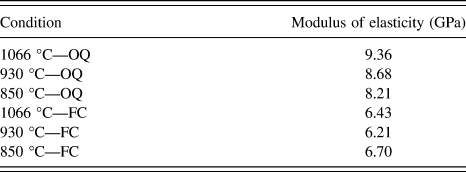
Figure 1 shows the secondary electron SEM image, EBSD phase map (PM), XRD pattern, and TEM images of the as-received sample. In the SEM image, the β phase is appearing as white particles in the α matrix. The β particles are uniformly distributed in the α matrix, the frequency of occurrence being slightly more at grain boundaries and at triple junctions. The area fraction of the β phase was found to be ∼2% from the EBSD analysis. XRD patterns, TEM images (with SAED) also confirmed the existence of α and β phases in the present alloy system. The XRD patterns were indexed based on the ICDD (International Center for Diffraction Data) database for α-Ti37 and β-Ti from Ref. Reference Karasevskaaya, Ivasishin, Semiatin and Matviychuk38. Relative peak intensities were different in the bulk sample from that reported in the ICDD database (which is based on the powdered sample), indicating the presence of crystallographic texture in the as-received material. Figure 2 shows the effect of cooling rate on the microstructural development for heat treatment above the β transus. Figure 2 shows EBSD inverse pole figure (IPF) map for (a) the as-received sample, (b) OQ from 1066 °C, (c) OQ from 930 °C and (d) OQ from 850 °C, (e) OM, secondary electron SEM images, and EBSD image quality (IQ) map for sample OQ from 1066 °C, (f) EBSD-IQ map for sample OQ from 930 °C, and (g) EBSD-IQ and secondary electron SEM image for sample OQ from 850 °C. After OQ from the β phase field, hcp martensite (α′) formed. The prior β grain boundaries are also delineated indicating that the initial β grains were very large in size (approximately >500 μm). The α′ also has similar lattice parameter as that of α. At many locations, the α′ needles were exactly perpendicular to each other [few are highlighted in Fig. 2(e)] and at other places had criss-cross structure.Reference Xu, Zeng, Zhao, Sun and Du17 α′ was formed as a result of diffusion less β → α′ transformation. For OQ from α + β region, the bimodal microstructure consisting of αp and mixed lamellar α/α′ was obtained. The volume fraction, size, and shape of the αp being dependent on the temperature difference from the β transus. After OQ from the α + β region, the β particles precipitated in the alloy. The β particles were extremely fine and the precipitation was very sluggish in nature. There was no defined region where the precipitates were more or less. The precipitation occurred throughout the microstructure in the transformed β during heating. If the temperature of heating is just below the β transus, the lamellar α/α′ will be more (∼55% in the present alloy) with mixed elongated and equiaxed αp. If the temperature is well below the β transus, the lamellar α/α′ will be less (∼24% in the present alloy) with mostly equiaxed αp. In EBSD, the unindexed points were expected to be of β, αs, and α′. The strain induced due to martensitic transformation and precipitation of β particles lead to these unindexed points and hence it was felt necessary to perform TEM. Figure 3 shows the BF-TEM images of samples OQ from 1066 °C [Figs. 3(a) and 3(b)], 930 °C [Figs. 3(c) and 3(d)], and 850 °C [Figs. 3(e) and 3(f)]. The average thickness of martensite lamellae was ∼0.25 nm and αs was not observed in the sample OQ from 1066 °C. For sample OQ from 930 to 850 °C, i.e., from α + β transus, both αs and α′ were observed. The thickness of the αl or αs was 0.3 μm and 0.07 μm for sample OQ from 930 °C to 850 °C respectively. Figure 4 shows the secondary electron SEM images and EBSD-IPF maps for samples air cooled from 1066 °C, 930 °C, and 850 °C, respectively. Both SEM images and EBSD-IPF map indicate the formation of αw in the sample AC from 1066 °C. The SEM image shows grains with grain boundary α (αGB), while IPF map shows the structure inside a single grain. For samples AC from the α + β region, Widmanstatten morphology was not observed in SEM and EBSD images; however, the grains were slightly elongated and were not equiaxed. The precipitation of fine β particles was also observed in the samples. Figure 5 shows the secondary electron SEM images and EBSD-IPF maps for samples furnace cooled from 1066 °C, 930 °C, and 850 °C, respectively. After FC from β phase field, basket weave structure, while after FC from the α + β region, equiaxed α was obtained. The β particles were much coarser in the FC samples than the AC and OQ samples. The thickness of the both αW and αGB phases increased with decreasing cooling rate AC to FC. In FC, sufficient time is available for the diffusion-driven phenomenon to occur. Figure 6 shows the images of grains with the corresponding grain shape aspect ratio superimposed on it for OQ, AC, and FC samples after heating in the α + β region. The shape of the α grains was more lamellar for heating at 930 °C, i.e., just below the β transus. The average grain shape aspect ratio (area average) was 0.36 for the OQ sample, 0.42 for the AC sample, and 0.51 for the FC sample. For 850 °C, it was more close to equiaxed (the average grain shape aspect ratio was in the range 0.52–0.53). A grain shape aspect ratio close to 0 indicates elongated shape of grains and its value close to 1 indicates circular or nearly equiaxed grains. The grain shape may play an important role in deciding the mechanical properties along with the phase fraction of various components in the system. Figure 7 shows the XRD patterns 2θ scans of all the samples. The OQ samples did not show the existence of β phase or the β phase is too low to be detected by XRD. For FC and AC samples, distinct α and β phase peaks were visible. The XRD results (indirect) supplement the direct observation of β particles in the α matrix by SEM and EBSD. The peak broadening for 4 strongest peaks (α phase) is given in Table I. The average peak broadening for the OQ samples was found to be highest for sample OQ from just below the β transus. This is in contrast to the expectation that martensitic transformation is going to induce highest strains and hence highest broadening in the XRD peak profiles. For heating just below the β transus, the broadening decreased gradually with the decrease in heating temperature. For FC samples, again heating at 930 °C showed highest broadening. Figure 8 shows the effect of heat treatment (i.e., heating temperature and cooling rate) on microhardness and load–displacement curve. There was a drastic change of hardness from 300 Hv (FC) to 500 Hv (OQ) for samples heated in the β phase field. For heating in the α + β phase field, i.e., at 930 and 850 °C, the hardness increased marginally (∼25–30 Hv). The hardness of the fully martensitic structure α′ (OQ from the β phase) and α′ + α + β particles (OQ from 930 °C which is just below the β transus) was nearly same. The load–displacement curve shifted to right (indicating increase in the depth of penetration of the indentor) with the decrease in heating temperature for both OQ and FC samples. These are consistent with the microhardness measurement results which indicated similar trend. The elastic modulus obtained from the load–displacement curves is given in Table II.
(a) Secondary electron SEM image, (b) EBSD PM (black is α matrix and white is β phase), (c) indexed XRD pattern, (d) and (e) BF-TEM image for the as-received sample. SAED pattern of the α phase is also shown in (d).

EBSD-IPF map for (a) the as-received sample, (b) OQ from 1066 °C, (c) OQ from 930 °C and (d) OQ from 850 °C, (e) OM, secondary electron SEM images and EBSD-IQ map for sample OQ from 1066 °C, (f) EBSD-IQ map for sample OQ from 930 °C, and (g) EBSD-IQ and secondary electron SEM image for sample OQ from 850 °C. The color coding for (a) through (d) is as per the IPF triangle shown in (a).

BF-TEM images for OQ samples. (a) and (b) quenched from 1066 °C, (c) and (d) quenched from 930 °C, (e) and (f) quenched from 850 °C. SAED pattern in (f) is for cubic β phase.

Secondary electron SEM image and EBSD-IPF map for (a) 1066 °C AC, (b) 930 °C AC, and (c) 850 °C AC samples, respectively. The color coding for EBSD-IPF maps is as per the IPF triangle shown in Fig. 2(a).

Secondary electron SEM image and EBSD-IPF map for (a) 1066 °C FC, (b) 930 °C FC, and (c) 850 °C FC samples, respectively. The color coding for EBSD-IPF maps is as per the IPF triangle shown in Fig. 2(a).

Grain shape aspect ratio map for samples heat treated at 850 °C [(a), (b), and (c)] and 930 °C [(d), (e), and (f)].

XRD patterns for samples heat treated at (a) 1066 °C, (b) 930 °C, and (c) 850 °C.

Peak broadening [full width at half maximum (°) as determined by XRD peak profile analysis] for different conditions.

(a) Vickers microhardness, (b) load–depth curve for OQ samples, and (c) load–depth curve for FC samples.

Modulus of elasticity (GPa, determined from load–displacement curves) for different conditions.

IV. DISCUSSION
The most important observations of the present investigation can be briefly summarized as follows:
(i) After OQ from above the β transus, predominantly α′ was formed in the microstructure. By contrast, after OQ from the α + β region, bimodal distribution of α grains and α′ + αs + β was observed. The β particles were much more when OQ from 930 °C. Furthermore, the β particles were very fine and the precipitation was very sluggish due to the presence of multiple phases.
(ii) AC from above the β transus results predominantly in the Widmanstatten microstructure. For AC from the α + β region, the grains were slightly lamellar and Widmanstatten morphology was not observed. The microstructure consisted of lamellar α and αp. The grains were more lamellar for samples AC from just below the β transus. The basket weave structure was observed for FC from the β phase field, while after FC from the α + β region, equiaxed α was obtained. The β particles were much coarser in furnace cooled samples.
(iii) XRD also confirmed the presence of β phase in the AC and FC samples. The peak broadening was significantly higher in OQ samples due to complex phase transformations (formation of α′ and precipitation of fine β particles). XRD results supplemented the TEM observation of the OQ samples.
The XRD, TEM, SEM, and EBSD patterns confirmed the presence of β phase in the initial as-received material. Fine β particles were uniformly distributed throughout the α phase (with average grain size ∼2 μm). The average FWHM of the initial as-received material (α phase) was 0.069°, indicating that it was processed at higher temperatures where repeated recrystallization of the α grains was taking place and the grains were free of dislocations and other defects. In other words, the narrow XRD peak profiles indicate that it was in a relatively strain free condition. The microstructure is also consistent with that reported in the literature.Reference Guelorget, Francois and Lu39 All the OQ samples showed the presence of α′. The α′ needles are usually perpendicular to each other and are extremely thin. The martensitic transformation is always associated with very high dislocation content and transformation-induced stresses in the material. This high dislocation content manifests itself in the form of broadening of the X-ray peak profiles (increase in FWHM or value of integral breadth), while the phase transformation-induced stresses cause shifting of the X-ray peak profiles. In addition, the precipitation of αs and β particles cause addition broadening since they are also associated with additional defects/interfaces. The martensitic structure also has the highest hardness. It has been reportedReference Ghaderi, Hodgson and Barnett5,Reference Meyer, Kruger, Sommer, Halle and Hockauf40,Reference da Rocha, Adabo, Vaz and Henriques41 that α + β Ti alloys achieve highest hardness and reasonable ductility after quenching (from β phase field) and aging, when fine β particles will be precipitated uniformly in the α matrix. In the present case, OQ from just below the β transus resulted in a bimodal microstructure which may be good for mechanical properties. While working above the β transus, two types of phase transformations can be observed depending on the cooling rate: diffusion-controlled and diffusionless. During slow cooling from β phase field, some discontinuous β to α phase is formed on the grain boundary and initial αGB points are formed. Continuous cooling forms continuous grain boundary by connecting αGB phase and then the αWGB phase forms from the αGB phase and starts growing into the grain. The αWGB continues to grow into β grain interior with the same crystal orientation and keeping consistent growth direction and forms α colony until α colony meets each other. This process is often called sympathetic nucleation and growth.Reference Lutjering and Williams3 The individual α plates are separated within the α colonies by the retained β matrix, called as β plates. The α and β plates are often called α and β lamellae and the resulting microstructure is designated as lamellar. In such slowly cooled material, the size of the α colonies can be as large as half of the β grain size. The primary equiaxed α is completely dissolved and replaced by the precipitation of the αWGB and αGB phases when material is cooled from the β phase. On the contrary, αp is reserved and αWGB and αGB phases are almost invisible when material is cooled from the α/β region. However, diffusionless or martensitic transformation is abrupt and occurs instantaneously. Working below the β transus, αp + αL + β was observed in the microstructures.Reference Xu, Zeng, Zhao, Sun and Du17 The size of the αp is generally large for the low temperature heating as compared to high temperature heating,Reference Semiatin, Knisley, Fagin, Zhang and Barker28 but volume content depends on the cooling rate. αL was formed from the β phase through the diffusion transformation, i.e., β → αL.Reference Xu, Zeng, Zhao, Sun and Du17 The dominant reason for former was that the αp started dissolving at high temperature zone, whereas the latter was controlled by size of the β as well as the cooling rate.Reference Semiatin, Knisley, Fagin, Zhang and Barker28 During separation into αp and β, an alloying partitioning effect also takes place. This partitioning is dependent on the α stabilizers (Al and O) and β stabilizers (Mo and V). α stabilizing alloying elements are mostly located in the αp grains and αL is therefore having poor alloying addition, causes a great difference in the strength between α and β lamellae.Reference Xu, Zeng, Zhao, Sun and Du17 The volume content of the lamellae (α + β) is dependent on the size of the β grains since the equilibrium β fraction is high at temperature closer to β transus, and these equiaxed β grains transform to lamellar α + β upon cooling with higher cooling rate.Reference Lutjering and Williams3 Therefore, higher volume fraction of αL was observed after higher quenching temperature than the lower quenching temperature. The lamellar spacing was probably determined by the cooling rate, higher cooling rate resulting in finer lamellar spacing.Reference Dabrowski14,Reference Xu, Zeng, Zhao, Sun and Du17 If the cooling rate from the recrystallization annealing temperature is sufficiently low, only the αp grains will grow during the cooling process and no lamellar α is formed within the β grains, resulting epitaxial growth of equiaxed α grains.Reference Lutjering and Williams3 In hcp Ti alloys, the transformation of β (bcc) to α (hcp) obeys the Burgers crystallographic orientation relationship (BOR)Reference Burgers42:
 $${\left\{ {0001} \right\}_\alpha }{\rm{//}}{\left\{ {{\rm{110}}} \right\}_\beta }\;{\rm{and}}\;{\left\langle {11\bar{2}0} \right\rangle _\alpha }//{\left\langle {111} \right\rangle _\beta }\quad .$$
It has been reportedReference Gey and Humbert43 that a β grain can transform to 12 possible α variants according to BOR. The phase transformation or in other words, the number of α variants strongly depends on the transformation conditions. In most cases, all the 12 α variants do not occur with equal probability. Usually 4 to 6 variants are observed suggesting that variant selection also occurs during phase transformation. In general, for an alloy system consisting of hcp and bcc phases, BOR leads to an interface having minimum total dislocation energy and hence highest probability of occurrence of BOR.Reference Burgers42,Reference Banerjee and Williams44 Furthermore, it is generally believed that the elastic modulus of a material does not change significantly with microstructure.Reference Ma, Li, Li, Cao, Li and Dong45 For OQ samples, the modulus of elasticity was in the range 9.36–8.21 GPa and for FC samples, it was in the range 6.43–6.70 GPa. This clearly suggests that the microstructure is very important and can affect mechanical properties as well as modulus of elasticity significantly. For FC samples, α colony size is one of the key factors for deciding the mechanical properties.Reference Lutjering46
V. CONCLUSIONS
The following conclusions can be drawn based on the present investigation:
(1) Both the heating temperature and cooling rate had a significant effect on the microstructure of the α + β Ti alloy. OQ from β phase field formed predominantly hcp α′ martensite, while OQ from the α + β phase field formed a duplex microstructure consisting of primary α, lamellar α, α′ and fine β precipitates. The lamellar α was more for sample OQ from just below the β transus. AC from β phase field formed the Widmanstatten α microstructure with fine β particles, while for AC from α + β phase field Widmanstatten morphology was not observed. FC from the β phase field resulted in the basket weave structure, while FC from α + β phase field resulted in equiaxed α with coarse β particles. The lamellar shape of the α grains was a result of combined effect of transformation strain and cooling rate.
(2) Microhardness values were highest for the sample OQ from 1066 and 930 °C. The effect of cooling rate was negligible for the sample heat treated just below the β transus. The effect is expected to be due to the bimodal microstructure. The samples heat treated in the β phase field showed highest variation in the microhardness as a function of cooling rate. The modulus of elasticity was also found to be extremely sensitive to the microstructure. It showed a variation of ∼30% and is expected to be very much dependent on the phases present and their distribution.
ACKNOWLEDGMENTS
The authors are thankful to the Director of VNIT Nagpur for providing the necessary facilities and constant encouragement to publish this paper. The authors would like to acknowledge the use of National Facility for Texture and OIM (A DST-IRPHA project), IIT Bombay for EBSD measurements. One of the authors RKK wishes to acknowledge Science and Engineering Research Board (SERB) for financial assistance (grant no. EEQ/2016/000408 dated 08/02/2017) to carry out this work.