Introduction
Agricultural land is a hybrid human-natural system (Turner et al. Reference Turner, Matson, McCarthy, Corell, Lindsey, Noelle, Hovelsrud-Broda, Kasperson, Kasperson, Amy, Martello, Svein, Rosamond, Colin, Alexander, Andrew, Henrik and Nicholas2003). Natural processes undeniably persist in “agroecosystems,” including photosynthesis, food webs, and biodiversity, from soil micro-organisms to insects, plants, and animals. The cycling of water, nutrients, and energy are crucial components of any functioning farm (Bayliss-Smith Reference Bayliss-Smith1982). But farmland is also the realm of human manipulation of nature, a place where people intentionally reduce biodiversity; channel the flows of water, nutrients, and energy; and reshape nature for focused human goals (Cussó et al. Reference Cusso, Ramon and Enric2006). Unlike natural ecosystems, agroecosystems are not self-sustaining; they require annual inputs of human labor, energy, knowledge, and culture. Agricultural land currently occupies one-third of the earth’s continental surface, making farming a prominent instance of human-nature interaction that should be of intense interest for environmental history (Worster Reference Worster1990). Two and a half centuries after the advent of the Industrial Revolution, agriculture still supplies 90 percent of our food, so farming should be of intense interest to sustainability science as well (Gonzalez de Molina and Toledo Reference Gonzalez de Molina and Toledo2014).
Sustaining soil fertility is a challenge common to all farmers, everywhere in the world and through 10,000 years since the Neolithic Revolution (McNeill and Winiwarter Reference McNeill and Verena2006). In agroecosystems the essential elements for plant growth at the base of the agricultural enterprise include nitrogen, phosphorus, potassium, and carbon, and in many places nitrogen is the crucial limiting element (Tisdale et al. Reference Tisdale, Nelson, Beaton and Havlin1993). Farming, by its very nature, depletes nitrogen. Simply tilling soil releases nitrogen from the land and harvesting crops extracts more (Cunfer Reference Cunfer2004). Nitrogen is the building block of proteins that we all need to live and thrive. An essential goal of agriculture is to extract nitrogen and other nutrients from the soil to grow human flesh and bone and fuel human activity. Yet that central objective of farming undermines soil sustainability. From time immemorial farmers have faced the problem of how to return nitrogen to the soil so that next year’s crop will flourish (Craven Reference Craven2006; Donahue Reference Donahue2004). It is a fundamental human-nature interaction and a profound sustainability challenge.
Farmers around the world have developed a handful of mechanisms for returning fertility to soils, each with significant limitations or costs for farm communities. In the ancient Nile River valley, for example, farmers depended on annual floods that carried nitrogen-rich sediment from distant mountains to replenish fields (Montgomery Reference Montgomery2007). This rare instance of free fertilizer sustained agriculture for thousands of years, but it spatially constrained Egyptian civilization to a narrow thread of riverside land winding through a vast desert. In other places, integrating livestock and cropland provided nitrogen-rich manure to replenish depleted fields (Jones Reference Jones2012). But livestock must be fed with a significant portion of cropland produce, plus they required ceaseless manual labor to keep them alive. Even hauling manure from barnyard to field, one cartload at a time, was physically demanding (Stoll Reference Stoll2002). Farmers in the Mediterranean, where dry climate meant little grazing and few livestock, hauled brush and prunings from woodlands, vineyards, and olive groves to burn it in trenches laboriously excavated in crop fields (Olarieta et al. Reference Olarieta, Padro, Massip, Rodriguez-Ochoa, Vicedo and Tello2011; Tello et al. Reference Tello, Garrabou, Cusso, Olarieta and Galan2012). Others shipped in bird guano from Peru, around Tierra del Fuego, and across the Atlantic (Cushman Reference Cushman2013). Tending livestock, hauling manure, burying forest litter, digging guano: brute labor was often the cost of sustaining soil fertility.
An alternative to the hard work of soil replenishment was to let nature do the job. That required time and space, rather than labor. Leaving part of the cropland fallow each year—as in the traditional European three-field rotation that idled one-third of arable land annually—allowed natural soil replenishment processes to play out, but required forgoing the harvest from that land. In wetter climates, livestock sometimes grazed fallow land, dropping manure as they wandered about, but in semiarid places like the Great Plains farmers cultivated fallow land to conserve its moisture. In either case, fallowed land remained unproductive for a season, as it naturally replenished a portion of soil fertility and soil moisture.
Legumes represented a special option in farmers’ soil management toolkit. These plants, including peas, beans, soy, vetch, and alfalfa, among others, allowed farmers to tap into an abundant source of nitrogen that was ready-to-hand, but extremely difficult to acquire: the air. Nearly 80 percent of our atmosphere is inert nitrogen. Through a symbiotic relationship with bacteria, legume plants pull that nitrogen out of the air and transform it into plant-useable form in nodules on their roots. No other plants on earth can do this. Legumes have the unique quality of replenishing more soil nitrogen than they consume. By including legume plants in crop rotations, farmers were able to both harvest a crop and build soil nitrogen stocks at the same time. Depending on particular local circumstances, farmers all over the world employed various combinations of these techniques—balancing trade-offs of labor, arable land, time, and crop mix—to ensure that next year’s cropland would have the nitrogen resources necessary to produce a good harvest.
Another option for accessing soil nutrients was the time-honored tradition of colonizing new cropland. Imagine a farmer who left behind a life of laborious soil fertility management to move to an agricultural frontier: fresh land never plowed before, where soils were so rich that they produced bumper crops year after year with little investment in soil renewal. Apparently unlimited in expanse, not confined to narrow river valleys, this new country extended for a thousand miles in any direction, undulating to the horizon. In the nineteenth century, farmers found precisely that opportunity in many parts of the world (Richards Reference Richards2003). The most important agricultural development of the long nineteenth century was a massive and rapid expansion by farmers into the world’s grasslands, a process that doubled global land in farms. Displacing Indigenous populations, European settlers plowed and fenced extensive new territories in North America’s Great Plains (Cunfer Reference Cunfer2005), South America’s campos and pampas, the Ukrainian and Russian steppes (Moon Reference Moon2013), and parts of Australia and New Zealand (Brooking and Pawson Reference Brooking and Eric2011). Between 1800 and 1920, arable land increased from 400 million hectares to 950 million hectares, and pasture land from 950 to 2,300 million hectares; much of that expansion occurred in grasslands (Goldewijk Reference Goldewijk2001). These regions became enduring “breadbaskets” for their respective nations and fed the nineteenth century’s 60 percent increase in world population (US Census Bureau 2017). Never had so much new land come into agricultural production so fast. This episode was one of the most extensive and important environmental transformations in world history.
In North America, grassland occupation played out in the United States and Canadian Great Plains, where farmers converted nearly a fifth of the continent for agriculture between 1830 and 1930, tapping into enormous stockpiles of soil nutrients. This article investigates soil fertility processes in the US Great Plains, specifically the state of Kansas. It tracks nitrogen flows through agricultural soils as a means of evaluating the sustainability of soil fertility in comparison with crop productivity through the first 150 years of Great Plains agriculture. Frontier settlement took place in the context of modern nation-states intent on expanding their territories, increasing their populations, and developing their economies (Scott Reference Scott1998). Nineteenth-century agricultural colonization was a state enterprise as much as a folk movement. Governments subsidized pioneer settlement through Indigenous removal, free or low-cost land grants, and infrastructure development such as roads, railroads, military protection, and post offices. They also gathered statistics—population and agricultural censuses—that both monitored the settlement process and promoted further immigration. That unprecedented documentary record reveals a massive ecological transformation, in fine detail and from its very beginning (Gutmann et al. Reference Gutmann, Parton, Geoff and Burke2005). This article proposes a systematic evaluation of the world’s nineteenth-century agricultural frontiers based on census data and employing socioecological metabolism methods drawn from sustainability science and agroecology. It relies on agricultural census data to estimate nitrogen inputs and outputs of agricultural activity and to calculate annual nitrogen balances. Footnote 1 While the present examples come from the US Great Plains, the approach is applicable throughout North America and anywhere bureaucratic governments deployed reliable and systematic censuses.
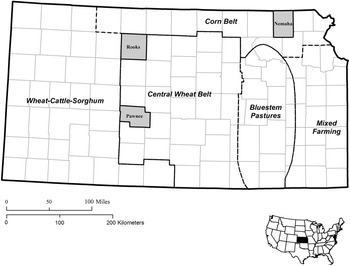
Three Kansas communities serve as case studies that reveal the dynamics of Great Plains soil fertility processes (figure 1). Nemaha County in the tallgrass prairie region represents the earliest Euro-American settlement in the wetter eastern Great Plains, beginning in the 1850s. Farther west, in the semiarid shortgrass plains, Rooks County is a dryland wheat and grazing region typical of a broad swathe of grasslands that extends from Saskatchewan to Texas. Pawnee County, Kansas, reveals the impact of irrigation development that transformed large areas of the plains in the second half of the twentieth century. Because of its central location in the North American grassland, its span of climate zones from east to west, and its excellent documentary record, Kansas has been the focus of considerable recent environmental history scholarship (Cunfer and Krausmann Reference Cunfer and Fridolin2009, 2016; Cunfer et al. Reference Cunfer, Andrew and Joshua2018; Maxwell and Sylvester Reference Maxwell and Sylvester2012; Sylvester and Cunfer Reference Sylvester and Geoff2009; Sylvester and Rupley Reference Sylvester and Eric2012). Committed to boosting immigration and constructing a robust agricultural economy, the state of Kansas invested in a variety of development initiatives soon after the Civil War. It offered land and tax reductions to railroad companies, built land grant universities with strong agriculture programs, partnered with the US Department of Agriculture to place agricultural extension agents in every county, and established agricultural experiment stations across the state. Of especial interest to historians, the state also created its own annual population and agricultural censuses beginning in 1872 that provide an unequaled record of the settlement and agricultural development of the plains through their first century of farm evolution (Sylvester et al. Reference Sylvester, Susan Hautaniemi, Gutmann and Geoff2006). This article builds on that foundation and extends it underground.
Kansas case study locations and agroecological zones (Malin Reference Malin1944).

Kansas is a microcosm of the Great Plains environment, spanning wet to dry climate zones and tallgrass to shortgrass vegetation. Rainfall declines from humid eastern Kansas, where average annual precipitation exceeds 40 inches (1,000 mm), to the semiarid west, with average rainfall as low as 16 inches (400 mm). But averages disguise high annual variation. In the middle of a continent, far from hydrating, warming, and moderating oceans, Great Plains weather fluctuates wildly, bringing extended droughts, heat waves, bitterly cold winters, and near constant wind. Water, or lack of it, was always the crucial natural limitation upon people’s ambitions and land use. Vegetation followed climate patterns, but with significant human-induced alterations (Wishart Reference Wishart2007). Tallgrass prairie in the east depended upon regular burning by Native Americans (Pyne Reference Pyne1982, Reference Pyne2001). When Euro-American settlers suppressed fire, uncultivated tallgrass prairie grew into low forest and brushland. The exception was in the bluestem pastures of the Flint Hills, where Euro-American ranchers continued controlled burning and where, as a result, tallgrasses still grow (Courtwright Reference Courtwright2011). The mixed-grass transition zone in central Kansas intermingled tallgrasses with shortgrass species. Shortgrass steppe vegetation dominated the dry western third of Kansas, soon to become part of America’s “wheat belt.” Settlers discovered a gradient of vegetation, some of it cutting against climate drivers because of Native American land management. Beneath those grasses lay deep, rich soils holding a wealth of stockpiled nutrients, including nitrogen and a dozen other elements essential to plant growth. Kansas had some of the richest soils in the world, which farmers immediately recognized when they plowed the land. After climate, soil was the most important natural factor guiding land use decisions. Soil conditions were also dynamic in the frontier context, changing during the first 60 years as a result of agricultural practices.
A focus on soil fertility reveals a three-phase development of Great Plains agriculture, from first settlement through the end of the twentieth century. An initial era of pioneer colonization saw significant soil mining, along with some adaptation that partially mitigated fertility depletion. That environmental decline contributed to a second period of crisis and recovery between 1930 and 1950, followed by the advent of modern, industrial agriculture that transformed soil nutrient management through major investments of fossil fuel energy. Soil nitrogen management on Great Plains farms has never been in a state of sustainable balance for any extended period. For decades farmers extracted more nitrogen than they replaced, drawing down a natural bequest of the native grassland. Since the 1950s, they have poured inexpensive synthetic nitrogen fertilizers onto cropland, about half of which ended up wasted, contributing to water and air pollution. A ground-level evaluation of Great Plains farm sustainability reveals 150 years of change in North America’s agricultural heartland and the extent to which modern farm productivity depends upon fossil fuel subsidies.
Soil Nitrogen Flows and Balances
Of the sixteen elements essential for plant growth, three are limiting in most natural ecosystems on earth: nitrogen (N), phosphorous (P), and potassium (K).Footnote 2 A shortage of one or more of these elements often serves as the practical limitation on the amount of plant biomass that can grow in any given place, given local climate conditions. And in the natural world, N is by far in the shortest supply. In natural as well as human-managed ecosystems, nitrogen availability often determines the amount of plant matter present and constrains additional biomass growth. Although the earth’s atmosphere is nearly 78 percent nitrogen, it exists in an inert form unusable by plants. Only two natural forces convert (or “fix”) inert atmospheric N into compounds (such as ammonia) that plants can absorb through their roots: lightning and selected bacteria. Both forces deploy energy to split apart and recombine atmospheric N, making it available to plants. Lightning’s sudden jolt of energy does the job in an instant, releasing plant-useable nitrogen that drifts down onto soils (dry deposition) or falls attached to raindrops (wet deposition). Alternatively, some bacteria in soils ingest atmospheric N and excrete plant-useable N as part of their metabolism, slowly depositing the compounds in soils where plant roots can reach them. This “slow burn” also requires an input of energy, but in miniscule amounts distributed widely across time and space. All living plants on earth access their necessary nitrogen from one of these two sources, and the distribution of bacterial digestion and lightning storms establishes soil N concentrations and sets the pace of plant biomass productivity at a global scale. At least that was the case until the early twentieth century, when scientists created a third mechanism for nitrogen fertilization by deploying fossil fuel energy to fix nitrogen in the lab. The resulting flood of synthetic fertilizers has doubled the supply of plant-available N at the global scale, one of the most significant human interventions in natural systems (Smil Reference Smil2001).
Once fixed nitrogen is in the soil, plants can use it over and over. They draw nitrogen from soil into their roots and use it to build stems, leaves, flowers, and fruit. When a plant dies its constituent nitrogen decomposes back into the soil, becoming available for new growth; this is the basis of composting. Or perhaps a cow or other animal eats the plant, ingesting nitrogen for its own protein-building needs. After digestion, a considerable amount of the original N returns to the soil through manure, providing fertilizer for new plant growth.
If such natural recycling continues over thousands of years, soils can accumulate rich stockpiles of plant-available N that support luxuriant vegetation year after year. But ammonia and other forms of plant-useable nitrogen are inherently volatile, always at risk of dispersal from soils. It may dissolve in water and run off the surface or leach deep into the subsoil. It may volatilize and return to the atmosphere directly. It may feed a different group of bacteria whose metabolic processes send soil N back into the air (denitrification). In these cases, N returns to the atmosphere in inert form, no longer able to support plant growth. Natural ecosystems tend toward an unstable equilibrium, as N flows into soils, recycles repeatedly, and then flows out again. Farmers, as ecosystem managers, attempt to manage these processes in support of their preferred crop plants. They encourage processes that fix nitrogen in soils, for example by planting legume crops that come with their own herd of N-fixing bacteria. They invest considerable labor to support nitrogen recycling, by plowing down stubble or piling up compost heaps. And they transport nitrogen from one part of the farm (such as pastures) to another (such as cropland), often by managing livestock who collect N by grazing during the day, walk back to the stable at night, and deposit N-rich manure for application on cropland. A large part of agriculture—both crop planting and livestock herding—might be considered, in fact, a system of nitrogen cultivation, processing, and transport.
When Euro-American farmers began plowing prairie sod in the mid-nineteenth century they discovered rich soils in most places. In Kansas, deep soils contained decomposed nutrients of grass roots that penetrated 6 feet (2 meters) into the ground. Soil nitrogen had been accumulating here at least since the end of the last ice age, more than 10,000 years earlier. Compared to long-farmed croplands of Europe and even those of North America’s forested eastern seaboard, grassland soils contained abundant nitrogen—between 10 and 12 tons of nitrogen per hectare in the locations considered here (US Department of Agriculture 1978, 1982, 2003). Crop productivity was prodigious. In one comparison, Austro-Hungarian immigrants to Kansas produced double the grain yield they grew back home with only 5 percent of the labor (Cunfer and Krausmann Reference Cunfer and Fridolin2009). It is no wonder that Americans and Europeans flooded into the plains when the opportunity arose.
All that was possible when there was enough rain, which was far from certain, and throughout the pioneer era farmers worried more about soil moisture than about soil fertility (Miner Reference Miner1986, Reference Miner2006). Still, soil nutrient dynamics began changing immediately after sodbreaking, whether farmers attended to them or not (Haas et al. Reference Haas, Evans and Miles1957). Cropland began each spring with a stockpile of nitrogen carried over winter from the previous year. Through the growing season, soils received inputs of nitrogen from both natural and human-managed sources, which added to nutrient stocks. Soils also lost nitrogen through natural and human-controlled pathways. This study estimates inputs and outputs of nitrogen to calculate annual balances (figure 2). It begins with the known nitrogen content of unplowed soil, then adds annual inputs and deducts outputs to calculate the amount of soil nitrogen carried forward into the coming year (Garcia-Ruiz et al. Reference Garcia-Ruiz, Manuel, Gloria, David and Juan2012). Because soil science operates in the metric system, nitrogen flows appear in kilograms per hectare (kg/ha), with 1 kg/ha equivalent to slightly less than 1 pound/acre. Tracking soil nitrogen dynamics at 19 time points between 1880 and 1997 (corresponding with US Agricultural Census years) reveals farmers’ interaction with one of the planet’s most important natural systems through 120 years of agricultural evolution.
Nitrogen inputs and outputs in agroecosystems. White arrows represent primarily natural processes, while gray arrows indicate human-managed pathways (Garcia-Ruiz et al. Reference Garcia-Ruiz, Manuel, Gloria, David and Juan2012).
Note: While leaching and erosion are natural processes, land management practices affect their magnitude and might be considered hybrid natural and human processes.

Natural nitrogen inputs include two forms of atmospheric deposition plus free bacterial fixation. Atmospheric nitrogen drifted down onto cropland attached to dust particles (dry deposition) and to raindrops (wet deposition). In the Great Plains, atmospheric deposition was quite low. Wet deposition is estimated at 0.57 grams N per cubic meter of rainfall (Allen Reference Allen2008; Vasquez et al. Reference Vázquez, Costoya, Peña, García and Herrero2003). For each year that amount is multiplied by the total annual precipitation (estimated from historical weather station data available for 1895 to 1993). For example, in 1950 Nemaha County, Kansas received 845 mm of precipitation bringing an estimated 5 kg N per hectare to cropland through wet deposition. For 1880, 1890, and 1997, when weather station data are not available, the 99-year average precipitation substitutes. Dry deposition is typically an order of magnitude smaller, so negligible that it is not estimated here (Holland et al. Reference Holland, Braswell, Sulzman and Lamarque2005). Free-living bacteria in soils also generate plant-useable nitrogen as part of their own metabolic processes (free fixation), but they are more active in humid climates than in the semiarid grasslands. Free fixation adds about 4 kg N per hectare in similar environments, reduced somewhat by each cultivation event in a year (Boring et al. Reference Boring, Swank, Waide and Henderson1988; Unkovich and Baldock Reference Unkovich and Baldock2008). This analysis assumes two cultivations per year for most crops and thus estimates free fixation inputs at around 2 kg N per hectare. Adding roughly 5 kg/N/ha from rainfall plus 2 kg from free fixation means that natural processes contributed about 7 kg N/ha to Kansas soils in most years.
Several nitrogen inputs are wholly or primarily human-managed. A traditional way to replenish cropland fertility was collecting livestock manure for application on fields. The census reports the numbers of domestic animals on farms, allowing an estimation of their manure production and its nitrogen content. Manure from animals living in the barnyard (horses, mules, milk cattle, swine, poultry) was available for cropland application. Beef cattle, however, spent much of the year on dispersed pastures, meaning that their manure was not easily collected and therefore must be excluded from calculations. Another human-managed N input depended on symbiotic fixation, a natural process by which bacteria on root nodules of legumes draw nitrogen from the air and transform it into plant-useable nitrogen in the soil. Symbiotic fixation happens in nature, but on farms it is a human-controlled process because farmers decide how much or how little of their cropland to plant in legumes. In the Great Plains, key legume crops were alfalfa hay and, after 1930, soybeans. Multiplying known rates of symbiotic nitrogen fixation for each crop by its acreage estimates the legume contribution to soil fertility. Seeding contributed a small amount of nitrogen to soils each year, estimated here on the basis of recommended seed application rates in historical agriculture manuals (Hutcheson et al. Reference Hutcheson, Wolfe and Kipps1936). Finally, synthetic fertilizer gained importance in Great Plains agriculture after World War II. US Department of Agriculture data allow crop-based estimates of nitrogen fertilizer application beginning in 1959 (US Department of Agriculture 2013, 2017). The sum of these natural and human-managed vectors represent the total annual nitrogen inputs to agroecosystems.
On the other side of the balance sheet were nitrogen outputs, many of them losses resulting from natural processes. The major human-managed output, of course, was the harvest, which removed nitrogen in the form of grain, hay, and fodder. The estimates used here calculate the nitrogen content of these products, and assume that for grain crops, the stubble and other residues returned to the soil, either directly in the field or as livestock bedding straw mixed with manure. (While farmers sometimes burned off wheat stubble, thus losing its nitrogen content, they more often collected it for livestock bedding or else left it in the ground as a wind erosion prevention.) Hay and fodder crops (like corn and sorghum for silage or forage), by contrast, consumed the entire above-ground portion of the plant, including all its nitrogen content. Census production data multiplied by the nitrogen content of various crops allows an estimate of harvest-based nitrogen outputs from cropland soils.
Because plant-useable nitrogen is volatile, there are a number of natural pathways by which it leaves soil. Agricultural land use could affect these vectors—for example erosion rates—but they were outputs farmers were unaware of or, at least, did not actively manage. Rainfall (and irrigation) leach nitrogen deep into the ground as water trickles through soils, removing it from plants’ root zone. Erosion physically washes away or blows away soil particles, including the nitrogen attached to them. Denitrification is a function of bacterial metabolism—the reverse of fixation—that decomposes plant-available nitrogen into an inert form plants cannot use. And ammonia volatilization is a chemical process by which nitrogen in unstable ammonia escapes into the atmosphere. Scientific studies of these processes make it possible to estimate the amount of natural nitrogen losses based on cropland area (Garcia Ruiz et al. Reference Garcia-Ruiz, Manuel, Gloria, David and Juan2012: 670–75). With the emergence of synthetic N fertilizers from the 1950s, leaching and volatilization increased because as much as half of applied fertilizer never made it into the targeted crop plants.
The sum of all the estimated nitrogen inputs and outputs over a year results in an annual balance, reported here per hectare of cropland (1 hectare = 2.47 acres). If outputs and inputs were equal, then soil nitrogen was in balance, and each new crop year benefitted from the same soil fertility as the previous year, a circumstance that might appear sustainable, at least for this one important agricultural component. When inputs exceeded outputs, soils stockpiled additional nitrogen, building fertility over time, as had been the case for thousands of years before sodbusting. When outputs were higher than inputs, however, the annual nitrogen balance was negative, meaning that next year’s crop inherited less available nitrogen than previously, resulting in soil fertility depletion or “soil mining.” These methods make it possible to track the relative sustainability of soil fertility in one place over an extended period. If applied uniformly, they also allow comparison of soil sustainability from one place to another. This article compares three Kansas counties (figure 1), and this special issue of Social Science History extends the comparison to other locations on either side of the Atlantic.
Nitrogen Flows through a Pioneer Agroecosystem, 1880–1930
Nemaha County, Kansas was the ideal to which nineteenth-century Great Plains settlers aspired. Euro-American pioneers began to make farms there in 1854, but made little headway before the end of the Civil War; by 1875 there were about 10,000 residents who had plowed 12 percent of the land for crops.Footnote 3 The county covers 460,000 acres (186,000 hectares) of low-rolling hills, rich soils, and tallgrass prairie, with woodland along rivers and on steep hillsides. Population density in Nemaha County rose to nearly four people per square mile (10 per km2) by 1889, as the grassland filled with farms and small towns during the first thirty years of agricultural colonization.
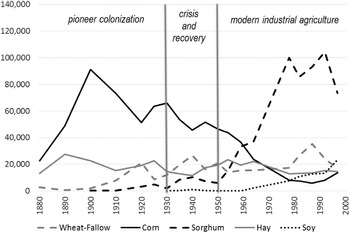
Settlers slowly altered their environment, creating an agricultural mosaic of crop fields, pastures, woodlands, and farm yards, crisscrossed by dirt roads and railway lines. The most ecologically important activities were the plow-up of prairie grasses for cropland and the suppression of landscape fire. In Nemaha County, cropland area rose from 15 percent of all land in the 1870s to 60 percent by 1900. Crop diversity was low (figure 3). In its early years, Nemaha County farmers planted corn on 60–70 percent of cropland and cut native prairie hay on most of the remainder. Cropland was in continuous use, with virtually no fallow. The dominant corn crop provided feed for livestock, and grain surpluses flowed into national markets via railroads. This early agricultural system was highly productive. Rich soil, adequate rainfall, and a plenitude of sunshine fueled crop growth, and farmers’ ingenuity and hard work brought in abundant harvests. By the end of the plow-up, settlers had completely transformed the ecological system on a bit more than half of the region’s land. It was the most dramatic environmental impact of the agricultural occupation. The remaining land, the 40 percent not plowed for crops, did not sit idle. There settlers grazed livestock, mostly beef cattle. Domestic cattle meant fences, rearranged water supplies, fire suppression, and intensified grazing and trampling. In Nemaha County, livestock density rose rapidly during the late nineteenth century, from 4 animals per square mile (11 per km2) in 1875 to 12 (30/km2) by the late 1880s.
Area of major crops (hectares), Nemaha County, Kansas, 1880–1997.

After 1900 crop diversity increased. Hay continued roughly stable and corn remained the dominant crop but declined in area as wheat and sorghum gained ground. By the 1920s, corn still represented about half of cropland, and hay, wheat, and sorghum split the other half.
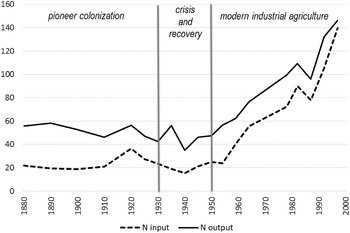
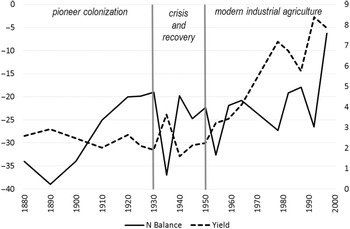
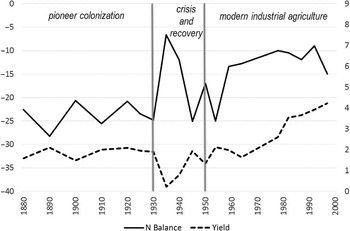
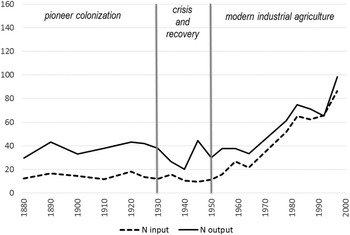
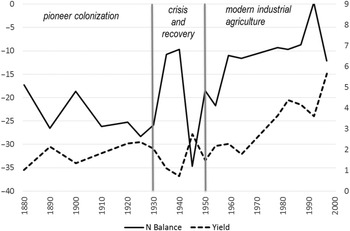
As Nemaha families built new rural communities they depleted soil fertility. Between 1880 and 1910, nitrogen outputs significantly exceeded inputs, creating sharply negative annual nitrogen balances (figure 4). Outputs of 50 to 60 kilograms of nitrogen per hectare were matched by inputs of around 20 kg/ha. For the first several decades of agricultural occupation, Nemaha cropland lost approximately 35 kg of nitrogen per hectare every year. This was a soil mining process, but by world standards crop yields were high (figure 5). Through the 1880s and 1890s gross cropland productivity—the aggregate biomass of all harvested crops—approached 3 tons per hectare. However, by the early 1900s it dropped below 2.5 and in 1930, some 60 years after sod-breaking, yield drifted down to 1.9 tons per hectare. Productivity was still good, but noticeably lower than in the early years.
N inputs and outputs (kilograms per hectare), Nemaha County, Kansas, 1880–1997.

Soil nitrogen balance (kilograms N per hectare on the left axis) and gross crop productivity (tons per hectare on the right axis), Nemaha County, Kansas, 1880–1997.

As yields declined, the gap between nitrogen outputs and inputs narrowed. From 1910 onward, farmers extracted a bit less nitrogen and contributed more than they had done in the late nineteenth century. Annual negative balances continued, but improved steadily after 1890’s low point of –39 kg N/ha. By the 1920s annual balances hovered around –20 kg/ha. Even six decades after initial agricultural colonization, famers mined nitrogen from their soils year in and year out, but more slowly each decade.
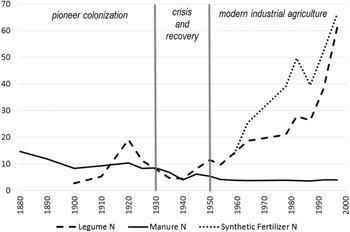
Soil mining is a universal process on agricultural frontiers. Human and livestock populations are typically low in the early years, meaning chronic shortages of labor and limited manure availability. Initially rich land relieved farmers of the necessity of replenishing soil fertility. It is not surprising that Kansas settlers mined soil nitrogen, but nutrient balances reveal the extent of those losses and their duration in the context of the local environment and the contemporary economy, technology, and culture. Why did negative nitrogen balances improve somewhat between 1900 and 1930? Part of the answer lies in the slowly declining yields that were a direct consequence of soil mining. Lower yields also meant lower nitrogen extractions through harvest. The livestock dynamics in Nemaha County did not change much. From initial inputs of about 15 kg nitrogen per hectare, manure contributions dropped to about 10 kg/ha thereafter and remained stable (figure 6). The early decline resulted not from fewer animals, but rather from rapidly increasing cropland area as farmers plowed new sod into the twentieth century. One important addition was alfalfa, a legume hay. Virtually nonexistent in 1890, nitrogen inputs from alfalfa’s symbiotic fixation rose to 20 kg/ha by 1920. Even a decline in the next decade left legume contributions about equal to manure. Through these vectors farmers adjusted toward lower annual nitrogen losses by the end of the pioneer era.
Manure, legume, and synthetic fertilizer inputs (kilograms N per hectare), Nemaha County, Kansas, 1880–1997.

It is tempting to seek conscious adaptation toward soil nitrogen sustainability in these changes, but that is probably not what happened. Even as late as 1930, soil nitrogen content was high compared to other long-farmed regions of the world and yields were quite good, if not as good as 50 years earlier. Rather, these improvements in nitrogen dynamics appear to be a lucky by-product of adaptations to more pressing agricultural problems: shortfalls of soil moisture and horse power. Alfalfa was superb feed for horses and cattle, clearly superior to native hay, and farmers grew it to give their animals a boost of protein along with necessary roughage. That was probably their main incentive to increase legume acreage. And crop diversification was primarily a response to low and unreliable rainfall. Corn is a thirsty crop, prone to failure during drought years; as farmers learned that painful lesson they reduced corn acreage to lower risk in dry times. The crops that replaced it—wheat and sorghum—were more drought-hardy than corn. The fact that they were also less demanding of soil nutrients was a bonus, but probably not the driving consideration. Even after 60 years of soil mining, nutrient maintenance was a small concern and a low priority for farmers struggling to keep farm systems productive and sustainable on multiple fronts.
To the west, in Rooks County, Kansas, agricultural colonization began in the 1870s, two decades later than in Nemaha (Cunfer Reference Cunfer2005; Rooks County Historical Society 1981). Considerably dryer climate reduced cropland productivity compared to Nemaha County, altered farmers’ crop choice, and shifted soil nutrient dynamics, in magnitude if not in kind (Miner Reference Miner1986). As with most American pioneer communities, corn was the first crop settlers planted (figure 7). It was the quintessential American subsistence crop, useful for feeding milk cows, hogs, and chickens that sustained the family, and for feeding horses and mules that powered plow-up. But corn was even more vulnerable to drought and hot, drying winds in Rooks County than in wetter eastern Kansas (Miner Reference Miner2006). Corn was risky and did not become the cash crop here. Corn persisted and even increased in Rooks County as population grew through 1930, but wheat became the dominant grain (Malin Reference Malin1944). Wheat was a valuable cash crop for export by rail; it was also relatively drought resistant and less demanding of soil nutrients compared to corn. By 1910, crop choice had diversified, split three ways between wheat, corn, and hay. Twenty years later sorghum replaced hay, but there were still three significant crops in the county. Until the 1920s there was virtually no fallow land, with all cropland in continuous production.
Area of major crops (hectares), Rooks County, Kansas, 1880–1997.

Nitrogen outputs in Rooks County significantly exceeded inputs throughout the pioneer era (figure 8). Outputs were virtually flat between 1880 and 1930, at about 40 kg N/ha per year, while inputs hovered around 18 kg/ha. The result was an annual soil nitrogen balance of about –24 kg N/ha. This was soil mining, but the magnitude of nitrogen flows was smaller than in wetter Nemaha County. Annual outputs and inputs were each about 8–10 kg N/ha lower than in the east, as was the nitrogen balance (figure 9). Crop yields were also lower in the dry west, at about 2 tons of gross biomass per hectare across all crop types. Such productivity was still quite good, and it remained stable for more than five decades.
N inputs and outputs (kilograms per hectare), Rooks County, Kansas, 1880–1997.

Soil nitrogen balance (kilograms N per hectare on the left axis) and gross crop productivity (tons per hectare on the right axis), Rooks County, Kansas, 1880–1997.

Initial soil nitrogen content was even richer in Rooks County than in Nemaha County, around 11 tons N/ha. But farmers there did not narrow the gap between nitrogen outputs and inputs as happened in Nemaha. Nitrogen balances in Rooks County were about –23 kg/ha in the 1880s, and remained at –25 kg/ha in 1930. Here there was no evidence of soil nutrient adaptation, whether intentional or incidental, through half a century of agricultural colonization. The county started at a somewhat higher level, mined soils at a slower pace, and as late as 1930 had not yet depleted soil fertility enough to reduce yields or prompt significant adjustments. Farmers applied what manure they had available, but took no other action to address soil fertility, neither planting legumes nor rotating fallow. Even with significantly reduced soil nitrogen by 1930, there was still enough available to support abundant wheat harvests each year, if rainfall was sufficient.
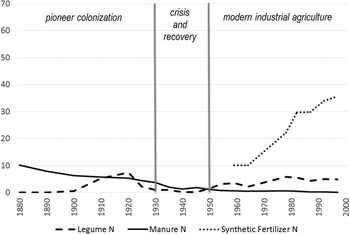
Manure availability declined throughout the era, dropping from about 10 kg N/ha in 1880 to below 4 kg/ha in 1930, by which time the transition from horse power to tractors was well under way (figure 10) (Cunfer Reference Cunfer2005; Fitzgerald Reference Fitzgerald2003). A brief introduction of alfalfa brought a legume crop to Rooks County between 1900 and 1925. For a decade legume nitrogen contributions matched declining inputs from manure, but then fell away again by 1930 and were never more than a small component of Rooks County’s nitrogen equation.
Manure, legume, and synthetic fertilizer inputs (kilograms N per hectare), Rooks County, Kansas, 1880–1997.

Crisis and Recovery, 1930–50
By 1930 the pioneer era of agricultural colonization on the Great Plains was complete. Nearly all land that would ever be plowed was already in cropland, and population peaked in many places in the 1920s (Cunfer Reference Cunfer2005; Sylvester et al. Reference Sylvester, Myron and Brown2016). Extensification drew to a close by 1930. Intensification, however, gathered speed after 1950 and accelerated through the second half of the twentieth century (Cunfer et al. Reference Cunfer, Andrew and Joshua2018). But between those years were two decades of crisis, turmoil, and recovery in the grasslands. The decade-long Dust Bowl drought that began in 1932 is well known. Accompanied by high temperatures that evaporated scarce soil moisture, the weather downturn caused repeated crop failures and wind erosion, from routine field-level blowing to massive dust storms that tracked across the continent. These environmental conditions caused bankruptcy, land abandonment, and emigration (Egan Reference Egan2006; Hurt Reference Hurt1981; Worster Reference Worster1979). The environmental crisis coincided with an international economic collapse, the Great Depression. That combination of regional disaster and global depression hit plains residents hard. It also opened a political opportunity for revolutionary changes in the US agricultural economy.
For the first time in American history the federal government took an active role in managing the farm economy, and even made a limited (and ultimately incomplete) effort to direct land use (Duffin Reference Duffin2007; Gregg Reference Gregg2010; Kirkendall Reference Kirkendall1966). Beginning in 1933, new federal government agencies offered farmers annual commodity subsidies (Agricultural Adjustment Administration), price controls (Commodity Credit Corporation), low-cost credit (Farm Credit Administration), and occasional compensation for crop failures (Cunfer Reference Cunfer2005; Grant Reference Grant2002). The New Deal agencies resettled some farmers, converted some cropland to pasture, and attempted to manage annual production through land set-aside programs (Maher Reference Maher2008; Phillips Reference Phillips2007). Beginning as emergency relief programs designed to keep farmers from starving or losing their land, they evolved into economic recovery programs and, by the late 1940s, became permanent components of the nation’s agricultural economy (Danbom Reference Danbom1995). Fixed in outline, if constantly tweaked and adjusted by Congress, federal agencies created a reliable safety net that by turns raised farm incomes, brought urban standards of living to rural places, increased farm sizes, and depopulated small communities (Hurt Reference Hurt2011).
World War II demand for food and fiber coincided with the end of the long drought in 1941. Both events made the 1940s a time of rebuilding from the deep losses of the Depression. Farmers reinvested in their properties, rebuilt livestock herds, and became prosperous again (Grant Reference Grant2002; Hurt Reference Hurt2011). The two decades between 1930 and 1950 were a topsy-turvy time for plains farmers on almost every count, from weather to environment to economy to politics to society. The disruptions of the period affected soil nutrient dynamics in a variety of ways, causing marked fluctuations in nitrogen indicators. For example, drought-induced crop failure in 1935 and 1940 in Rooks County dramatically reduced yields and thus harvest-related nitrogen outputs, spiking the nitrogen balance dramatically upward (figure 9).
Early in the 1930s, livestock populations collapsed in many plains communities (Cunfer Reference Cunfer2001). When hay and fodder crops failed and pasture grasses dried up, livestock faced starvation. Farmers sold or slaughtered cattle by the millions because they could not feed them. The federal Drought Relief Service paid farmers a few dollars per head for emaciated cattle and simply buried their carcasses in trenches (Worster Reference Worster1979). One consequence of livestock reduction was lower manure nitrogen inputs to soils in subsequent years. In many places cattle herds did not recover for a decade or more. As manure contributions fell, legumes could not make up the difference. Both alfalfa and recently introduced soybeans—the two significant plains legume crops—needed considerable soil moisture to thrive. The drought hit legume crops hard, and farmers planted fewer of them during the 1930s, then increased acreage again in the 1940s (figures 6 and 10). By 1941 rains finally returned, but it took the rest of the decade to rebuild agroecosystems and rural society. Farmers restocked pastures, replanted legume crops, began to invest in synthetic N fertilizers, and developed new irrigation systems. Crisis and catharsis led on to recovery and restoration. By the end of the 1940s the Great Plains was poised for a dramatically new direction. Grassland agriculture would look very different after 1950 than it had before 1930.
The Socioecological Transition to Modern Industrial Agriculture, 1950–97
Beginning about 1950, and continuing through the end of the twentieth century, farming underwent a “socioecological transition” (Cunfer et al. Reference Cunfer, Andrew and Joshua2018; Fischer-Kowalski and Haberl Reference Fischer-Kowalski and Helmut2007). This change encompassed soil nutrient management, energy, machinery, pest control, seed breeding, landscape structure, rural demography, and economics. A restructuring of the biophysical basis of agriculture revolutionized the fundamental relationship between people and nature in agroecosystems (González de Molina and Toledo Reference Gonzalez de Molina and Toledo2014). While this transformation affected multiple components of agriculture, soil fertility serves as a representative indicator of sustainability. How did farmers restructure nitrogen outputs and inputs as this rural revolution took off and accelerated during the second half of the twentieth century?
In 1950, Great Plains soils remained nutrient-rich, though 70+ years of soil mining left nitrogen contents far below their initial levels (Haas et al. Reference Haas, Evans and Miles1957). With sufficient rain, farmers produced yields of around 2 tons per hectare—only slightly lower than the bumper crops of the late nineteenth century and still quite reasonable. But new technology was about to change the nitrogen equation for farmers. In 1909, German chemist Fritz Haber discovered how to synthesize ammonia and soon thereafter engineer Carl Bosch manufactured it at industrial scales (Smil Reference Smil2001). The technology depended on fossil fuels to supply both the raw material of nitrogen fertilizer and the high temperatures and pressures required to produce necessary chemical reactions. For the first time, people could fix nitrogen in a plant-useable form; previously only lightning and a handful of bacteria species could do so. Now human beings intervened in the global nitrogen cycle, with dramatic consequences. With the onset of World War I, synthetic nitrogen fixation first fed the munitions industry, not agriculture, generating ammonia for high explosives. The disruptions of the early twentieth century—economic Depression and another world war—delayed full deployment of ammonia synthesis for fertilizer use. But by the late 1940s, low cost and highly effective fertilizer products began to spread through the US agricultural economy, not least in the Great Plains (Cunfer Reference Cunfer2004; Duffin Reference Duffin2007).
Data from the US Department of Agriculture make it possible to track fertilizer use beginning in 1959 (US Department of Agriculture 2013, 2017). By then Nemaha County farmers were already applying an average of 15 kg N/ha on their cropland, matching legume inputs and tripling contributions from manure (figure 6). Fertilizer use skyrocketed thereafter, climbing nearly every year for the next 40 years. By the end of the century Nemaha County farmers applied 65 kg N/ha to their land, nearly triple their total nitrogen inputs in 1880. Legume contributions rose in tandem, primarily from expanding acreages of soybeans, but also from alfalfa. Combined, nitrogen inputs nearly quintupled, from 30 kg N/ha in 1950 to 145 kg/ha in 1997 (figure 4). Never in history had farmers been able to deliver nutrients to their crops in these quantities—it was truly revolutionary.
Nitrogen outputs rose in tandem with inputs, primarily due to dramatically increased crop yields plus losses from synthetic fertilizer that leached or volatilized N into the environment (figure 4). By 1997, Nemaha croplands that had done well to produce 3 tons per hectare a century earlier were producing more than 8 tons/ha of total crop biomass (figure 5). The gap between nitrogen outputs and inputs narrowed and then disappeared. Soil nitrogen balances remained negative, but ever less so, and in the 1990s approached positive territory for the first time in 150 years of agricultural occupation (figure 5). In 1997, farmers harvested 8 tons per hectare in all crops combined and still managed to supply virtually as much nitrogen as they extracted, in roughly equal parts from synthetic fertilizer and legumes (figure 6). From one point of view they had achieved a level of soil nutrient sustainability never before accomplished. From another perspective, they did this by decoupling themselves from any real reliance on soil fertility at all. Rather, they delivered plant nutrients directly as fertilizer or legume residue, then harvested those nutrients in marketable form later in the year, all but bypassing the soil.
In dry Rooks County synthetic fertilizer inputs were 10 kg N/ha in 1959, a third lower than in Nemaha County because of the smaller nutrient demands of wheat compared to corn (figure 10). The late-twentieth-century increase in fertilizer application was dramatic, but only reached 35 kg N/ha in 1997, just more than half the level in Nemaha. Legumes remained unimportant in the county, unlike in the east. Total nitrogen inputs quintupled, from 10 kg N/ha in 1950 to 50 kg/ha in 1997, but never approached the dizzying heights of the 145 kg/ha in Nemaha County (figure 8). Even in the fertilizer era, dry central Kansas was no match for the gross biomass productivity of wetter eastern Kansas. Still, the transformation was remarkable. Yields of all crops combined rose from 1.3 tons per hectare to more than 4 during the half century, and the gap between nitrogen outputs and inputs narrowed, but did not close (figures 8 and 9). Annual nitrogen balances, that had hovered around –24 kg N/ha prior to 1930, moved into a range between –15 and –10 kg/ha after 1959 (figure 9). Soil mining continued, but at a slower pace.
One more comparison bears scrutiny. South of Rooks County lies Pawnee County, Kansas, in the same semiarid rainfall zone. Farmers there had a virtually identical land use and soil nutrient history as Rooks between 1880 and 1930. Initial settlers grew corn, but wheat quickly dominated (figure 11). Between 1910 and the early 1950s, sorghum increased as a drought-resistant alternative grain that could feed livestock in place of corn.
Area of major crops (hectares), Pawnee County, Kansas, 1880–1997.

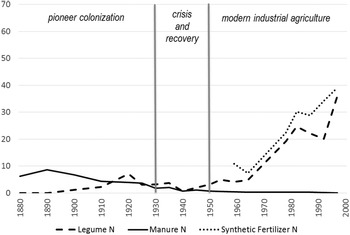
But there were some noticeable differences between the two western Kansas counties in their soil fertility dynamics. First, legume nitrogen contributions rose alongside fertilizer inputs after 1959, much like in wetter Nemaha County, and in clear contrast to similarly dry Rooks County (figure 12). Nitrogen outputs and inputs rose through the second half of the twentieth century and the gap between them narrowed (figure 13). As in Nemaha County (but not in Rooks), Pawnee County’s soil nitrogen balance closed the gap and moved briefly toward positive territory for the first time in the 1990s (figure 14). Nitrogen outputs and inputs rose quickly, not as high as in Nemaha but still to levels some 40 percent higher than those in nearby Rooks County. Yields spiked too, up to nearly 6 tons per hectare in the 1990s, when Rooks could only muster 4 tons/ha. Why did Pawnee County’s nitrogen profile look more like Rooks County before 1930 but more like Nemaha County after 1950? How did Pawnee County outperform Rooks so noticeably through the late-twentieth-century socioecological transition, when they shared virtually identical climate and soil conditions and had been so similar before?
Manure, legume, and synthetic fertilizer N inputs (kilograms N per hectare), Pawnee County, Kansas, 1880–1997.

N inputs and outputs (kilograms per hectare), Pawnee County, Kansas, 1880–1997.

Soil nitrogen balance (kilograms N per hectare on the left axis) and gross crop productivity (tons per hectare on the right axis), Pawnee County, Kansas, 1880–1997.

The answer relates to another form of intensification that emerged after 1950 in selected parts of the Great Plains: irrigation (Green Reference Green1973; Opie Reference Opie1993; Watson Reference Watson2020). Rooks County remained a dryland crop area right through the twentieth century, without significant access to either surface water from nearby rivers or to groundwater from aquifers. Pawnee County farmers, however, developed irrigation from river-associated shallow aquifers after 1950, when they irrigated fewer than 3,800 acres (1,500 hectares). In 1978 farmers irrigated 57,000 acres (23,000 hectares); by 1997 it was 70,000 (28,000 hectares). Rooks County, in the latter year, irrigated only 1,700 acres (670 hectares). Irrigating farmers in Pawnee County spread their water across several crops, including corn, alfalfa, soybeans, and wheat (US Department of Agriculture 1978). One consequence of irrigation was an increase in legumes; another was crop diversification. Corn and soybeans area rose from near 0 to 25,000 acres (10,000 hectares) each, virtually all of it irrigated, and hay also increased in area. In the meantime, wheat acreage fell. Irrigation allowed farmers to reduce wheat monoculture and diversify. Irrigation also raised crop yields and reduced the risk of crop failure during droughts. But applying water to cropland subsequently required higher inputs of synthetic nitrogen fertilizer because the extra water running through soils increased leaching (Cunfer Reference Cunfer2005). Irrigated land had higher nitrogen losses and therefore needed higher nitrogen inputs compared to dry cropland. The advent of irrigation explains why Pawnee and Rooks Counties diverged after 1950, despite tracking one another closely during the previous 70 years.
Conclusion
Material flow analysis disentangles the nitrogen dynamics of historical agroecosystems and reveals three phases of agriculture’s twentieth-century socioecological transition. During pioneer colonization, Great Plains productivity increased through spatial expansion. As farmers plowed ever more land between 1870 and 1930, they tapped into rich soil fertility and mined nitrogen to create abundant harvests that fed population growth in industrializing American cities and across the Atlantic (Cunfer Reference Cunfer2004, Reference Cunfer2005). But by 1930 settlers were cultivating virtually all the region’s arable land (Sylvester et al. Reference Sylvester, Myron and Brown2016). After two decades of environmental and economic crisis-and-recovery, a distinctly different era began. From 1950 through the end of the twentieth century, farmers fundamentally changed their ability to manage soil fertility, with stunning results. Rather than extend into new land, they now intensified by investing in synthetic fertilizer, pesticides, hybrid seeds, machine horsepower, and irrigation. Such inputs made farming ever more capital intensive and often depended on extended credit lines and government subsidies. They required increased financial and business management skills, technical training, and access to outside expertise. But much higher productivity and, thus, profitability, offset those considerable costs. Only after the 1940s did rural standards of living and consumption match those of urban families in the United States. Crop yields doubled and then doubled again, even as cropland area remained stable or declined slightly. At its base, agricultural intensification depended on an energy regime change that defined this socioecological transition to modern industrial agriculture (Cunfer et al. Reference Cunfer, Andrew and Joshua2018; Gingrich et al. Reference Gingrich, Ines, Eduardo, Roc, Claudio, Geoff, Guzmán Casado, Joshua and Andrew2018). The advent of fossil fuels or, more precisely, petroleum and natural gas, enabled each of the intensification processes. Synthetic nitrogen fertilizer depends on natural gas for its feed stock and to fuel the high-temperature and high-pressure conditions necessary for its manufacture (Smil Reference Smil2001). Diesel fuel drove farmers’ machinery, natural gas powered their irrigation pumps, and petroleum served as the raw material for pesticides. Ultimately, the revolution in agroecosystem nitrogen processes depended on ever more fossil fuel energy inputs into farming (US Department of Agriculture 1960, 1980).
While all American agriculture moved through the socioecological transition in the second half of the twentieth century, the three case studies described here reveal noticeable spatial variation. Despite stereotypes about the uniformity of Great Plains landscapes, considerable environmental diversity exists, even within the range of a few hundred miles (Gutmann et al. Reference Gutmann, Parton, Geoff and Burke2005). Local farmers adapted and conformed their land use to fit environmental parameters of weather, soil conditions, and, eventually, groundwater. In the case of nitrogen balances, the variation was primarily in magnitude, less so in kind, and ultimately depended on soil moisture: rainfall before 1950 and a combination of rainfall and irrigation thereafter. The socioecological transition brought a slow reduction in soil nutrient mining, but only after significant declines in total soil nitrogen content through more than a hundred years. By the end of the twentieth century, farmers had nearly ceased extracting nitrogen from soil stockpiles, and instead employed synthetic fertilizers or last year’s legumes to meet crop needs. Furthermore, the socioecological transition is ongoing. As of 1997, increases in nitrogen inputs and outputs, fertilizer applications, and crop yields continued climbing and showed little indication of leveling out to a new equilibrium.
A serious assessment of “sustainability” requires a rigorous definition of the term and a systematic way to measure the relative sustainability of multiple agroecosystems across the globe and through time. Many components of farm systems require consideration, including energy, water, and biodiversity, as well as soil nutrients (Gonzalez de Molina and Toledo Reference Gonzalez de Molina and Toledo2014). Soil nutrient balances are but one method for addressing a single component of sustainability, though an important one. Great Plains farmers, for most of the past century and a half, did not practice sustainable agriculture from a soil nutrient point of view. Instead they extracted more nitrogen each year than they replaced, relying on rich original stockpiles of fertility that they slowly depleted. This is not surprising in the context of agricultural colonization of new lands—it is probably universal when farmers occupy fresh ground, given competing environmental pressures and perennial shortages of labor and livestock on frontiers. More surprising, perhaps, is the long duration of soil mining. That Great Plains farmers could persist in soil depletion for more than a century is testament to the original richness of grassland soils and to the restraining nature of a semiarid climate that limited harvests and reduced natural pathways of nitrogen loss. Unsustainability can persist for a very long time in certain circumstances.
Also evident from this example is the complexity of any serious sustainability assessment. Farmers managed multiple competing agroecosystem components at once: subsistence food supply, animal labor and feed, soil fertility, soil moisture, energy flows, biodiversity, pests, economic viability, family labor and nurture, community needs—the list is endless. In the Great Plains, managing soil moisture was almost always more urgent than managing soil fertility (Miner Reference Miner1986, Reference Miner2006). The former was often insufficient, the latter abundant. Balancing all these sustainability challenges required prioritization and trade-offs.
A few examples suffice. In the early twentieth century, wheat farmers developed a two-year rotation designed to stockpile two years’ worth of rainfall to grow one wheat crop (Hargreaves Reference Hargreaves1957, Reference Hargreaves1993). The wheat-fallow rotation improved the sustainability of wheat farming from a water and an economic point of view, but it required about half of all wheat land to remain both unproductive and bare throughout the growing season. The wheat-fallow rotation prevailed in Rooks County, Kansas through the second half of the twentieth century. Several passes over fallow with the cultivator to supress weeds accelerated nitrogen losses and exacerbated wind erosion, even while conserving water (Kansas State Board of Agriculture 1937). Thus adjustments to solve soil moisture sustainability were detrimental to soil nutrient and erosion sustainability. Later in the twentieth century, no-till techniques significantly reduced soil erosion, nitrogen loss, and energy costs on wheat land, but only by means of a significant increase in herbicide use to suppress weeds (Montgomery Reference Montgomery2007). In another example, converting from horse power to tractor power, as nearly all Great Plains farmers did between 1915 and 1935, had myriad consequences for sustainability: more fossil fuel energy inputs, less livestock feed, less manure, less family or hired labor, and greater cash flow demands to meet loan payments (Cunfer Reference Cunfer2005). Addressing one pressing sustainability challenge often meant undermining another.
Farmers changed their nitrogen management as they reduced or increased livestock numbers (and consequently their manure supply), grew more or fewer legumes, applied fertilizer, and adopted irrigation. None of those choices were purely about soil nutrient management, and yet each of them affected nitrogen processes profoundly. The key change in soil fertility management—the adoption of synthetic fertilizer—shifted the sustainability equation to a broader spatial scale. Farmers solved their local unsustainable soil nutrient management by importing fossil fuel energy from distant sources. The solution to a local soil sustainability challenge created a broader, global energy sustainability challenge. Every adjustment had multiple consequences. Agriculture was constantly in flux as farmers responded to urgent problems or emergent opportunities, then worked to balance out all of the consequent ripples that followed.
If sustainability means stability, that is, finding a land use equilibrium and then maintaining it through generations and centuries, where are the examples from history? Has it ever been done? Tracing the nitrogen sustainability of Great Plains agroecosystems suggests constant, ongoing, incremental adaptation and adjustment, plus occasional revolutionary reconfiguration. From a soil nutrient perspective there was never stability for more than a couple of decades. Each generation of farmers lived through at least one or two significant alterations of soil nitrogen management. Even within the three phases identified in this narrative, internal change was always present. Perhaps the Great Plains is too new, too recently colonized, to serve as an adequate study of agricultural sustainability. Other articles in this special issue of Social Science History address a variety of agroecosystems in Europe and North America, some in which farm production stretches back centuries. The methods employed here are applicable anywhere in the world where primary historical sources describe agricultural land use in some detail. How did soil nitrogen management play out in agroecosystems already several centuries beyond their initial colonization? Where can we find examples of “traditional agriculture” that were truly sustainable over long stretches of time? Or do we need to reconsider what sustainability means in the context of farming?
Appendix
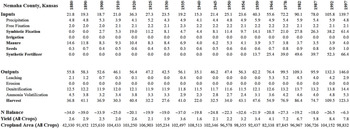
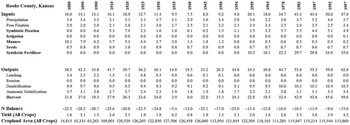
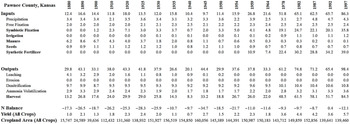
For each of the three case study counties in Kansas, the appendix presents the key nitrogen input and output flows at 19 time points between 1880 and 1997, corresponding with the years of the US Census of Agriculture. Primarily natural N flows are in standard font, while human-managed N flows are in bold, corresponding with figure 2. N flows and the N balance are reported in kilograms per hectare (kg/ha) of land in crops, as presented in figures 3–14. These flows are estimated using methods outlined in Garcia-Ruiz et al. (Reference Garcia-Ruiz, Manuel, Gloria, David and Juan2012), based on agricultural characteristics reported in the Agricultural Censuses, such as area of land in various crops, number of livestock, amount of irrigation and fertilizer, and so forth. Cropland area (hectares) and gross crop yields (tons per hectare) are based on the same source. Other articles in this special issue of Social Science History provide further information about the soil nutrient system and the nitrogen flow estimation methods employed here. Note that erosion values appear as 0 in all years, because there is no good historical source for estimating wind erosion. Given the low rainfall and generally level topography, water erosion was not a large factor in Great Plains agriculture. Wind erosion was more important, but the county scale employed in this analysis minimizes its impact on soil nutrient analyses. Most wind-eroded soils move very short distances across fields. While some N attached to soil particles erodes away from soil surfaces, it usually lands on other, nearby soil surfaces, minimizing the net change at a county scale. Wind erosion may alter the N balance slightly in some years, but has a relatively minor impact compared to other N flows that are more easily estimated.
Figure A1.

Figure A2.

Figure A3.