1. Introduction
A typical data science project can be crudely simplified into the following steps: (i) comprehending the problem context, (ii) understanding the data, (iii) preparing the data, (iv) modeling, (v) evaluating the model, and (vi) deploying the model [Reference Wirth and Hipp19]. Before deploying a new model, it should be tested to determine whether it meets certain predefined outcome criteria. A baseline plays an essential role in this evaluation, as it gives an indication of the actual performance of a model.
However, which method should be selected to construct a baseline? A good baseline is desirable, but what explicitly makes a baseline ‘good’? Comparing results with the latest state-of-the-art model is usually insightful. However, being state-of-the-art is dynamic as newer models are continuously developed. The reproducibility of such a model is also often a problem because code is not published or large amounts of computational resources are required to retrain the model. Furthermore, most existing baselines are stochastic and need to be computed repeatedly to get a reliable expected performance, which could be computationally expensive. These aspects make comparing older results with newer research hard or even impossible. Nevertheless, it is important to stress that the comparison with a state-of-the-art model still has merit. However, we are pleading for an additional universal baseline that can be computed quickly (without the need for training) and can make it possible to compare results across research domains and papers. With that aim in mind, we outline three principal properties that any universal baseline construction method should have: generality, simplicity, and informativeness.
-
Generality In research, a new model is commonly compared to a limited number of existing models used in the same field. Although these are usually carefully selected, they are still subjectively chosen. Take binary classification, in which the objective is to label each observation as either zero or one. Here, we could already select a decision tree [Reference Min and Jeong10], random forest [Reference Couronné, Probst and Boulesteix5], variants of naive Bayes [Reference Wang and Manning18], k-nearest neighbors [Reference Araújo, de, Oliveira and Meira1], support vector machine [Reference Shahraki, Pourahmad and Zare16], neural network [Reference Sundarkumar and Ravi17], or logistic regression model [Reference Sergioli, Giuntini and Freytes15] to evaluate the performance. These models are often trained specifically for a problem instance with parameters tuned for optimal performance in that specific case. Hence, these methods are not general. We could not take a decision tree used for determining bankruptcy [Reference Min and Jeong10] and use it as a baseline for a pathological voice detection problem [Reference Muhammad and Melhem11]; at least structural adaptations and retraining are necessary. A good standard baseline should be applicable to all binary classification problems, irrespective of the domain.
-
Simplicity A universal baseline should not be too complex. Unfortunately, it is hard to determine whether a baseline is too complex for a measure. Essentially, two components are critical in our view: computational time and explainability. For practical applications, the baseline should be determined relatively quickly. For example, training a neural network many times to generate an average baseline or optimizing the parameters of a certain model could take too much valuable time. Secondly, if a baseline is very complex, it can be harder to draw meaningful conclusions. Is this ingeniously complicated baseline expected to outperform a new model, or is it exactly what we would expect? This leads to the last property of a good standard baseline.
-
Informativeness A baseline should also be informative. When a method achieves a score higher or lower than the baseline, clear conclusions need to be drawn. Is it obvious that the baseline should be beaten? Consider the athletic event high jump, where an athlete needs to jump over a bar at a specific height. If the bar is set too low, anyone can jump over it. If the bar is too high, no one makes it. Neither situation gives us additional information to distinguish a professional athlete from a regular amateur. The bar should be placed at a height where the professional could obviously beat it, but the amateur cannot. Drawing from this analogy, a baseline should be beaten by any developed model. If not, this should be considered a major warning sign.
Our research focuses on finding a general, simple, and informative baseline for binary classification problems. Although we focus on these types of problems, the three properties should also hold for constructing baselines in other supervised learning problems, such as multiclass classification and regression. Two methods that immediately come to mind are dummy classifiers and optimal threshold classifiers. They could be ideal candidates for our additional universal baseline.
-
Dummy classifier A dummy classifier is a non-learning model that makes predictions following a simple set of rules. For example, always predicting the most frequent class label, or predicting each class with some probability. A dummy classifier is simple and general but not always informative. The information gained by performing better than a simple dummy classifier can be zero. With the plethora of dummy classifiers, the selection of one of those classifiers is also arbitrary and questionable.
-
Optimal threshold classifier For a large family of binary performance measures, [Reference Koyejo, Natarajan, Ravikumar and Dhillon7] determined that the optimal classifier consists of a sign function with a threshold tailored to each specific measure. To determine the optimal classifier, it is necessary to know or approximate
 $\mathbb{P}(Y=1\mid X=x)$
, which is the probability that the binary label Y is ‘1’ given the features
$X=x$
. [Reference Lipton, Elkan, Naryanaswamy, Calders, Esposito, Hüllermeier, Meo and Springer8] had a similar approach, but only focused on the
$F_1$
score. The conditional probabilities need to be learned from training data. However, this leads to arbitrary selections, as a model is necessary to approximate these probabilities. It is a clever approach, but unfortunately there is no clear-cut best approximation model for different research domains. If the approximation model is not accurate, the optimal classifier is based on wrong information, which makes it hard to draw meaningful conclusions from this approach.



Both the dummy and optimal threshold classifiers have their strengths and weaknesses. This paper introduces a novel baseline approach called the Dutch Draw (DD), which eliminates these weaknesses while keeping the strengths. The DD can be seen as a dummy classifier on steroids. Instead of arbitrarily choosing a dummy classifier, we mathematically derive which classifier has the best expected performance from a family of classifiers. Also, this expected performance can be directly determined, making it very fast to obtain the baseline. The DD baseline is:
-
applicable to any binary classification problem;
-
reproducible;
-
simple;
-
parameter-free;
-
more informative than any single dummy baseline;
-
an explainable minimal requirement for any new model.
This makes the DD an ideal candidate for a universal baseline in binary classification.
Our contributions are as follows:
-
We introduce the DD and explain why this method produces a universal baseline that is general, simple, and informative for any binary classification problem.
-
We provide the mathematical properties of the DD for many evaluation measures, and summarize them in several tables.
-
We demonstrate the usefulness of the DD baseline and how it can be used in practice to identify when models should definitely be reconsidered.
-
We have made the DD available in a Python package (https://github.com/joris-pries/DutchDraw).
2. Preliminaries
Before formulating the DD, we need to introduce the necessary notation and simultaneously provide elementary information on binary classification. This is required to explain how binary models are evaluated. Then, we discuss how evaluation measures are constructed for binary classification and examine the most commonly used ones.
2.1. Binary classification
The goal of binary classification is to learn (from a dataset) the relationship between the input variables and the binary output variable. When the dataset consists of
 $M \in \mathbb{N}_{\gt0}$
observations, let
 $\mathcal{M} \,:\!=\, \{1, \dots, M\}$
be the set of observation indices. Each instance, denoted by
 $\mathbf{x}_i$
, has
 $K \in \mathbb{N}_{\gt0}$
explanatory feature values. These features can be categorical or numerical. Without loss of generality, we assume that
 $\mathbf{x}_i \in \mathbb{R}^K$
for all
 $i \in \mathcal{M}$
. Moreover, each observation has a corresponding output value
 $y_i \in \{0,1\}$
. Now, let
 $\mathbf{X}\,:\!=\, [\mathbf{x}_1\ \cdots\ \mathbf{x}_M]^\top \in \mathbb{R}^{M \times K}$
denote the matrix with all observations and their explanatory feature values, and let
 $\mathbf{y} = (y_1, \dots, y_M)\in \{0,1\}^M$
be the response vector. The complete dataset is then represented by
 $(\mathbf{X}, \mathbf{y})$
. We call the observations with response value 1 ‘positive’, while the observations with response value 0 are ‘negative’. Let P denote the number of positives and N the number of negatives. Note that, by definition,
 $P + N = M$
must hold.
2.2. Evaluation measures
An evaluation measure quantifies the prediction performance of a trained model. We categorize the evaluation measures into two groups: base measures and performance metrics [Reference Canbek, Sagiroglu, Temizel and Baykal3]. Since there are two possible values for both the predicted and the true classes in binary classification, there are four base measures: the number of true positives (TP), false positives (FP), false negatives (FN), and true negatives (TN). Performance metrics are a function of one or more of those four base measures. To shorten the notation, let
 $\hat{P} \,:\!=\, \textrm{TP} + \textrm{FP}$
and
 $\hat{N} \,:\!=\, \textrm{TN} + \textrm{FN}$
denote the number of positively and negatively predicted instances, respectively.
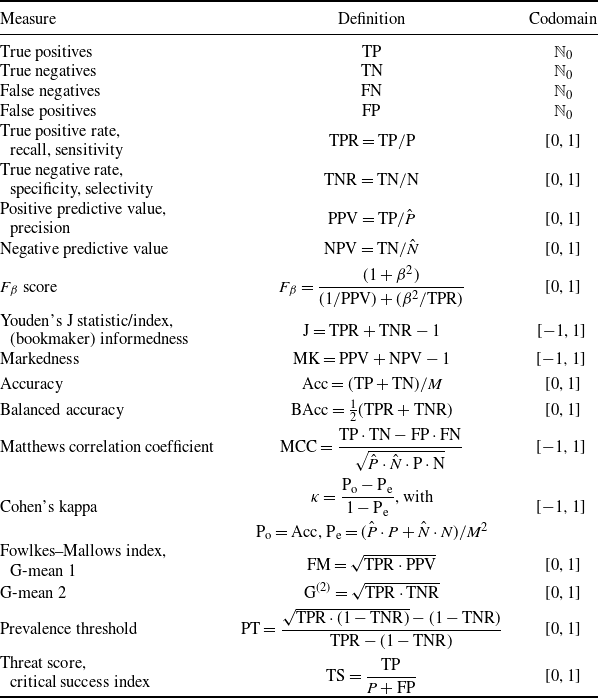
All the base measures and performance metrics considered are shown in Table 1 along with their abbreviations, possible alternative names, definitions, and corresponding codomains. The codomains show in what set the measure can theoretically take values (without considering the exact values of P, N,
 $\hat{P}$
and
 $\hat{N}$
). In Section 3, the case-specific codomains are provided when we discuss the evaluation measures in more detail. Some performance metrics, such as the false negative rate (FNR) and false discovery rate (FDR), are omitted, as they can easily be derived from the results of other measures. Finally, note that the list is not exhaustive but contains most of the commonly used evaluation measures.
Definitions and codomains of evaluation measures.

2.2.1. Ill-defined measures
Not every evaluation measure is well-defined. Often, the problem occurs due to division by zero. For example, the true positive rate (TPR) defined as
 $\textrm{TPR} = \textrm{TP}/P$
cannot be calculated whenever
 $P=0$
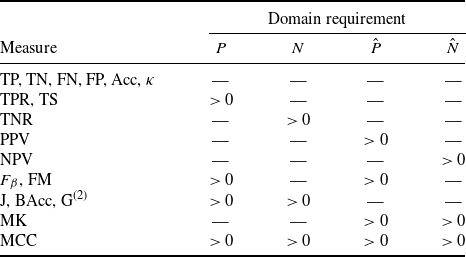
. Therefore, we have made assumptions for the allowed values of P, N,
 $\hat{P}$
, and
 $\hat{N}$
. These are shown in Table 2. One exception is the prevalence threshold (PT) [Reference Balayla2], where the denominator is zero if TPR is equal to the false positive rate (defined as
 $\textrm{FPR} = \textrm{FP}/N$
). Depending on the classifier, this situation could occur regularly. Therefore, PT is omitted throughout the rest of this research.
Assumptions on domains P, N,
 $\hat{P}$
and
 $\hat{N}$
. Some measures are not defined if P, N,
 $\hat{P}$
, or
 $\hat{N}$
is equal to zero. These domain requirements are therefore necessary (
 $M \gt 0$
always).

3. Dutch Draw
In this section, we introduce the DD framework and discuss how this method is able to provide a universal baseline for any evaluation measure. This baseline is general, simple, and informative, which is crucial for a good baseline, as we explained in Section 1. First, we provide the family of DD classifiers and thereafter explain how the optimal classifier generates the baseline.
3.1. Dutch Draw classifiers
Our research aims to provide a universal baseline for any evaluation measure in binary classification. The DD baseline comes from choosing the best DD classifier. Before discussing what ‘best’ entails, we have to define the DD classifier in general. This classifier generates the predictions for observations by outputting a vector of M random binary values. It is described in words as:
 \begin{align*} \sigma_{\theta}(M) & \,:\!=\, \{\textrm{Take a random subset of $\mathcal{M}$ of size $\lfloor M\cdot\theta\rceil$ without replacement;} \\ & \qquad \textrm{assign 1 to these observations and 0 to the remaining}\}.\end{align*}
Here,
 $\lfloor \cdot \rceil$
is the function that rounds its argument to the nearest integer. The parameter
 $\theta \in [0,1]$
controls the percentage of observations predicted as positive. The mathematical definition of
 $\sigma_{\theta}$
is
 $\sigma_{\theta}(M) \,:\!=\, (\mathbf{1}_{E}(i))_{i\in\mathcal{M}}$
with
 $E\subseteq\mathcal{M}$
uniformly drawn such that
 $|E| = \lfloor M\cdot\theta \rceil$
, with
 $(\mathbf{1}_{E}(i))_{i\in\mathcal{M}}$
the vector with ones in the positions in E and zeros elsewhere. Note that a classifier
 $\sigma_{\theta}$
does not learn from the features in the data, just as a dummy classifier. The set of all DD classifiers
 $\{\sigma_{\theta}\colon\theta\in[0,1]\}$
is the complete family of models that classify a random sample of any size as positive.
Given a DD classifier, the number of predicted positives
 $\hat{P}$
depends on
 $\theta$
and is given by
 $\hat{P}_{\theta} \,:\!=\, \lfloor M\cdot\theta \rceil$
; the number of predicted negatives is
 $\hat{N}_{\theta} \,:\!=\, M - \lfloor M\cdot\theta \rceil$
. Specifically, these two numbers are integers; thus, different values of
 $\theta$
can lead to the same value of
 $\hat{P}_{\theta}$
. Therefore, we introduce the parameter
 $\theta^* \,:\!=\, {\lfloor M\cdot\theta \rceil}/{M}$
as the discretized version of
 $\theta$
. Furthermore, we define
 \begin{align*} \Theta^* \,:\!=\, \bigg\{\frac{\lfloor M\cdot\theta \rceil}{M}\colon\theta\in[0,1]\bigg\} = \bigg\{0, \frac{1}{M}, \dots, \frac{M-1}{M}, 1\bigg\}\end{align*}
as the set of all unique values that
 $\theta^*$
can obtain for all
 $\theta \in [0,1]$
.
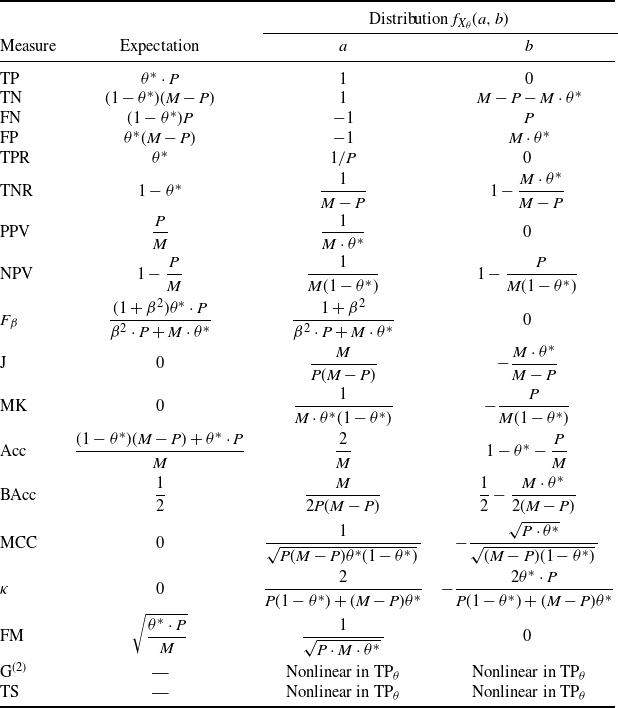
Next, we derive mathematical properties of the DD classifier for every evaluation measure in Table 1 (except PT). Note that the DD is stochastic; thus, we examine the distribution of the evaluation measure. Furthermore, we also determine the range and expectation of a DD classifier.
3.1.1. Distribution
The distributions of the base measures (see Section 2.2) are directly determined by
 $\sigma_{\theta}$
. Consider, for example, TP, the number of positive observations that are also predicted to be positive. In a dataset of M observations with P labeled positive,
 $\lfloor M\cdot\theta \rceil$
random observations are predicted as positive in the DD approach. This implies that
 $\textrm{TP}_{\theta}$
is hypergeometrically distributed with parameters M, P, and
 $\lfloor M\cdot\theta \rceil$
, as the classifier randomly draws
 $\lfloor M\cdot\theta \rceil$
samples without replacement from a population of size M, where P samples are labeled positive. Thus,
 \begin{align*} \mathbb{P}(\textrm{TP}_{\theta} = s) = \begin{cases} \dfrac{\binom{P}{s} \cdot \binom{M - P}{\lfloor M\cdot\theta \rceil - s}} {\binom{M}{\lfloor M\cdot\theta \rceil}} & \textrm{if } s\in\mathcal{D}(\textrm{TP}_{\theta}), \\ 0 & \textrm{otherwise}, \end{cases}\end{align*}
where
 $\mathcal{D}(\textrm{TP}_{\theta})$
is the domain of
 $\textrm{TP}_{\theta}$
. The definition of this domain is given in (5).
The other three base measures are also hypergeometrically distributed, following similar reasoning. This leads to:
 \begin{align*} \textrm{TP}_{\theta} & \sim \textrm{Hypergeometric}({{{{M, P, \lfloor M\cdot\theta \rceil}}}}), \\ \textrm{FP}_{\theta} & \sim \textrm{Hypergeometric}({{{{M, N, \lfloor M\cdot\theta \rceil}}}}), \\ \textrm{FN}_{\theta} & \sim \textrm{Hypergeometric}({{{{M, P, M-\lfloor M\cdot\theta \rceil}}}}), \\ \textrm{TN}_{\theta} & \sim \textrm{Hypergeometric}({{{{M, N, M-\lfloor M\cdot\theta \rceil}}}}).\end{align*}
Note that these random variables are not independent. In fact, they can all be written in terms of
 $\textrm{TP}_{\theta}$
. This is a crucial effect of the DD approach, as it reduces the formulations to only a function of a single variable. Consequently, most evaluation measures can be written as a linear combination of only
 $\textrm{TP}_{\theta}$
. With only one random variable, theoretical derivations and optimal classifiers can be determined. As mentioned,
 $\textrm{TP}_{\theta} + \textrm{FN}_{\theta} = P$
and
 $\textrm{TN}_{\theta} + \textrm{FP}_{\theta} = N = M-P$
, and we also have
 $\textrm{TP}_{\theta} + \textrm{FP}_{\theta} = \lfloor M\cdot\theta \rceil$
, because this denotes the total number of positively predicted observations. These three identities are linear in
 $\textrm{TP}_{\theta}$
. Thus, each base measure can be written in the form
 $X_{\theta}(a, b) \,:\!=\, a\cdot\textrm{TP}_{\theta} + b$
with
 $a, b \in \mathbb{R}$
. Additionally, let
 $f_{X_\theta}(a, b)$
be the probability distribution of
 $X_{\theta}(a, b)$
. Then, by combining the identities, we get
 \begin{align} \textrm{TP}_{\theta} & = \textrm{TP}_{\theta} , \end{align}
 \begin{align} \textrm{FP}_{\theta} & = \hat{P}_{\theta} - \textrm{TP}_{\theta} , \end{align}
 \begin{align} \textrm{FN}_{\theta} & = P - \textrm{TP}_{\theta} ,\end{align}
 \begin{align} \textrm{TN}_{\theta} & = N - \hat{P}_{\theta} + \textrm{TP}_{\theta} , \end{align}
with
 $\hat{P}_{\theta} \,:\!=\, \lfloor M\cdot\theta \rceil$
.
Example 1. (Distribution of
 $F_{\beta}$
score.) To illustrate how the probability function
 $f_{X_\theta}(a, b)$
can directly be derived, we consider the
 $F_{\beta}$
score [Reference Chinchor4]. It is the weighted harmonic average between the true positive rate (
 $\textrm{TPR}_{\theta}$
) and the positive predictive value (
 $\textrm{PPV}_{\theta}$
). The latter two performance metrics are discussed extensively in the Supplementary Material. The
 $F_{\beta}$
score balances predicting the actual positive observations correctly (
 $\textrm{TPR}_{\theta}$
) and being cautious in predicting observations as positive (
 $\textrm{PPV}_{\theta}$
). The factor
 $\beta \gt 0$
indicates how much more
 $\textrm{TPR}_{\theta}$
is weighted compared to
 $\textrm{PPV}_{\theta}$
. The
 $F_{\beta}$
score is commonly defined as
 \begin{equation*} \textrm{F}^{(\beta)}_{\theta} = \frac{1+\beta^2}{({1}/{\textrm{PPV}_{\theta}}) + ({\beta^2}/{\textrm{TPR}_{\theta}})}. \end{equation*}
By substituting
 $\textrm{PPV}_{\theta}$
and
 $\textrm{TPR}_{\theta}$
by their definitions (see Table 1) and using (1) and (2), we get
 \begin{equation*} \textrm{F}^{(\beta)}_{\theta} = \frac{(1+\beta^2)\textrm{TP}_{\theta}}{\beta^2 \cdot P + \lfloor M\cdot\theta \rceil}. \end{equation*}
Since
 $\textrm{PPV}_{\theta}$
is only defined when
 $\hat{P}_{\theta} = \lfloor M\cdot\theta \rceil \gt 0$
and
 $\textrm{TPR}_{\theta}$
is only defined when
 $P \gt 0$
, for
 $\textrm{F}^{(\beta)}_{\theta}$
we need that both these restrictions hold. The definition of
 $\textrm{F}^{(\beta)}_{\theta}$
is linear in
 $\textrm{TP}_{\theta}$
and can therefore be formulated as
 \begin{equation*} \textrm{F}^{(\beta)}_{\theta} = X_{\theta}\bigg(\frac{1+\beta^2}{\beta^2\cdot P + \lfloor M\cdot\theta\rceil},0\bigg). \end{equation*}
3.1.2. Range
The values that
 $X_{\theta}(a, b)$
can attain depend on a, b, and the domain of
 $\textrm{TP}_{\theta}$
. Without restriction, the maximum number that
 $\textrm{TP}_{\theta}$
can be is P. Then, all positive observations are also predicted to be positive. However, when
 $\theta$
is small enough that
 $\lfloor M\cdot\theta \rceil \lt P$
, then only
 $\lfloor M\cdot\theta \rceil$
observations are predicted as positive. Consequently,
 $\textrm{TP}_{\theta}$
can only reach the value
 $\lfloor M\cdot\theta \rceil$
in this case. Hence, in general, the upper bound of the domain of
 $\textrm{TP}_{\theta}$
is
 $\min\{P, \lfloor M\cdot\theta \rceil\}$
. The same reasoning holds for the lower bound: when
 $\theta$
is small enough, the minimum number of
 $\textrm{TP}_{\theta}$
is 0 since all positive observations can be predicted as negative. However, when
 $\theta$
gets large enough, positive observations have to be predicted positive even if all
 $M - P$
negative observations are predicted positive. Thus, in general, the lower bound of the domain is
 $\max\{0, \lfloor M\cdot\theta \rceil - (M-P)\}$
. Now, let
 $\mathcal{D}(\textrm{TP}_{\theta})$
be the domain of
 $\textrm{TP}_{\theta}$
, then
 \begin{equation} \mathcal{D}(\textrm{TP}_{\theta}) \,:\!=\, \{i\in\mathbb{N}_0 \colon \max\{0, \lfloor M\cdot\theta \rceil - (M-P)\} \leq i \leq \min\{P, \lfloor M\cdot\theta \rceil\}\}.\end{equation}
Consequently, the range of
 $X_{\theta}(a, b)$
is given by
 \begin{equation} \mathcal{R}(X_{\theta}(a, b)) \,:\!=\, \{a \cdot i + b\}_{i\in\mathcal{D}(\textrm{TP}_{\theta})}.\end{equation}
3.1.3. Expectation
The introduction of
 $X_{\theta}(a, b)$
allows us to write its expected value in terms of a and b. This statistic is required to calculate the actual baseline. Since
 $\textrm{TP}_{\theta}$
has a
 $\textrm{Hypergeometric}({{{{M, P, \lfloor M\cdot\theta \rceil}}}})$
distribution, its expected value is known and given by
 \begin{equation*} \mathbb{E}[\textrm{TP}_{\theta}] = \frac{\lfloor M\cdot\theta \rceil}{M} \cdot P. \end{equation*}
Next, we obtain the following general definition for the expectation of
 $X_{\theta}(a, b)$
:
 \begin{equation} \mathbb{E}[X_{\theta}(a, b)] = a \cdot \mathbb{E}[\textrm{TP}_{\theta}] + b = a \cdot \frac{\lfloor M\cdot\theta \rceil}{M} \cdot P + b.\end{equation}
This rule is consistently used to determine the expectation for each measure.
Example 2. (Expectation of
 $F_{\beta}$
score.) To demonstrate how the expectation is calculated for a performance metric, we again consider
 $\textrm{F}^{(\beta)}_{\theta}$
. It is linear in
 $\textrm{TP}_{\theta}$
with
 $a = (1+\beta^2)/(\beta^2 \cdot P + \lfloor M\cdot\theta \rceil)$
and
 $b = 0$
, and so its expectation is given by

A full overview of the distribution and mean of all the base and performance metrics considered is given in Table 3. The Supplementary Material provides all the calculations to derive the corresponding distributions and expectations.
Properties of performance metrics for a DD classifier. Expectation and distribution of each performance metric for a DD classifier
 $\sigma_{\theta}$
with
 $\theta^* = {\lfloor M\cdot\theta \rceil}/{M}$
.

3.2. Optimal Dutch Draw classifier
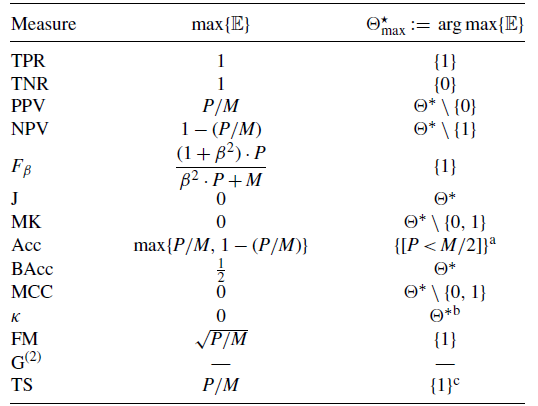
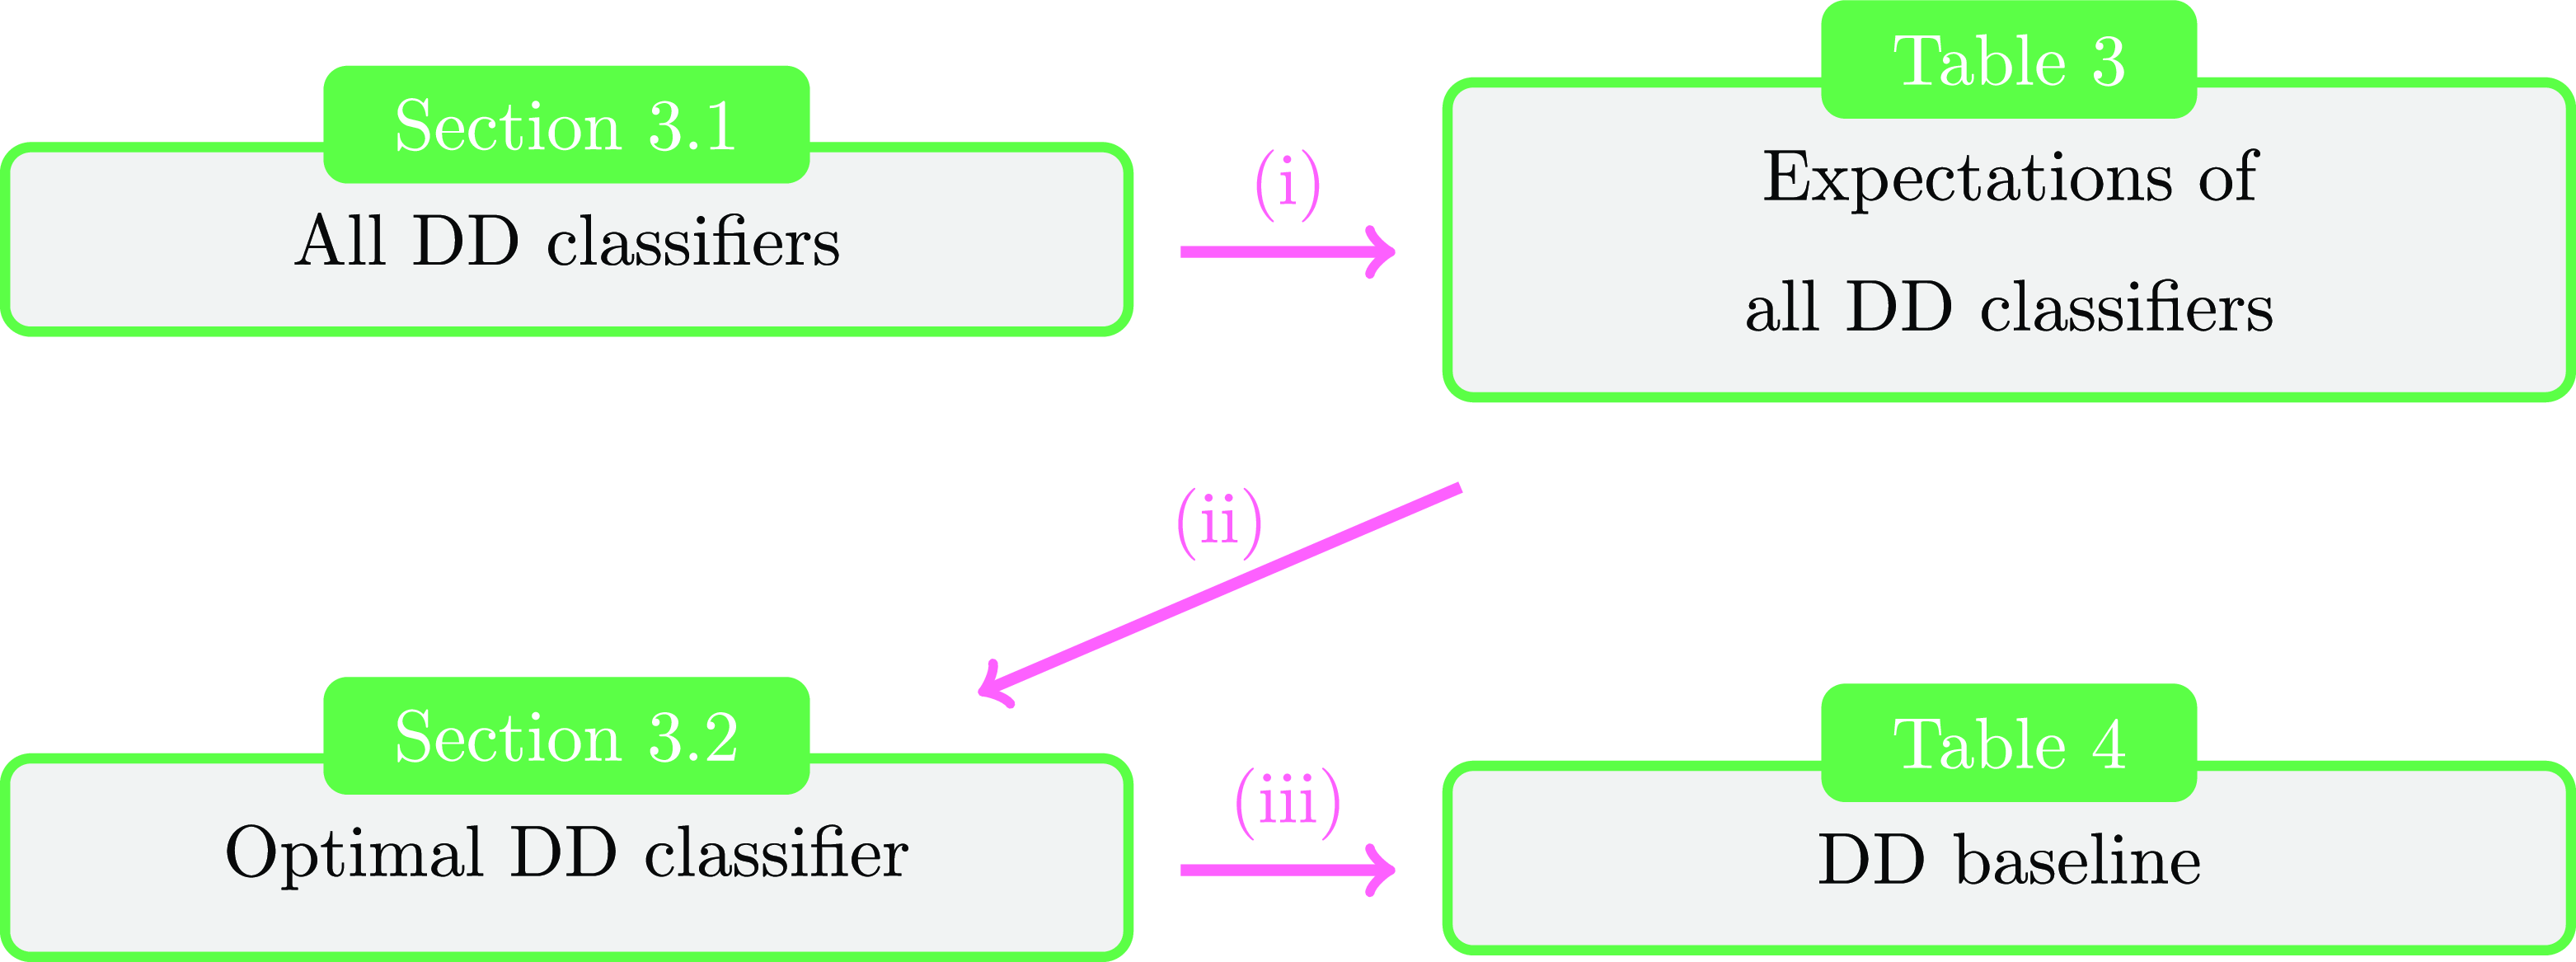
Next, we discuss how the DD baseline will ultimately be derived. To do so, an overview is presented in Figure 1. Starting with the definition of the DD classifiers in Section 3.1 and determining their expectations for commonly used measures (see Table 3), we are now able to identify the optimal DD classifier. Given a performance metric and dataset, the optimal DD classifier is found by optimizing the associated expectation for
 $\theta \in [0,1]$
. It is natural to assume that the considered evaluation measures/metrics are maximized. Thus, metrics that are usually minimized are omitted from this paper. The procedure can be followed for these metrics by replacing maximizing with minimizing.
DD baseline. For many performance metrics, the maximum expected score of all allowed DD classifiers is determined, which is the DD baseline. In this table, the baselines and the optimizing parameters are given. ‘—’ denotes that no closed-form expression was found.

a If
 $P = {M}/{2}$
, then
 $\Theta^*$
. Note that Iverson brackets are used to simplify the notation.
b If
 $P=M$
, then
 $\Theta^* \setminus \{1\}$
.
c If
 $P=1$
, then
 $\Theta^* \setminus \{0\}$
.
Road to the DD baseline. This is an overview of how the DD baseline is determined. (i) All expectations are derived. (ii) The expectation is maximized. (iii) The performance of the best DD classifier is the DD baseline.

3.2.1. Dutch Draw baseline
The optimal DD classifiers and the corresponding DD baseline can be found in Table 4. For many performance metrics, it is optimal to predict all instances as positive or all of them as negative. In some cases, this is not allowed due to ill-defined measures. Then, it is often optimal to only predict one sample differently. For several other metrics, almost all parameter values give the optimal baseline. Next, we give an example to illustrate how the results of Table 4 are derived.
Example 3. (DD baseline for the
 $F_{\beta}$
score.) To determine the DD baseline, the extreme values of the expectation
 $\mathbb{E}\big[\textrm{F}^{(\beta)}_{\theta}\big]$
need to be identified. To do this, examine the function
 $f\colon[0,1]\rightarrow[0,1]$
defined as
 \begin{equation*} f(t) = \frac{(1+\beta^2) \cdot P \cdot t}{\beta^2 \cdot P + M \cdot t}. \end{equation*}
The relationship between f and
 $\mathbb{E}\big[\textrm{F}^{(\beta)}_{\theta}\big]$
is given as
 $f(\lfloor M\cdot\theta \rceil / M) = \mathbb{E}\big[\textrm{F}^{(\beta)}_{\theta}\big]$
. To find the extreme values, we have to look at the derivative of f,
 \begin{equation*} \frac{\textrm{d}f(t)}{\textrm{d}t} = \frac{\beta^2(1+\beta^2)\cdot P^2}{(\beta^2 \cdot P + M \cdot t)^2}. \end{equation*}
It is strictly positive for all t in its domain. Thus, f is strictly increasing in t. This means
 $\mathbb{E}\big[\textrm{F}^{(\beta)}_{\theta}\big]$
is non-decreasing in
 $\theta$
and also in
 $\theta^*$
, because the term
 $\theta^* = \lfloor M\cdot\theta \rceil / M$
is non-decreasing in
 $\theta$
. Hence, the maximum expectation of
 $\textrm{F}^{(\beta)}_{\theta}$
is
 \begin{equation*} \max_{\theta\in[1/(2M),1]}\big(\mathbb{E}\big[\textrm{F}^{(\beta)}_{\theta}\big]\big) = \max_{\theta\in[1/(2M),1]}\bigg(\frac{(1+\beta^2)\cdot P\cdot\lfloor M\cdot\theta\rceil} {M\cdot(\beta^2\cdot P + \lfloor M\cdot\theta\rceil)}\bigg) = \frac{(1+\beta^2) \cdot P}{\beta^2 \cdot P + M}. \end{equation*}
Note that
 $\lfloor M\cdot\theta\rceil \gt 0$
is a restriction for
 $\textrm{F}^{(\beta)}_{\theta}$
; hence, the maximum is taken over the interval
 $[1/(2M), 1]$
. Furthermore, the optimization value
 $\theta_{\textrm{max}}$
is given by
 \begin{equation*} \theta_{\textrm{max}} \in \mathop{\textrm{arg max}}\limits_{\theta\in[1/(2M),1]}\big(\mathbb{E}\big[\textrm{F}^{(\beta)}_{\theta}\big]\big) = \mathop{\textrm{arg max}}\limits_{\theta\in[1/(2M),1]} \bigg(\frac{\lfloor M\cdot\theta\rceil}{\beta^2\cdot P + \lfloor M\cdot\theta\rceil}\bigg) = \bigg[1 - \frac{1}{2M}, 1\bigg] . \end{equation*}
Following this reasoning, the discrete form
 $\theta^*_{\textrm{max}}$
is given by

This implies that predicting everything positive yields the largest
 $\mathbb{E}\big[\textrm{F}^{(\beta)}_{\theta}\big]$
.
3.2.2. Selecting performance metrics
The expectations of the DD given in Table 4 and the codomains of each performance metric given in Table 1 indicate that DD baseline values are identical to the expected score of the ‘optimal’ model for some performance metrics, like TPR/TNR. Evaluating the performance of a classifier on one of these metrics will always give an unsatisfying result, as input-dependent classifiers can only underperform or match the DD baseline. In addition, evaluating a classifier on only one of the other metrics cannot give a holistic view of the performance of a classifier, as each metric weights the base measures differently. There is no metric ‘objectively’ better than all other metrics. Multiple performance metrics should be checked to evaluate a classifier properly. The expectations given in Table 4 serve as a lookup table to validate the performance of a classifier from a holistic perspective.
3.2.3. Non-linear performance metrics
We have shown that the DD baseline is straightforward for performance metrics that can be written in linear terms of
 $\textrm{TP}_{\theta}$
. However, there are performance metrics, such as
 $\textrm{G}^{(2)}_{\theta}$
, where this is impossible. This could make it hard to derive a closed-form expression for the maximum expectation. Previously, we saw in Table 4 that
 $\theta^*=0$
or
 $\theta^* = 1$
was often optimal. Examining
 $\textrm{G}^{(2)}_{\theta}$
more closely shows that simply selecting
 $\theta^* = 0$
or
 $\theta^*=1$
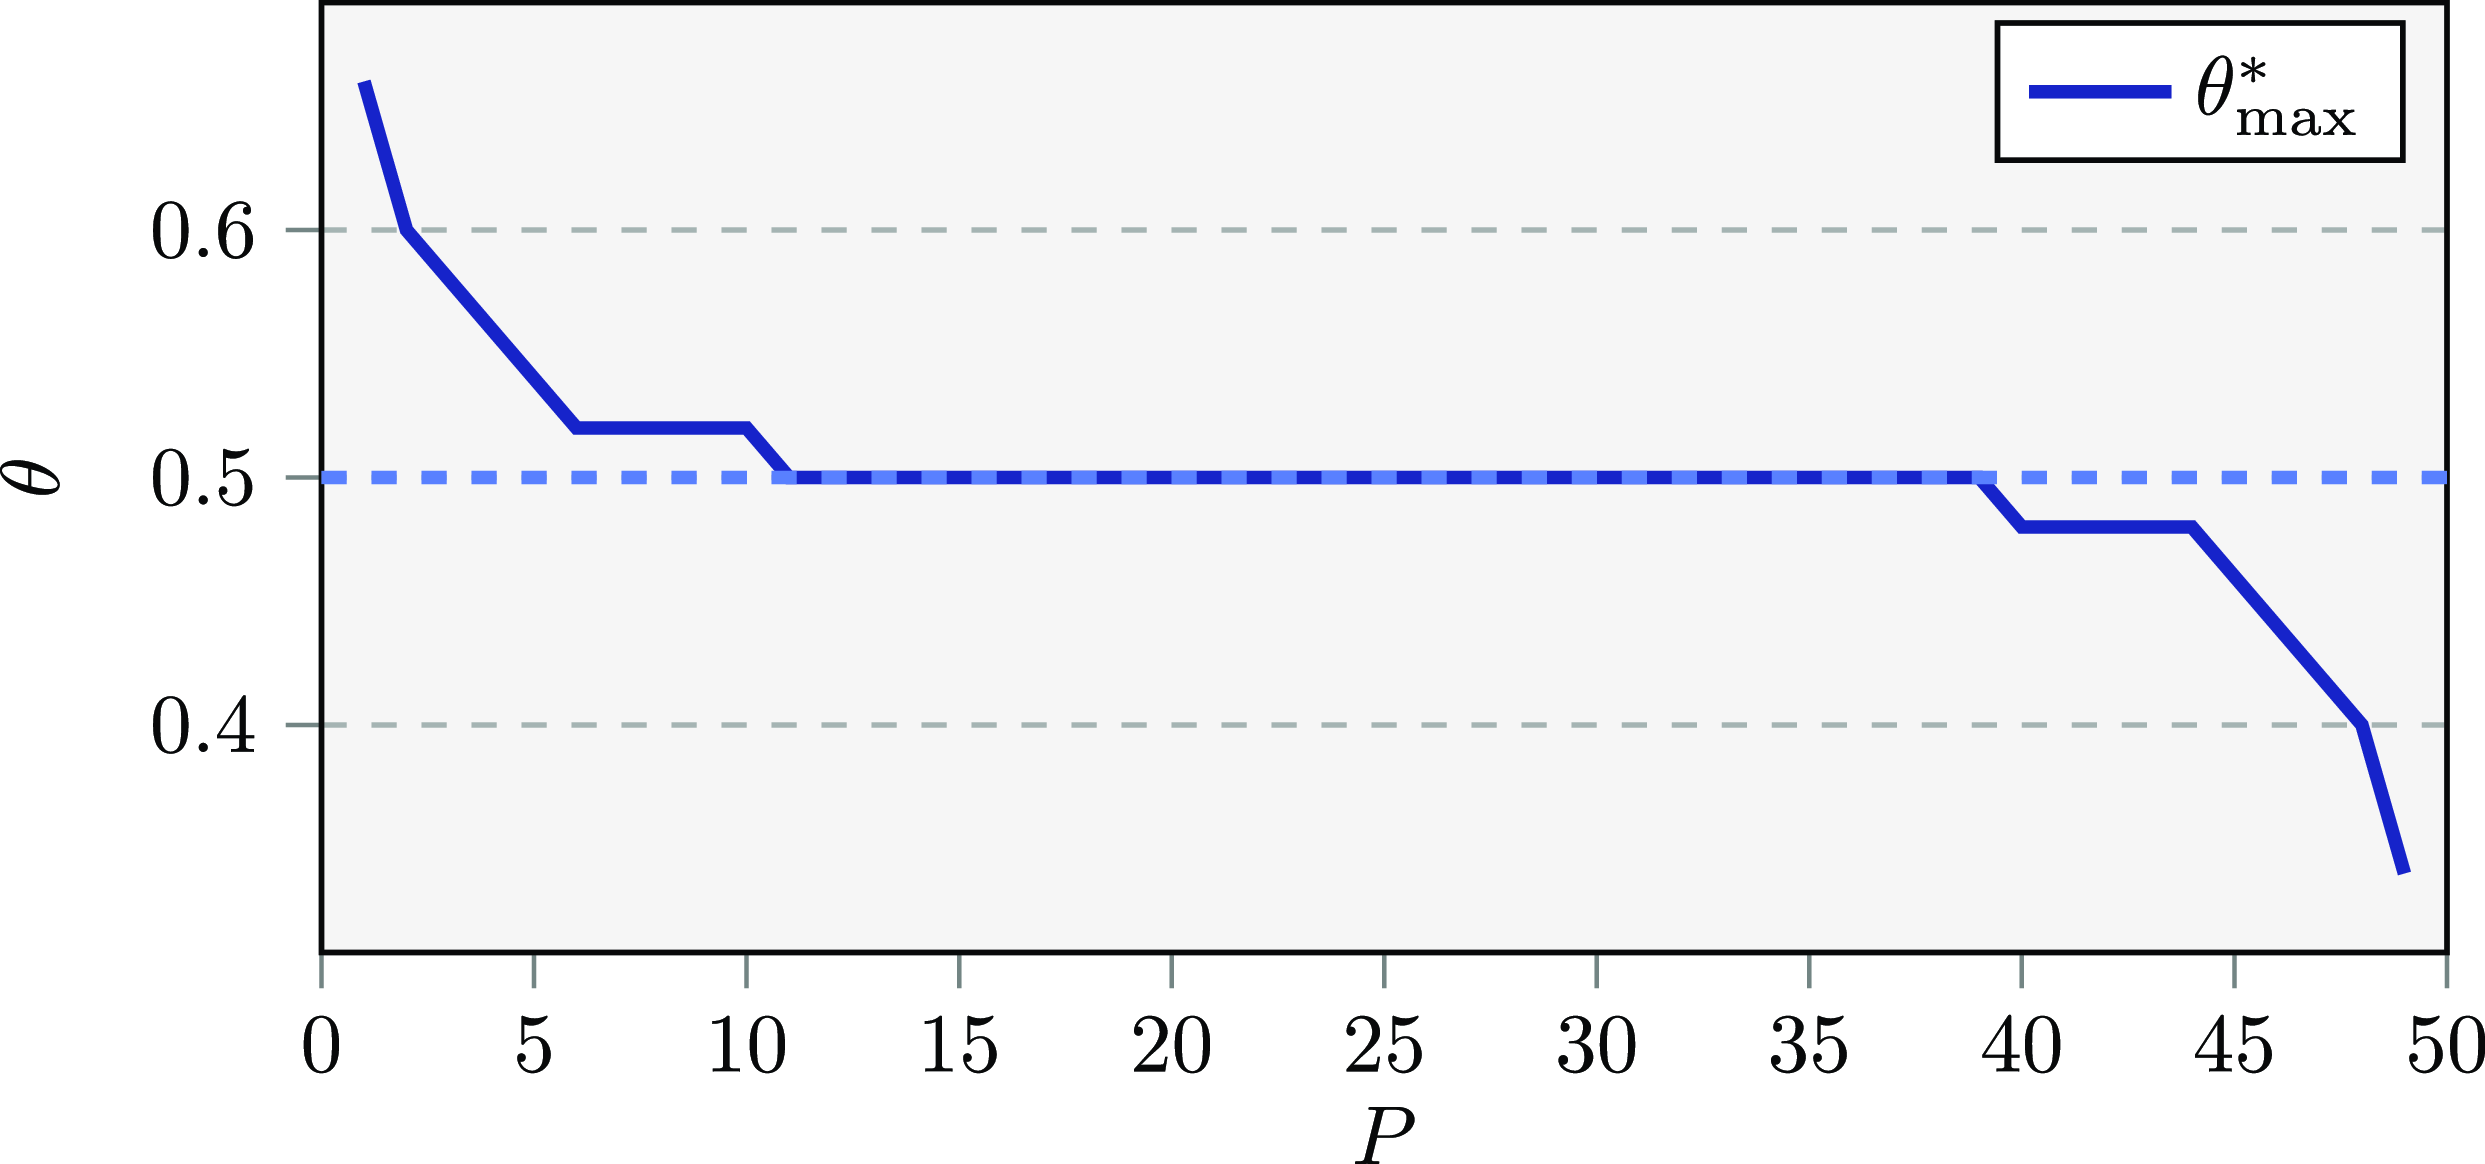
would result in the worst possible score. To show that the optimal parameter is less straightforward in this case, we show the optimal
 $\theta^*_{\textrm{max}}$
in Figure 2 for a fixed M and increasing P. This shows that
 $\theta =0.5$
is not always optimal. The optimal value significantly differs when
 $P\ll N$
or
 $P\gg N$
. We believe that the following reasoning can explain this: Observe that
 $\textrm{G}^{(2)} = \sqrt{\textrm{TPR} \cdot \textrm{TNR}} $
is zero when either TPR or TNR is zero, which is the minimum score. When there are few positive labels, it must be prevented that all these samples are falsely predicted negative, which is why
 $\theta^*_{\textrm{max}}$
is increased. The reverse holds when there are only a few negative samples. The DD baseline can still be derived for non-linear performance metrics by determining the expectations of all DD classifiers. However, future research can greatly improve this (see Section 5).
Non-trivial
 $\theta^*_{\textrm{max}}$
for
 $\textrm{G}^{(2)}_{\theta}$
. For each
 $P\in \{1,\dots, 49\}$
, the optimal
 $\theta^*_{\textrm{max}}$
is derived for the performance metric
 $\textrm{G}^{(2)}_{\theta}$
with a dataset consisting of P positive and
 $50-P$
negative samples. This shows that the optimal value is not straightforward.

4. Dutch Draw in practice
Now that we have established how to derive the DD baseline, it is time to see how the DD could be used in practice.
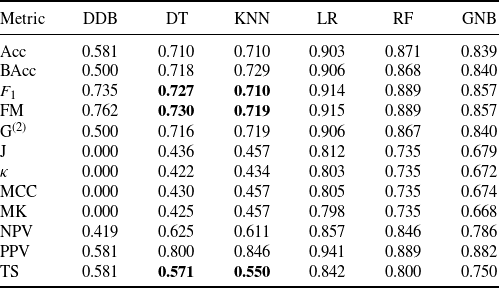
Example 4. (Cleveland heart disease.) A dataset (Cleveland heart disease) was provided to predict whether patients have heart disease using several feature values [Reference Janosi, Steinbrunn, Pfisterer and Detrano6]. We randomly split the dataset into a training (90%) and a test set (10%) and chose the
 $F_1$
measure to evaluate how well a model performs. The DD baseline, derived using the M and P of the test data, immediately provided a performance reference (0.735) for any model. We trained two common machine learning algorithms (decision tree and k-nearest neighbors) with default parameters in scikit-learn [Reference Pedregosa13]. To estimate the expected performance, we averaged the results obtained from 10 different random seeds for each stochastic model. They achieved an average score of 0.727 and 0.710, respectively, which are worse than the DD baseline. This is a major warning sign. Although the decision tree performed better than k-nearest neighbors, it should still not be used. Thus, we decided to train three other models (logistic regression, random forest, and Gaussian naive Bayes), which ended up performing better than the baseline. Finally, we selected the logistic regression model in practice, as this model achieved the highest score and beat the DD baseline. Table 5 shows an overview of the performance of these five models and the baseline on a set of selected performance metrics.
Comparing performance with the DD baseline. Five standard machine learning algorithms (decision tree (DT), k-nearest neighbors (KNN), logistic regression (LR), random forest (RF), and Gaussian naive Bayes (GNB)) were tested on the Cleveland Heart Disease dataset for many commonly used performance metrics. The average results on the test data using 10 random seeds for the stochastic models are compared with the DD baseline (DDB, first column). The bold scores highlight the situations where a model achieved a score inferior to the DD baseline.

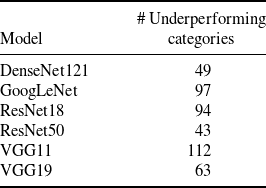
Comparative accuracy scores across categories. For each vision model, the category-wise accuracy is determined on the validation dataset of ILSVRC2012. The DD baseline is identical for each category, as there are 50 images in the data (
 $0.999$
). For each vision model, the number of categories with scores inferior to the DD baseline is presented.

Example 5. (ImageNet.) The previous example illustrates how the DD baseline provides insights into the performance of a set of standard machine-learning models. Nevertheless, tasks involving higher-dimensional data necessitate more advanced model architectures. Image-related classification tasks serve as a prevalent example of such complex problems, and we aim to demonstrate in this example how the DD baseline imparts valuable insights for these models tackling more demanding challenges. The ImageNet Large Scale Visual Recognition Challenge 2012 (ILSVRC2012) offers a significant dataset comprised of over one million images across a thousand diverse object categories [Reference Russakovsky14]. This challenge involves developing a multiclass classification model that accurately predicts which object (such as a sock, volleyball, vase, etc.) is visible in each image. We selected a range of state-of-the-art vision models, including DenseNet121, GoogLeNet, ResNet18, ResNet50, VGG11, and VGG19, to tackle this classification problem. These models were implemented and pre-trained in PyTorch [Reference Paszke12] on the training dataset of the ImageNet dataset. Typically, the performance of these models is assessed based on top-one or top-five accuracy rates. However, our interest lies in identifying the categories where these models do not perform as well in testing the underlying performance. The test data labels are not publicly available, but we can assess these models using the provided validation dataset, which contains 50 images per category. The outputs of the selected vision models on this dataset are vectors of probabilities representing the likelihood of the input image belonging to each of the 1000 classes. The model assigns the class label with the highest likelihood to the instance. We calculated the four base measures for each category i by categorizing all instances of label i as ‘positive’ and all other labels as ‘negative’ in both the predicted and actual data. There are 50 images per category in the validation dataset, so the DD baseline, independently of the selected evaluation metric, is identical for each category (
 $P=50$
,
 $M=50\,000$
). Table 6 shows the number of categories having an inferior Accuracy score when compared to its corresponding DD baseline (
 $0.999$
). As the DD baseline takes class imbalance into account, accuracy scores can be interpreted for this binary classification problem even though this metric is not robust against imbalance. It is crucial to explore categories that fail the sanity check, whether this stems from issues with the data or the models themselves. There are, in total, 24 categories where none of the selected vision models actually outperform the DD baseline, indicating underlying issues with these categories. Enhancing the performance in these weaker categories would contribute to the overall efficacy of these multiclass classification models.
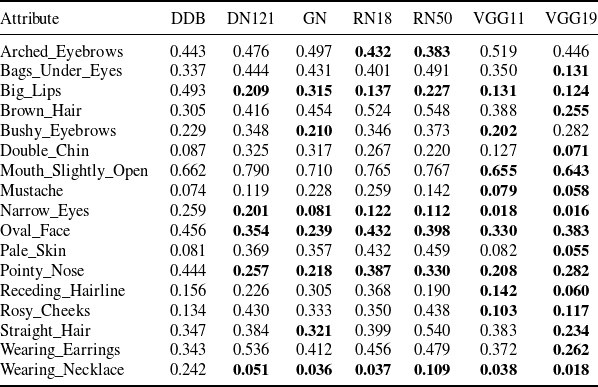
Example 6. (CelebA.) In the previous example, we delved into a high-dimensional multiclass classification problem, illustrating how the DD baseline aids in the improvement of models tackling this problem. Now, we focus on another realm of high-dimensional challenges, specifically those involving multiple binary classification tasks, the so-called multitask learning problem, namely the image-related task of detecting facial attributes. The problem is to detect these attributes in images, like wearing glasses or a cap. The CelebA dataset can be used for this task and generative image creation [Reference Liu, Luo, Wang and Tang9]. The dataset consists of 100 000+ images of 10 177 identities. Each image is annotated with 40 facial attributes. To the best of our knowledge, no publicly available trained model is yet available. Fortunately, we can use pre-trained models of other datasets, like the ImageNet dataset, and replace the last layer of each network with a layer making predictions for each binary facial attribute. The approach is commonly known as transfer learning. We selected the same vision models as for the ImageNet dataset. We trained this last layer on the training dataset of CelebA based on the weighted cross entropy loss that corrects for imbalance in the training data and the standard Adam optimizer in batches of 100 images. The labels for the test dataset comprising 19 962 images are publicly available, so the trained vision models were evaluated on this data. Table 7 shows the results of the vision models evaluated on the test dataset of the CelebA dataset. The DD baseline helps identify attributes where the score of the transferred state-of-the-art vision models was inferior. In our evaluation, we selected the
 $F_1$
score to assess each model’s performance, as the data has an attribute-dependent class imbalance. Still, similar results can be acquired when selecting another evaluation metric. Remarkably, the performance of all the vision models was inferior for the attributes Big_Lips, Narrow_Eyes, Oval_Face, Pointy_Nose, and Wearing_Necklace. Like our statement for the ImageNet dataset, data- or model-related issues can cause this underperformance. Again, the DD baseline helps identify features where the score of classification models is inferior.
 $F_1$
scores for vision models on the CelebA test dataset. After retraining the last layer of each pre-trained vision mode, the following
 $F_1$
scores are obtained. The DD baseline, DenseNet121, GoogLeNet, ResNet18, ResNet50 are abbreviated as DDB, DN121, GN, RN18, and RN50, respectively. We selected the attributes where at least one of the vision models underperformed compared to the DD baseline. We highlight the performance metric scores in bold, indicating a score inferior to the DD baseline.

5. Discussion and conclusion
In this research, we have proposed a new baseline methodology called the Dutch Draw. The DD baseline is:
-
(i) applicable to any binary classification problem;
-
(ii) reproducible;
-
(iii) simple;
-
(iv) parameter-free;
-
(v) more informative than any single dummy baseline;
-
(vi) an explainable minimal requirement for any new model.
We have shown that for the most commonly used measures, the DD baseline can be theoretically determined (see Table 4). When the baseline cannot be derived directly, it can quickly be identified by computation. For most performance metrics, the DD baseline reduces to one of the following three cases:
-
(i) always predicting positive or negative;
-
(ii) always predicting positive or negative, except for one instance;
-
(iii) any DD classifier, except maybe for
$\theta^* = 0$
or
$\theta^* = 1$
.


However, there are exceptions to these three cases, as was shown with the
 $\textrm{G}^{(2)}_{\theta}$
. This shows that the DD is not always reduced to one of the three previously mentioned cases and does not always give straightforward results.
By introducing the DD baseline, we have simplified and improved the evaluation process of new binary classification methods. We consider it a minimum requirement for any novel model to at least beat the DD baseline. When this does not happen, the question is raised of how much a new method has even learned from the data since the DD baseline is derived from dummy classifiers. When the novel model has beaten the DD baseline, it should still be compared to a state-of-the-art method in that domain to obtain additional insights. In Section 4, we have shown how the DD should be used in practice. In Example 4, we showed that commonly used approaches, such as k-nearest neighbors and a decision tree, can underperform. An advantage of the DD is that the expected performance can be directly derived, as opposed to other (stochastic) models, where the expected value can only be estimated through (many) experiments. Examples 5 and 6 discussed two image-related tasks where the DD baseline can identify task-related underperformance of vision models. The DD baseline can identify problematic categories in multiclass problems or specific tasks in multitask classification problems. The goal of these experiments is to show that benchmarking classification models is essential. The insights obtained from the DD baseline provide valuable perspectives that empower us to enhance and refine models. Hence, using the Dutch Draw as a general, simple, and informative baseline should be the new gold standard in any binary model evaluation process.
5.1. Further research
Our baseline is a stepping stone for further research, where multiple avenues should be explored. We discuss five possible research directions.
First, a wide range of other input-independent classifiers should be explored. Does the DD baseline outperform these methods, and can this be proven? If so, it would provide a solid argument to use the DD baseline over any other input-independent baseline in future applications, which is why this research question is important.
Second, we can now determine whether a binary classification model performs better than a universal baseline. However, we do not yet know by how much it performs better (or worse). For example, let the baseline have a score of 0.5 and a new model a score of 0.9. How much better is the latter score? It could be that a tiny bit of extra information quickly pushes the score from 0.5 to 0.9. Or, it is possible that a model needs a lot of information to understand the intricacies of the problem, making it very difficult to reach a score of 0.9. Thus, it is necessary to quantify how hard it is to reach any score. Also, when another model is added that achieves a score of 0.91, can the difference in the performance of these models be quantified? Is it only a slightly better model, or is it a leap forward?
Third, our DD baseline could be used to construct new standardized evaluation measures from their original versions. The advantage of these new measures would be that the interpretation of their scores is independent of the number of positive and negative observations in the dataset. In other words, the DD baseline would already be incorporated in the new measure, so comparing a score to the baseline is no longer necessary. The DD baseline can be used to scale a measure in many ways. Let
 $\Delta_{\max}$
and
 $\Delta_{\min}$
denote the maximum and minimum DD baseline, respectively. As an example, a measure
 $\mu$
with range
 $[\mu_{\min},\mu_{\max}]$
that needs to be maximized can be rescaled by
 \begin{equation*} \mu_{\textrm{rescaled}} = \left\{ \begin{array}{l@{\qquad}l} -1 & \textrm{if } \mu \leq \Delta_{\min}, \\ \dfrac{\mu-\Delta_{\max}}{\Delta_{\max}-\Delta_{\min}} & \textrm{if } \Delta_{\min}\leq\mu\leq\Delta_{\max}, \\[3mm] \dfrac{\mu-\Delta_{\max}}{\mu_{\max}-\Delta_{\max}} \quad & \textrm{otherwise}. \end{array} \right.\end{equation*}
Everything below the lowest DD baseline (
 $\Delta_{\min}$
) gets value
 $-1$
, because every Dutch Draw classifier performs better. This should be a major warning sign. A score between
 $\Delta_{\min}$
and
 $\Delta_{\max}$
is rescaled to
 $[{-}1,0]$
. This value indicates that the performance is still worse than the best DD baseline. All scores above
 $\Delta_{\max}$
are scaled to [0,1]. In this case, the performance of a classifier outperforms the best DD baseline.
Fourth, another natural extension would be to drop the binary assumption and consider multiclass classification. This is more complicated than it seems because not every multiclass evaluation measure follows automatically from its binary counterpart. However, we expect that for most multiclass measures, it is again optimal always to predict a single specific class.
Fifth, for some (less straightforward) performance metrics, the DD baseline is derived by examining the expectations of all DD classifiers. Thus, faster techniques should be developed for large applications. Insights could greatly improve the computation time. For example, we conjecture for
 $\textrm{G}^{(2)}_{\theta}$
that
 $\theta^*_{\textrm{max}} \in \big[0,\frac12\big]$
when
 $P \gt N$
, and
 $\theta^*_{\textrm{max}} \in \big[\frac12, 1\big]$
, when
 $P \lt N$
. This already reduces the search domain by half. Proving convexity could also make it easier to derive the optimal value. Decreasing the computation time could be essential for some large applications and should be investigated.
Finally, we have published the code for the DD so the reader can easily implement the baseline in their binary classification problems.
Acknowledgements
The authors wish to thank the anonymous referees for their useful comments, which have significantly improved the readability and quality of the paper.
Funding Information
There are no funding bodies to thank relating to the creation of this article.
Competing Interests
There were no competing interests to declare during this article’s preparation or publication process.
Data
All data used in this research is cited in the appropriate sections.
Code availability
The Dutch Draw code can be found at https://github.com/joris-pries/DutchDraw.
Authors’ contributions (Contributor Roles Taxonomy (CRediT))
-
Etienne van de Bijl: Conceptualization, Methodology, Software, Validation, Formal analysis, Investigation, Data Curation, Writing - Original Draft, Writing - Review & Editing, Visualization, Project administration.
-
Jan Klein: Conceptualization, Methodology, Software, Validation, Formal analysis, Investigation, Data Curation, Writing - Original Draft, Writing - Review & Editing, Visualization, Project administration.
-
Joris Pries: Conceptualization, Methodology, Software, Validation, Formal analysis, Investigation, Data Curation, Writing - Original Draft, Writing - Review & Editing, Visualization, Project administration.
-
Sandjai Bhulai: Conceptualization, Validation, Writing - Review & Editing, Supervision.
-
Mark Hoogendoorn: Conceptualization, Validation, Writing - Review & Editing, Supervision.
-
Rob van der Mei: Conceptualization, Validation, Writing - Review & Editing, Supervision.
Supplementary Material
The supplementary material for this article can be found at https://doi.org/10.1017/jpr.2024.52.