I. INTRODUCTION
In modern era, multi-functionality in nanostructured thin films paves a way to design and develop nanotechnologies for promising applications such as in optoelectronics, MEMS devices, and corrosion and heat resistant devices. Reference Wang and Bierwagen1,Reference Ralib, Nordin, Malik, Othman, Alam, Khan, Mortada, Crunteanu, Chatras and Orlianges2 Huge usage of thin film devices generates a reliability issue and a risk of mechanical failure including fracture, fatigue, damage, and possibility of cracking and delamination during handling of devices. Reference Freund and Suresh3 The mechanical characteristics of thin films significantly affect device fabrication and reliability during service conditions. Several factors like crystallinity, internal stress, grain size, defects, and dislocation can affect mechanical response of thin films. However, the generation of internal stresses affects the microstructure, which is highly sensitive to the synthesis conditions as well as the underlying substrate properties. High internal stress itself may cause failure of thin films. Reference Freund and Suresh3,Reference Daniel, Zeilinger, Schöberl, Sartory, Mitterer and Keckes4 The process conditions in synthesis techniques, namely, physical vapor deposition as well as chemical deposition techniques can be tailored to engineer the microstructure so as to deposit thin films with desirable functional properties. However, deposition of high quality thin films depends on growth mechanisms and uniformity in thickness, and better adhesion of films to the substrate depends on the deposition techniques. Reference Kelly and Arnell5
The conventional instruments based on visually imprint of the Vickers indenter are not useful for the precise measurement of mechanical properties of thin films and nanostructures. Hardness, Young’s modulus, as well as adhesion are considered as fundamental mechanical properties of the thin films, and therefore, it should be measured precisely for the prediction of mechanical stability. Adhesion of the film to substrate is referred to as mechanical interlocking depending upon interface morphology, thermodynamic state, bond energy, stress, etc. Reference Ohring6 Assessment of adhesion failure using nano-scratch method has recently gained popularity to evaluate critical load of thin films; however, several methods such as tape peeling and abrasive test are reported in the literature much earlier. Reference Lee, Kim and Kim7 Nano-indentation and scratch under ramp loading are now a well-established technique to obtain hardness, Young’s modulus, and adhesive strength of thin films. Reference Oliver and Pharr8,Reference Tian and Liu9 The nature of thin films from soft to brittle character exhibits different failure mechanisms, which can affect the adhesion of films on the substrate. Delamination of thin films can be observed during indentation; the delamination is more prone to occur during the loading segment when the film/substrate interface is relatively weaker when compared to the film and substrate material; however, if the film/substrate interface is strongly bonded, delamination is most probable to occur in the unloading segment. Reference Chen and Bull10
ZnO nanostructured films exhibit a wide direct band gap, high exciton binding energy, high piezoelectric coefficient, sensing properties, and non-toxicity. Reference Znaidi11,Reference Özgür, Alivov, Liu, Teke, Reshchikov, Doğan, Avrutin, Cho and Morkoc12 These properties of ZnO can be exploited for the fabrication of piezoelectronics devices, UV-photo detectors, gas sensors, and dye sensitized solar cells. Reference Klingshirn, Waag, Hoffmann and Geurts13 Dopants such as Ga, Al, In, and N could be used to tailor the optical and piezoelectric properties of ZnO thin films. Reference Klingshirn, Waag, Hoffmann and Geurts13,Reference Lu, Liao, Qi, Liu, Liu, Liang, Zhang and Zhang14 Multi-functionality and diverse properties of ZnO nanostructure have led to continuous development and renewed interests among researchers. Nanostructure of ZnO offers remarkable stability and easily optimized by tailoring microstructure, morphology, and crystallinity using synthesis route and thermal treatments. Reference Hong, Matsushita and Kim15 The commercialization of ZnO based nanostructured devices is heavily dependent on its structural integrity apart from its functional properties. Although the bulk ZnO is considered as a soft material, nevertheless, ZnO thin films exhibit high value hardness and Young’s modulus. Reference Coleman, Bradby, Jagadish, Munroe, Heo, Pearton, Norton, Inoue and Yano16 Mechanical properties of ZnO thin films are size dependent and superior as compared to bulk part. The thermal treatment of films could increase its hardness by reducing its defects. Reference Lai, Lin and Rosmaidah17 The mechanical deformation of bulk ZnO during indentation has shown a discontinuity in load versus displacement curves termed as pop-in event as reported in the literature. Reference Jian18 The pop-in event is also observed in ZnO thin films. The pop-in event is related to the plastic flow in the material, burst out as collection of dislocation in active slip systems. Reference Yau, Tseng, Wen, Tsai and Chou19 However, discontinuity in unloading displacement is called as pop-out. The present study was focused to investigate mechanical failure, pop-in/pop-out, and peel-off in crystalline ZnO thin films deposited on fused quartz. The influence of sputtering deposition pressure on ZnO thin films underlying mechanical properties was measured. Fused quartz is a substrate of commercial interest and it exhibits a hardness of about 9.7 GPa. Reference Tayebi, Polycarpou and Conry20 The soft ZnO films on the hard substrate could lead to the effect of pile-up nearby indenter at larger displacements. The plastic flow of material during indentation is inhibiting by hard substrate, which may ultimately lead to incorrect estimation of hardness. Reference Tayebi, Polycarpou and Conry20 However, the effect of hard substrate on soft ZnO thin films is more pronounced when the displacement of indenter is beyond 20% of film thickness. Hence, the displacement depth should be less than 0.2t (t = thickness of films) during indention. Reference Huang and Chang21 The microstructural features of the ZnO thin films characterized through FE-SEM and AFM are correlated with the measured mechanical properties.
II. EXPERIMENTAL DETAILS
A. Growth condition for c-ZnO thin films
ZnO as thin films was deposited on the fused quartz substrate by using DC sputtering. The deposition was performed in a chamber of 12″ diameter by using 99.99% pure ZnO target. Sputtering target was prepared using 99.99% ZnO powder. Prior to depositions, fused quartz substrates were cleaned using acetone and deionized water using ultrasonic vibrations for 10 min. Further, the substrates are dried in the hot air; the ZnO target and quartz substrate were mounted in a target holder and a substrate holder, respectively. The sputtering chamber was evacuated to 2.0 × 10⁻⁵ Torr to remove gases present in the chamber. Thereafter, high purity Ar/O2 gas was introduced into the chamber. The pre-sputtering was carried out for 10 min to eliminate surface contamination of the target. The argon/oxygen is introduced at 20:5 sccm respectively. The sputtering parameters such as substrate temperature and sputtering power were 100 °C and 50 W, respectively, maintained constant during the deposition. The power density of target is ∼2.4 W/cm2 and erosion depth at racetrack is 0.5–1.0 mm. The sputtering deposition pressure is varied from 5 mTorr to 10 mTorr, 15 mTorr, and 20 mTorr.
B. Structural study and roughness measurement
The crystal structure of thin films was analyzed by the X-ray diffraction (XRD) carried out with Cu Kα radiation using X-ray diffractometer (Smartlab, Rigaku Corporation, Tokyo, Japan). The diffraction data are recorded in the angular range of 25–70°. Thin films consist of nano-grains and its size is calculated by the Debye Scherrers formula as follows: Reference Sagalowicz and Fox22
 $$D = {{k\lambda } \over {\beta \cos \theta }}\quad .$$
λ (Cu Kα) is the wavelength of X-ray incident radiation having peak width β (full width at half maximum of diffraction peak), while ‘k’ is shape factor and θ ‘Bragg’s angle’. However, in Eq. (1), the contribution of non-uniform strain in XRD peak profile is insignificant. Reference Sagalowicz and Fox22 The microstrain is developed during the synthesis process. It is essential to note that microstrain, i.e., deviation from the perfect lattice arrangement present in thin films estimated by X-ray diffraction peak profile using the Stokes Wilson equation, Reference Stokes and Wilson23
 $$\varepsilon = {\beta \over {4\tan \theta }}\quad ,$$
‘β’ and ‘θ’ having their usual meaning as discussed for Eq. (1). The ideal crystal is considered to be perfectly arranged while the crystal structure deviates in thin film from its perfect arrangement due to the presence of lattice imperfection, vacancies, dislocation, grain stacking faults, boundaries, etc.
The dislocation density (δ) termed as length of dislocation lines/volume and obtained by using G.K. Williamson & R.E. Smallman relation. Reference Williamson and Smallman24 The theory suggested that grain boundaries are reduced with higher grain size which could lead to a lower dislocation density calculated by
 $$\delta = {1 \over {{D^2}}}\quad .$$
At the same time, the dislocations per unit volume are supposed to be isotropically distributed in crystal and lie only along the grain boundary.
The volume fraction of the grain boundaries ‘f’ is quantified by assuming the crystallites as a spherical form with diameter ‘D’ and surrounded by the shell of thickness ‘t’ regarding it as the grain boundary, Reference Sun and Froes25
 $$f = 1 - {\left[ {{D \over {D + t}}} \right]^3}\quad ,$$
where ‘f’ is calculated by assuming t = 1 nm and ‘D’ is the crystallite size calculated using XRD peaks. The surface roughness of the samples is analyzed by using atomic force microscopy (AFM; NTEGRA, NT-MDT Spectrum Instruments, Moscow, Russia) operated in semi-contact mode with pyramidal-type geometry of tip having silicon nitride (Si3N4) coating. The data are analyzed using software Nova 1.0.26. The surface roughness of the ZnO thin films is presented as root mean square (RMS) average values. The elemental analysis, thickness, and morphology of thin films are determined by using FE-SEM/EDS (Ultra Plus, Carl Zeiss, Jena, Germany).
C. Nanomechanical measurements
Hardness is the primary mechanical property of the materials, which can be correlated with wear and friction. The Archard’s equation calculates volume loss per sliding distance (Q) as follows:
 $$Q \propto {L \over H}\quad ,$$
where ‘L’ is the applied normal load and ‘H’ is hardness; high hardness will contribute in a lower volume loss, i.e., good wear resistant properties. Reference Ni, Cheng, Lukitsch, Weiner, Lev and Grummon26 Although some exceptions to Eq. (5) also exist, nanostructured thin films are influenced by the number of factors such as grain size, strain, and substrate effect, which affect significantly to mechanical strength. Reference Kolodziejczyk, Szymanski, Batory and Jedrzejczak27
The hardness, effective Young’s modulus, and coefficient of friction of these ZnO thin films are measured by Nanoindentor using Berkovich diamond tip of ∼100 nm radius (TI-950 Triboscan, Hysitron, Minneapolis, Minnesota; load resolution <1 nN, displacement resolution <0.04 nm). Load–displacement profile is a ‘finger print’ of depth sensing mechanical responses of thin films, which provide hardness and Young’s modulus. Nanoindentation measurements were performed continuously in a load controlled mode (50 µN/s; loading rate) in which indenter is moved downward up to a maximum load (400 µN). Before performing indentation, parameters like instrument compliance, thermal drift, indenter geometry, and indentation size effect should be taken care. Reference Fischer-Cripps28 So, it is necessary to calibrate the tip area function and machine compliance which is performed on the standard fused quartz (homogenous and isotropic). Before testing of samples, air calibration is performed on indentation and scratch mode.
The indentation hardness ‘H’ and Young’s modulus of materials are calculated by the Oliver and Pharr method. Reference Oliver and Pharr8 The indentation hardness is calculated by load–displacement curve. The area under the loading–displacement curve is related with the total energy consumed during the whole process. The area under unloading-curve is referred to as elastic deformation energy.
The scratch test of the ZnO films is performed to get frictional forces arising due to the sliding of Berkovich indenter tip on the sample surface. To get the critical load, normal load is applied continuously in a ramp mode, until the films gets peeled-off from the substrate. Reference Tian and Liu9 The normal applied load corresponding to the critical load is referred to as adhesive strength of the thin films. The scratch test is performed by applying a normal load of 0–4000 µN with the normal loading rate of 133.34 µN/s for 30 s. The scratch length was 10 µm (time; 8–38 s) in each test. Several scratch tests are performed to get adhesive strength of the films.
III. RESULT AND DISCUSSION
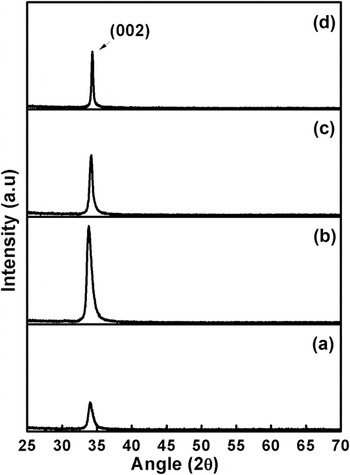
The ZnO thin films were deposited on the fused quartz substrate at different sputtering deposition pressures from 5 mTorr to 10 mTorr, 15 mTorr, and 20 mTorr and shown in Fig. 1. It is evident from Fig. 1 that the films are well crystallized in a hexagonal crystal structure (JCPDS Card-891397) with angle 2θ ∼33.88° range that corresponds to (002) diffraction plane. The XRD patterns reveal that ZnO thin films grow in (002) diffraction plane and maintain (002) peak of thin films throughout all deposition condition used. The evolution of (002) diffraction plane during deposition is reported in the earlier literature as an outcome of surface energy minimization. Reference Bao, Gu and Kuang29,Reference Kim, Yim, Cho, Leem, Lee, Kim, Kim and Son30 However, film growth mechanics is governed by the kinetic energy of incident sputter species to the substrate, adsorption, and ad-atoms surface diffusion. Surface to volume ratio invokes a driving force for the growing grains in particular diffraction plane to achieve thermodynamical stability. The same was suggested by Drift model: a plane with a higher growth rate is more predominant. Reference Van der Drift31 Assuming the tetrahedral configuration, Fujimura calculated the surface energies of ZnO planes and found that the minimum surface energy in (002) plane leads to the growth in columnar fashion. Reference Fujimura, Nishihara, Goto, Xu and Ito32 However, the evolution of different crystal planes that may be feasible during growth depends upon deposition conditions; minimum presence of Zn to ZnO ions in sputter plasma favored the formation of (002) plane. Reference Aita, Purdes, Lad and Funkenbusch33 So, any change in the ratio of Zn to ZnO ions in plasma leads to further growth of films in different crystallographic orientations. The variation in sputtering pressure substantially changes kinetic energy of striking of ad-atoms, which influence the growth mechanics,
 $${d_{\rm{m}}} = 2.33 \times {10^{ - 20}}{T \over {\left( {P{\gamma ^2}} \right)}}\quad ,$$
where d m, T, P, and γ are the notations used for mean free path, temperature, sputtering pressure, and molecular diameter of the sputtering gas, respectively. Reference Dave, Dubey, Gupta and Chandra34 According to Eq. (6), higher sputtering pressure lowers the mean free path facilitating large number of collisions that leads to thermalization effect, which affects the deposition rate. Reference Dave, Dubey, Gupta and Chandra34,Reference Peng, He, Fang and Yang35
XRD pattern of ZnO thin films deposited at (a) 5 mTorr, (b) 10 mTorr, (c) 15 mTorr, and (d) 20 mTorr.

Materials (films and substrate) with different thermal properties could contribute to total strain in the films by deforming the lattice under thermal effect. Thermal expansion coefficients for ZnO are αa = 4 × 10⁻⁶/K and αc = 2.49 × 10⁻⁶/K, while the fused quartz has a thermal expansion coefficient of 0.55 × 10⁻⁶/K. Reference Coleman and Jagadish36 Overall, the growth of films is a complex mechanism and emerged crystallinity is a conjugate function of strain, interface, and surface energy minimization, substrate effect, and deposition parameters.
As in Fig. 1, the angular position of (002) peaks shifts toward higher 2θ side with higher deposition pressure. Concomitantly, peak (002) intensity in XRD pattern rises initially and then falls with higher deposition pressure which leads to the variation in crystallinity. From the full width half maximum, grain size is calculated by using Scherrer’s formula and it varied from 12 nm to 28.9 nm. The peak position, crystal d-spacing, grain size, lattice strain, dislocation density, and grain boundary volume fraction are extracted from (002) diffraction plane and given in Table I. The grain growth is observed with reducing grain boundary volume fraction at higher sputtering pressure. The lattice spacing ‘d’ has varied in the range of 2.64 to 2.60 Å (d ref = 2.6065 Å, JCPDS Card-891397). The lattice spacing in thin films has decreased with the higher deposition pressure, which led to the formation of uniform grains. The lattice strain and dislocation density have also varied with higher sputtering pressure.
Properties of ZnO thin films.

A. Hardness and Young's modulus of ZnO thin films
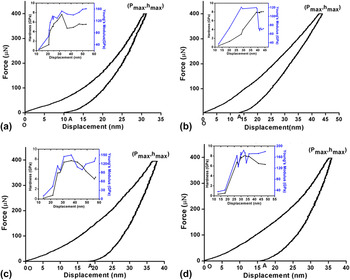
ZnO thin films show anisotropic mechanical properties and vary from polar (c-plane) to non-polar (a-planes & m-planes) planes. Reference Sung, Huang and Chen37 ZnO thin films in polar diffraction plane (002) enables us to investigate the mechanical behavior of films deposited on the fused quartz. The loading–unloading curves of ZnO thin films deposited at different sputtering deposition pressures are shown in Fig. 2. The load–displacement curve directly provides a view of maximum load, displacement, and pop-in events. The load is increasing at constant loading rate; the non-linearity observed in load–displacement curve depends on Berkovich indenter (shape of tip, material of tip), response of thin film to applied stress (elastic as well as plastic), and substrate effect. To achieve the intrinsic properties of thin film material without substrate influence, displacement of indenter should remain ≤t/10, where t is film thickness but this is only effective when film thickness ≥1 µm. Reference Lin, Jeong, Kim and Myoung38
Loading–unloading curves of ZnO thin films deposited at (a) 5 mTorr, (b) 10 mTorr, (c) 15 mTorr, and (d) 20 mTorr.

In the present work, thickness variation is below 1 µm and to preclude the substrate effect, tip rounding effect, and the shallow depth of indentation, indentation was performed below 20% to total thickness. Also, it is visualized from Fig. 2 inset that the load dependent effect on the hardness value, i.e., indentation size effect, is more pronounced at low load indentation and shallow indentation depths. Reference Roy39 The indentation size effect depends upon several factors such as effect of larger strain gradients, work hardening, geometry necessary dislocations, and statistically stored dislocations. Reference Maharaj and Bhushan40 In the present work, the indentation was performed at the same loading rate on different indentation depths. The hardness of the ZnO thin films is increasing up to indentation depth of ∼25 nm; it is attributed as a transition phase between elastic and plastic contacts and after that fully developed plastic zone is formed for actual hardness.
It is evident from Fig. 2 that ZnO thin films are adhering to the substrate without any major discontinuity, and there are no major pop-in event, crack formation, and dislocation burst. Reference Bull41,Reference Patriarche, Glas, Le Roux, Largeau, Mereuta, Ougazzaden and Benchimol42 However, previous studies found pop-in event in bulk single crystal ZnO as well as ZnO thin films due to pre-existing defects and strain energy of films. Reference Navamathavan, Kim, Hwang, Park, Hahn, Lee and Kim43 A localized stress is developed beneath the indenter after elastic deformation and the presence of serrations in load displacement curve depicts shear band nucleation and propagation, which could lead to plastic deformation.
The nature of serration in load–displacement curve is loading rate dependent as it is pronounced more at a low loading rate. Reference Schuh, Nieh and Kawamura44 If the loading rate is slow, discrete shear bands have enough time to accommodate its effect at applied strain leading to distinct strain burst. When the loading rate is increased, the multiple shear bands activated simultaneously might have different deformations with lesser or no serrations. Reference Misra, Sohn, Kim and Kim45 Even in previous studies on ZnO thin films, the multiple pop-in event occurs depending upon the loading rate, and the threshold value for multiple discontinuity is increased at a higher loading rate in ZnO. Reference Kucheyev, Bradby, Williams, Jagadish and Swain46 Also, the enhanced hardness is reported at a higher loading rate for ZnO thin films. Reference Fang, Chang and Lin47
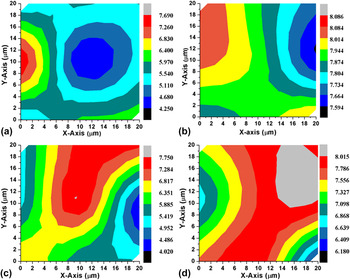
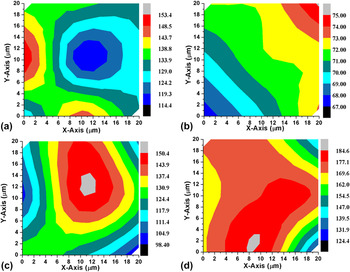
Discontinuity persists in displacement curve which is minor if it has a magnitude less than 2 nm at the same loading environment. Reference Li, Van Vliet, Zhu, Yip and Suresh48 This minor discontinuity correlated the existence of a single event of slip or dislocation movement in the thin films. For the reliability of results, at least 10 indents on each sample were performed. The indents are performed in 20 × 20 µm matrix to configure contour map and provide a view of mechanical response of each indent. The map can correlate in a comprehensive way to hardness and Young’s modulus analysis at different microstructure regions in an area of 400 µm as shown in Fig. 3 and Fig. 4. As observed from atomic force microscopy that each grain is oriented uniquely at surface, which can be visualized by the interacting force; similarly, each region exhibits a different mechanical response during indentation as shown by the color filled contour map. Reference Gayle and Cook49
Hardness map of ZnO thin films deposited at (a) 5 mTorr, (b) 10 mTorr, (c) 15 mTorr, and (d) 20 mTorr.

Young’s modulus map of ZnO thin films deposited at (a) 5 mTorr, (b) 10 mTorr, (c) 15 mTorr, and (d) 20 mTorr.

The hardness of thin films along with Young’s modulus is given after multicurve analysis in Table II. The deposition pressure affects microstructure and crystallinity of thin films that can be correlated with underlying mechanical properties. In this connection, single crystalline a-plane bulk ZnO and c-plane oriented bulk ZnO having different hardness values and Young’s moduli of 2.2 ± 0.2 GPa, 163 ± 6 GPa, and 4.8 ± 0.2 GPa and 143 ± 6 GPa, respectively. Reference Coleman, Bradby, Jagadish, Munroe, Heo, Pearton, Norton, Inoue and Yano16 ZnO is a soft material in bulk but thin films have high hardness of 6–10 GPa. Reference Coleman, Bradby, Jagadish, Munroe, Heo, Pearton, Norton, Inoue and Yano16,Reference Sung, Huang and Chen37,Reference Navamathavan, Kim, Hwang, Park, Hahn, Lee and Kim43 The plastic deformation in crystalline material primarily depends on the slip events and dislocation movements. Bulk oxides are usually prone to brittle failure but the ductility can be induced by refining grain size to nanometers in thin films.
Mechanical parameter and roughness of films.

The increment in hardness is contributed by the morphology, dislocation mechanisms, strain, and grain size of thin films. Reference Musil50 Even the strain compensation sites and threading dislocations can impede the slip movement, which increases the hardness of thin films. Reference Navamathavan, Kim, Hwang, Park, Hahn, Lee and Kim43 The maximum hardness achieved for the films deposited at 10 mTorr is attributed to the highest crystallinity in polar plane, considered as a hard plane in ZnO. Reference Coleman, Bradby, Jagadish, Munroe, Heo, Pearton, Norton, Inoue and Yano16,Reference Sung, Huang and Chen37 With the decrease in crystallinity, the hardness also drops to a lower value. Young’s modulus (164.03 ± 18.33 GPa) and high hardness value (7.51 ± 0.60 GPa) are observed for the films deposited at 20 mTorr deposition conditions.
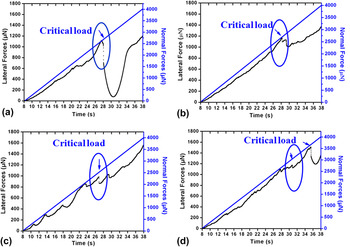
Frictional forces are governed by adhesive and plowing forces during scratch. The adhesive force is experienced during initial interaction during scratch, while the force needed to deform the material is plowing force. The adhesion is pronounced when indenter applies interfacial shear stress to a critical value to detach films from substrate, primarily depending upon bonding between film-substrate, thickness of the film, tip radius, coefficient of friction, interfacial stress, and contact mechanics of indenter to films. Reference Blees, Winkelman, Balkenende and Den Toonder51,Reference Deyneka-Dupriez, Herr, Fecht, Pfrang, Schimmel, Reznik and Gerthsen52 The increment in hardness of substrate increases the critical shear stress required for delamination of the films. Reference Blees, Winkelman, Balkenende and Den Toonder51
According to the energy balance theory by Laugier, Reference Deyneka-Dupriez, Herr, Fecht, Pfrang, Schimmel, Reznik and Gerthsen52 the energy required to create a new surface must be lower than the released stored elastic energy assuming that films are relaxed after detaching. During the scratch testing, a prescribed normal force is applied in perpendicular direction on thin films with transverse motion using Berkovich indenter; the lateral forces are stored as frictional energy. During ramp scratch mode, plowing force induces plastic deformation in materials, which is affected by grains, grain boundaries, and surface topography. A sudden discontinuity in the lateral forces indicates that the films are peeled-off as shown in Fig. 5. Normal load is termed as critical load of the coatings at which this sudden dropdown in lateral forces occurs. So, normal load needed for delamination of films is termed as adhesive strength of the thin films. However, it is also reported that the crack initiation starts at a lower critical load but it does not indicate complete failure of films. At some higher value of normal load, the film is completely peeled off, referred to as upper critical load. Fracture toughness exhibited a dependence on the critical load and proportional to the lower critical load, as well as the difference between the upper and lower critical loads. Reference Zhang, Sun, Fu and Du53 During the scratch, buckling and peeling are observed. The horizontal force needed for delamination depends on several factors such as hardness of film/substrate, shear force per unit area, and shear stress at interface microstructure and crystal structure. Reference Benjamin and Weaver54
Frictional forces of ZnO thin films deposited at (a) 5 mTorr, (b) 10 mTorr, (c) 15 mTorr, and (d) 20 mTorr.

The smooth lateral force curve indicates high scratch resistance before delamination and high adhesive strength (3043.9 µN) in the films deposited at 20 mTorr, caused by low internal stress, higher grain size, and high hardness of ZnO thin films. The variations in adhesive strength in terms of critical load depend upon the surface topography as well as the microstructure. The critical load is given in Table II.
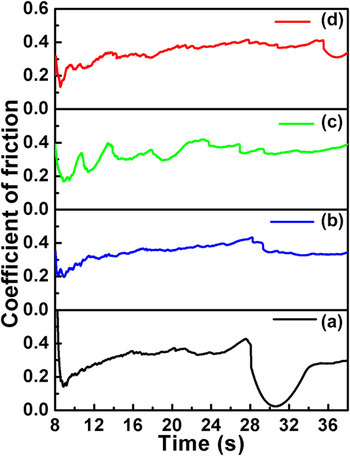
The coefficient of friction is analyzed at increasing normal load shown in Fig. 6. It is the ratio of lateral forces and normal forces during scratch. Reference Jian, Teng, Yang, Lai, Lu, Chang and Ju55 The frictional forces arise by the contact mechanics between two solid bodies, indenter and thin films. The stress distribution beneath indenter caused to plastic flow and events like initiation of crack, propagation of cracks, and fragmentation of material could occur and appear as oscillation in Fig. 6. The friction coefficient gently increases at the beginning of scratch under the influence of plowing force and attains a steady value before any discontinuity. All the films having a low coefficient of friction in the beginning due to lower plowing force contribute less significantly during scratch. However, discontinuity or bursts can be observed in coefficient of friction at the critical load of the thin films. The minor discontinuity can be seen in coefficient of friction, during initial stage of scratch, due to the difference in scratch resistance at grain boundaries. Reference Bhushan and Li56 The coefficient of friction lies between 0.2 and 0.4 having similar result with previous reports. Reference Jian, Teng, Yang, Lai, Lu, Chang and Ju55
Coefficient of friction of ZnO thin films deposited at (a) 5 mTorr, (b) 10 mTorr, (c) 15 mTorr, and (d) 20 mTorr.

B. Surface and thickness analysis
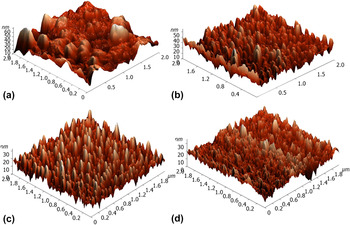
The surface topography of thin films was investigated by using atomic force microscopy in tapping mode, under the scanning area of 2 × 2 µm shown in Fig. 7. Surface asperities of the films affect the contact mechanics between indenter and films. The nano-indentation process is depth and surface sensitive process, and for the precise measurement, plastic zone should be fully developed. The sputtering deposition pressure strongly influences microstructure as well as the topography. At lower sputtering pressure, the grains agglomerated show high RMS roughness. With the increasing deposition pressure, surface topography has become smooth and uniformly distributed with the columnar type topography. The maximum height of surface particles is also reduced with higher deposition pressure shown in Fig. 7. The RMS roughness of films is given in Table II. The grain size of ZnO thin films observed by AFM and XRD may vary; actually the grain size in XRD depends on coherency of grains that gives a diffracted signal for measurement. While in AFM, the tip is in direct contact with the surface of the sample.
AFM images of ZnO thin films deposited at (a) 5 mTorr, (b) 10 mTorr, (c) 15 mTorr, and (d) 20 mTorr.

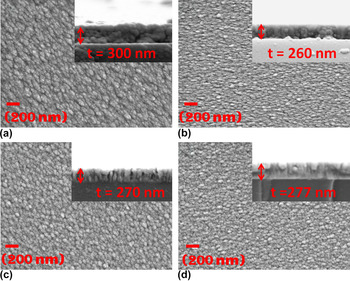
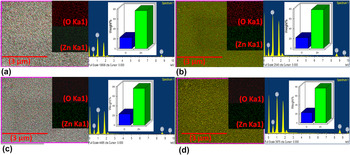
The thickness for ZnO thin films is varied between 260 nm and 300 nm as evident from Fig. 8. The grown films are uniformly distributed throughout the interface and oriented normal to the substrate in columnar fashion. It can be visualized that the film grown at 20 mTorr sputtering pressure is densely packed and there is no evidence of voids and crack. As the sputtering pressure is increased, the lateral grain becomes more elongated and aligns to the normal of substrate. The surface morphology of ZnO thin films at different deposition pressures is shown in Fig. 8. The sputtering pressure affects morphology of the films in terms of grains growth as well as the shape of grains. At low sputtering pressure, bigger grains are observed with a heterogeneous nature of interfacial properties as shown in Fig. 8(a). However, the distribution of grains is uniform and homogeneous at higher working pressure, which depends upon adatoms mobility and surface diffusion. Reference Thornton57 The ZnO thin films have dense morphology at 20 mTorr resulting in high adhesive strength. The EDS mapping and EDS spectra is performed to ensure film purity and chemical composition as shown in Fig. 9. The EDS mapping suggests the uniform distribution of Zn and O elements in ZnO thin film area. The presence of peak ∼1.0 keV and ∼0.57 keV in the EDS spectrum is related to Zn and O elements, respectively. The Zn and O atomic percentage is given in Table II. The ZnO thin films are oxygen rich; however, the fused quartz substrate can contribute to the quantification of O weight percentage as given in Fig. 9. The SEM and XRD results of thin films are in accordance with each other and found to be crystalline and columnar growth at higher sputtering pressure.
FESEM images of ZnO thin films deposited at (a) 5 mTorr, (b) 10 mTorr, (c) 15 mTorr, and (d) 20 mTorr.

EDS mapping of ZnO thin films deposited at (a) 5 mTorr, (b) 10 mTorr, (c) 15 mTorr, and (d) 20 mTorr.

IV. CONCLUSION
DC sputtering was used to deposit highly crystalline growth ZnO thin films on the quartz substrate. The mechanical properties of films are investigated by the nanoindentation technique. The following conclusions are made based on the present work.
-
(1) The c-ZnO thin films were successfully grown on the fused quartz substrate at deposition pressure 5 mTorr to 10 mTorr, 15 mTorr, and 20 mTorr using DC-sputtering. The grain size and crystallinity affect the deformation behavior of ZnO thin films.
-
(2) The increment in grain size and reduction of lattice strain were observed for the ZnO films deposited at higher deposition pressure. Also, crystalline quality of films rises initially and after that, it deteriorates with deposition pressure.
-
(3) The surface morphology of the films was observed as densely packed, crack free, and the grains elongated toward the normal of substrate with the increasing deposition pressure. The RMS roughness of ZnO thin films has reduced to achieve a smoother surface with denser and uniform grains at high working pressure.
-
(4) There is no evidence for major discontinuity (pop-in/pop-out) persists in the load–displacement curve, revealed better adherence to substrate, and ruled out the possibility of cracking and rupture of film during indentation.
-
(5) ZnO thin films deposited at 20 mTorr exhibited minimum lattice strain (1.35 × 10⁻⁴) and higher grain size (28.9 nm) leads to better mechanical properties, i.e., high value of hardness (7.51 ± 0.60 GPa) with a better adhesive strength (3043.9 µN) and maximum Young’s modulus (164.03 ± 18.33 GPa).
ACKNOWLEDGMENTS
The authors would like to thank Prof. Ramesh Chandra for providing sputtering facility at Institute Instrumentation Center, IIT Roorkee, India.