I. INTRODUCTION
Semiconductor nanoparticles (NPs) have received widespread attention in recent years for their size-tunable ultraviolet (UV)-to-near infrared (NIR) light emission governed by the quantum confinement effect. These photoluminescent particles, with size-tunable, narrow emission and broad absorption spectra, have been exploited in numerous applications, including in light-emitting/harvesting devicesReference Baxter and Aydil1, Reference Plass, Pelet, Krueger, Gratzel and Bach2 and as handles for biomedical tracking and imaging.Reference Gao, Cui, Levenson, Chung and Nie3, Reference Park, Gu, von Maltzahn, Ruoslahti, Bhatia and Sailor4 Although predominantly, direct band gap semiconductor NPs, i.e., quantum dots (QDs), have thrived in semiconductor NP synthesis and application studies, attention has more recently turned toward the development of potentially less toxic, particularly relative to II–VI Cd- and Pb-based QDs, Si NP fluorophores after the observation of efficient visible photoluminescence (PL) from porous silicon containing nanometer-sized Si domains in the 1990s.Reference Canham5 Observation of efficient visible PL from nanometer-sized, indirect band gap Si has been attributed to relaxation of the momentum-forbidden radiative exciton recombination across the indirect band gap with increased certainty in carrier position on the nanoscale.Reference Alivisatos6, Reference Belyakov, Burdov, Lockwood and Meldrum7
Despite potential toxicity and compatibility advantages in using fluorescent Si NPs over CdQ and PbQ (Q = S, Se, Te) QDs in both devices (e.g., solely Si-based optoelectronics)Reference Green, Zhao, Wang, Reece and Gal8–Reference Walters, Bourianoff and Atwater10 and biomedical applications,Reference Park, Gu, von Maltzahn, Ruoslahti, Bhatia and Sailor4, Reference Derfus, Chan and Bhatia11, Reference Erogbogbo, Yong, Roy, Hu, Law, Zhao, Ding, Wu, Kumar, Swihart and Prasad12 synthetic control over Si NP emission color and quantum yield (QY) is poor relative to II–VI QDs, and emission wave length is not always correlated with particle size according to expectations of quantum confinement.Reference Belyakov, Burdov, Lockwood and Meldrum7, Reference Manhat, Brown, Black, Ross, Fichter, Vu, Richman and Goforth13–Reference Warner, Rubinsztein-Dunlop and Tilley16 Not only is it expected that biological organisms would exhibit a greater tolerance to Si NPs over CdQ and PbQ QDs, but other advantages of Si NPs over CdQ and PbQ QDs include: the ability to form robust covalent surface bonds to Si for surface modification versus weaker dative bonds for II–VI QDsReference Buriak17, Reference Aldana, Wang and Peng18 and a viable mechanism of biological clearance for Si NPs (decomposition and renal clearance of hydrolyzed Si NPs as silicic acid)Reference Park, Gu, von Maltzahn, Ruoslahti, Bhatia and Sailor4, Reference Canham19, Reference Popplewell, King, Day, Ackrill, Fifield, Cresswell, Di Tada and Liu20 versus bioaccumulation and/or cytotoxicity for CdQ and PbQ QDs.Reference Derfus, Chan and Bhatia11, Reference Erogbogbo, Yong, Roy, Hu, Law, Zhao, Ding, Wu, Kumar, Swihart and Prasad12, Reference He, Kang, Li, Tsang, Fan and Lee21 Nonetheless, because of the possibility of radiative events occurring from both delocalized core states (i.e., quantum confinement related emission) and from localized surface defect or other trap states (e.g., at the Si NP/ligand or Si NP–surface oxide interface),Reference Rosso-Vasic, Spruijt, Popovic, Overgaag, van Lagen, Grandidier, Vanmaekelbergh, Dominguez-Gutierrez, De Cola and Zuilhof14, Reference Hessel, Henderson, Kelly, Cavell, Sham and Veinot22–Reference de Boer, Timmerman, Dohnalova, Yassievich, Zhang, Buma and Gregorkiewicz28 Si NP emission dominated by core states alone is difficult to achieve, emission QYs are generally low, and polychromatic emission (e.g., having two or more distinct emission events)Reference Bley, Kauzlarich, Davis and Lee23–Reference Chao, Houlton, Horrocks, Hunt, Poolton, Yang and Siller31 is frequently observed. Both theoreticalReference Zhou, Brus and Friesner32, Reference Wang, Zhang, Niehaus and Frauenheim33 and experimentalReference Hessel, Henderson, Kelly, Cavell, Sham and Veinot22, Reference Godefroo, Hayne, Jivanescu, Stesmans, Zacharias, Lebedev, Van Tendeloo and Moshchalkov26, Reference de Boer, Timmerman, Dohnalova, Yassievich, Zhang, Buma and Gregorkiewicz28, Reference Liu34 reports support the hypothesis that surface and/or defect states, in addition to quantum-confined states, significantly influence the observed emission properties of Si NPs, whether they are freestanding in solution or embedded in solid hosts (e.g., in porous silicon).
To overcome the challenges in emission wave length and efficiency control in Si NPs, it is desirable to identify and mitigate pathways leading to defect-related emission, which should provide synthetic strategies for emission property tuning to allow the size-dependent core state emission pathway to dominate the observed optical properties. This is particularly important for biomedical applications of Si NPs since narrow, resolvable emission in the red-to-NIR spectral region is necessary for avoiding cellular autofluorescence interference of the Si NP signal, as well as tissue penetration limitations, and since unstable emission characteristics (including, color and QY) would result in loss of information. To date, Si NPs have been synthesized with relatively high emission QYs (10–70% absolute QYs),Reference Rosso-Vasic, Spruijt, van Lagen, De Cola and Zuilhof35–Reference Jurbergs, Rogojina, Mangolini and Kortshagen38 and quantum confinement related emission spanning the entire visible spectrum has also been observed in a few reports.Reference Kang, Liu, Tsang, Ma, Fan, Wong and Lee39–Reference Li, He, Talukdar and Swihart44 Numerous publications have reported red-to-NIR (600–800 nm)-emitting hydrophobic Si NPs 3–10 nm in diameter with suitable optical but unsuitable miscibility properties for biomedical fluorescence assays. However, when Si NPs are surface oxidized to allow dispersion in water, a strong blue (400–500 nm) emission color is frequently observed,Reference Manhat, Brown, Black, Ross, Fichter, Vu, Richman and Goforth13, Reference Shiohara, Hanada, Prabakar, Fujioka, Lim, Yamamoto, Northcote and Tilley15, Reference Warner, Rubinsztein-Dunlop and Tilley16, Reference Zhang, Neiner, Wang, Louie and Kauzlarich45–Reference Tilley and Yamamoto49 even for aqueous samples having the same or similar sizes and size distributions as the red-emitting hydrophobic particles.Reference Manhat, Brown, Black, Ross, Fichter, Vu, Richman and Goforth13, Reference Shiohara, Hanada, Prabakar, Fujioka, Lim, Yamamoto, Northcote and Tilley15, Reference Zhang, Neiner, Wang, Louie and Kauzlarich45, Reference Lin and Chen47
Several recent reports have attributed blue emission only or blue emission alongside other redder emission events to localized Si–O surface states lying outside the band gap,Reference Yang, Li, Cao, Zeng and Cai27, Reference de Boer, Timmerman, Dohnalova, Yassievich, Zhang, Buma and Gregorkiewicz28, Reference Brewer and Von Haeften50 which is consistent with the frequent observation of blue emission only for Si NPs in water due to the possibility of passivation of unreacted Si surface sites by OH− or H2O. Furthermore, while it is expected that ultrasmall 1–2 nm quantum-confined Si NPs should emit blue,Reference Tilley, Warner, Yamamoto, Matsui and Fujimori51 the observation of blue emission from larger Si particles close to the bulk Si Bohr exciton radius (∼4 nm)Reference Kang, Liu, Tsang, Ma, Fan, Wong and Lee39, Reference Tilley, Warner, Yamamoto, Matsui and Fujimori51, Reference Wilcoxon, Samara and Provencio52 is unexpected according to quantum confinement expectations. Thus, the many examples of 4–5 nm, blue-emitting, aqueous Si NPs that have been reported to dateReference Manhat, Brown, Black, Ross, Fichter, Vu, Richman and Goforth13, Reference Shiohara, Hanada, Prabakar, Fujioka, Lim, Yamamoto, Northcote and Tilley15, Reference Zhang, Neiner, Wang, Louie and Kauzlarich45, Reference Lin and Chen47 also support the origin of aqueous blue emission as arising from Si–O surface states outside the band gap. Researchers have previously attributed localized Si–O states to self-trapped luminescent centers (also called self-trapped excitons) with direct excitation and emission abilityReference Liu34, Reference Allan, Delerue and Lannoo53 or to sites where photogenerated core excitons can decay radiatively or nonradiatively.Reference Yang, Li, Cao, Zeng and Cai27, Reference Ray, Sarkar, Bandyopadhyay, Hossain and Pramanick54, Reference Qin, Song, Zhang, Lin, Duan and Yao55 Regardless of what role the localized surface state plays, emission from localized states is generally accepted to be much faster than radiative exciton recombination and thus would dominate due to the relatively faster timescale of the surface state decay (ns–ps) versus the core state decay (μs–ns) process.Reference de Boer, Timmerman, Dohnalova, Yassievich, Zhang, Buma and Gregorkiewicz28
Several observations of stable, red-to-NIR-emitting, aqueous Si NPs have been reported,Reference Park, Gu, von Maltzahn, Ruoslahti, Bhatia and Sailor4, Reference Erogbogbo, Yong, Roy, Hu, Law, Zhao, Ding, Wu, Kumar, Swihart and Prasad12, Reference He, Kang, Li, Tsang, Fan and Lee21, Reference Vincent, Maurice, Paquez, Sublemontier, Leconte, Guillois, Reynaud, Herlin-Boime, Raccurt and Tardif29, Reference Kang, Liu, Tsang, Ma, Fan, Wong and Lee39, Reference Li and Ruckenstein56–Reference Erogbogbo, Tien, Chang, Yong, Law, Ding, Roy, Swihart and Prasad59 and most of these describe steps to modify the surface of the Si NP core to protect it from further undesirable passivation or oxidation. One method of surface modification is the conversion of Si NPs to Si NP/SiOxHy core–shell structures.Reference Park, Gu, von Maltzahn, Ruoslahti, Bhatia and Sailor4, Reference Vincent, Maurice, Paquez, Sublemontier, Leconte, Guillois, Reynaud, Herlin-Boime, Raccurt and Tardif29, Reference Kang, Liu, Tsang, Ma, Fan, Wong and Lee39 These methods result in a size-tunable (and consequently, an emission wave length-tunable) Si NP core with a uniformly grown oxide shell that is shown to provide stable surface and PL characteristics. The oxide shell also confers water solubility on the Si NPs and apparently preserves red-to-NIR PL with maximum emission wave lengths as high as 750–850 nm.Reference Park, Gu, von Maltzahn, Ruoslahti, Bhatia and Sailor4 Unfortunately, the red-to-NIR emission properties are not always stable with respect to time, and certain Si NP/SiOxHy core–shell structures exhibit a blueshifted emission (λmax,em= 430 nm) with a slow onset.Reference Vincent, Maurice, Paquez, Sublemontier, Leconte, Guillois, Reynaud, Herlin-Boime, Raccurt and Tardif29
Others seeking to preserve red emission in water have used various surface stabilizing agents to better protect the Si NP surfaces from further undesired surface passivation. Kravitz et al.Reference Kravitz, Kamyshny, Gedanken and Magdassi57 have prepared Si NPs via a solid-state synthesis from commercial amorphous nanosilica in the presence of magnesium powder, and these particles were subsequently dispersed in water using poly(vinyl pyrrolidone) (PVP; 13,000–23,000 MW) to confer water solubility and to stabilize the particle surfaces. The red emission at λmax = 710 nm observed from the neat PVP-coated Si powders was apparently maintained in poly(vinyl alcohol)/water dispersions for some time; however, the study does not comment on the temporal behavior of the PL. Li and RuckensteinReference Li and Ruckenstein56 reported that Si NPs prepared via CO2 laser-induced pyrolysis of silane, followed by a HF/HNO3 etch, can be coated using poly(acrylic acid) (PAA) through a graft polymerization of 10 wt% acrylic acid under intense UV irradiation. The PAA coating around the Si NPs helped to preserve 80% of the emission intensity at λmax = 605 nm for 1 wk in water. The authors concluded that PAA provided an insulating barrier between the Si NP surfaces and the water molecules, temporarily preventing water passivation of the Si NP surface. He et al.Reference He, Kang, Li, Tsang, Fan and Lee21 have also used PAA to modify the surface of hydride-terminated Si NPs (H-Si NPs) prepared electrochemically. However, rather than coating the Si NPs with PAA directly, the as-prepared H-Si NPs first underwent hydrosilylation with monomers of acrylic acid and then were coated with PAA. This method takes advantage of the ability of Si NPs to form stable covalent bonds with unsaturated hydrocarbons, such as biocompatible acrylic acid, and further cross-linking with PAA, to better protect the Si NPs from further undesirable surface passivation while apparently preserving red emission (λmax= 595 nm) in water for up to 6 mo.
Herein, we report a new synthetic method to produce stable, red-emitting, aqueous Si NPs that retain their red emission (λmax = 580 nm or λmax = 740 nm when correcting for wave length sensitivity of our photomultiplier tube detector) for longer than 6 mo in aqueous solutions of pH ≤ 7. The method involves solid-state synthesis of Si NPs, followed by a wet chemical etch and hydrophobic workup, and subsequently phase transfer of decane-terminated Si NPs into aqueous media through alkyl chain self-assembly via the surfactant cetyltrimethylammonium bromide (CTAB). The hydrophobic tail of CTAB is capable of intercalating within the long hydrocarbon chains on the surfaces of the Si NPs, thus forming a micellar structure around the Si NPs that allows stable dispersion in water via the quaternary ammonium head groups and retention of the red PL via hydrophobic protection against further undesirable surface passivation. Additionally, these CTAB-coated decane-terminated Si NPs can be further wrapped with PAA polymer, which imparts a more ideal negative surface charge (for biological applications, over a wide pH range) and provides reactive carboxylic acid groups for bioconjugation. The consequence of protecting the Si NP surfaces against further undesirable Si–OH passivation in preserving the aqueous red emission of Si NPs is demonstrated by the destruction of the micelles in high pH solution (pH ≥ 8), which is commensurate with the observation of strong blue PL, loss of red PL, and increased Si–OH and Si–OH2 bonding features. We also demonstrate the facile uptake of these red-emitting Si NPs into live neuroblastoma cells with the preservation of the photophysical properties and observe an even distribution of the red emission from the Si NPs throughout the cytoplasm.
II. EXPERIMENTAL
A. Materials
Some synthetic procedures were performed under inert (argon or nitrogen) atmosphere on a Schlenk line, using standard air-free techniques, where specified. Other steps, including etching, phase transfer, and aqueous workups, were done in air. Electrophoretically pure water (nanopure water, >18 MΩ·cm resistivity) was used for preparing all aqueous solutions. Trichlorosilane (HSiCl3, ≥98%; Alfa Aesar, Ward Hill, MA), 1-decene [CH3(CH2)7CH = CH2, ≥97%; Aldrich, St. Louis, MO], CTAB [CH3(CH2)15N(CH3)3]Br, ≥99%; Fisher], PAA sodium salt [(C3H3NaO2)n, MW: 6000, moisture: <10%], and aqueous hydrofluoric acid [HF(aq), 48.0–51.0%] were purchased from Fisher Scientific (Fisher Science Education, Hanover Park, IL) and used as received, with the exception of the polymer salt. Prior to use, 2 g of the PAA sodium salt was dissolved in 150 mL of 12 N NaOH; the aqueous polymer solution was then dialyzed against nanopure water using 1000 Da MWCO dialysis tubing (regenerated cellulose; Fisher Brand). Following dialysis, the retentate solution underwent rotary evaporation to obtain dried, purified PAA. For cellular studies, DMEM, Opti-MEM, and fetal bovine serum (FBS) solutions were purchased from Invitrogen/Life Technologies, Grand Island, NY.
B. Synthesis of water-soluble red-emitting Si NPs
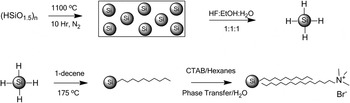
A sol–gel polymer of putative stoichiometry (HSiO1.5)n was prepared by hydrolysis and polycondensation of trichlorosilane (5 mL), as previously reported.Reference Henderson, Kelly and Veinot60 This solid precursor (0.9 g) was subsequently annealed at 1100 °C under flowing N2 in a horizontal tube furnace (Lindberg Blue, Model TF55035A, Lindberg Scientific, Asheville, NC) for 10 h to generate nanocrystalline silicon (Si NCs) encapsulated in SiO2 matrix. The Si NC/SiO2 powder was then ball milled under ambient atmosphere for 10 s using a tungsten carbide lined milling vial with two 1-cm tungsten carbide balls and a Spex 8000M mill mixer (SPEX SamplePrep, Metuchen, NJ). H-Si NPs were liberated from the mechanically milled matrix (∼0.5 g) by a 60-min chemical etch using a 15 mL solution of 1:1:1 (by volume) ethanol/water/HF (aq), according to a literature method.Reference Hessel, Henderson and Veinot40 Following the extraction of red-emitting H-Si NPs into pentane (∼40 mL), decane-capped Si NPs (Dec-Si NPs) were prepared by thermal hydrosilylation by refluxing the H-Si NPs in 3 mL of neat 1-decene under Ar gas for 18 h. Hexane was used to disperse the Dec-Si NPs, and rotary evaporation was used to remove excess capping agent and hexane. Water-soluble, red-emitting Si NPs were prepared from the red-emitting, decane-terminated Si NPs by coating with CTAB and/or coating with CTAB followed by wrapping with PAA, as described below. The synthesis of CTAB-coated/decane-terminated Si NPs from hydrolyzed trichlorosilane [i.e., (HSiO1.5)n polymer] is outlined in Scheme 1.
Synthetic procedure for the preparation of stable, aqueous, red-emitting, CTAB-coated/decane-terminated silicon nanoparticles.

CTAB-coated, decane-terminated Si NPs (CTAB/Dec-Si NPs or CTAB/Dec-Si NP micelles) were prepared by loading 0.073 g (0.2 mmol) of CTAB into an air-free, two-neck, round-bottomed flask to which 3 mL of decane-terminated Si NPs in hexanes were transferred. The reaction vessel was sonicated for 30 min, and the contents were subsequently dried under dynamic vacuum for 8 h. After transferring 3.5 mL of water into the flask, the sample was sonicated for 90 min in a 50 °C water bath to obtain aqueous, red-emitting CTAB/Dec-Si NPs. The aqueous layer containing the CTAB/Dec-Si NPs was dialyzed against nanopure water using 1000 Da MWCO dialysis tubing to remove excess CTAB; the measured pH values of aqueous CTAB/Dec-Si NP samples following dialysis were 6.5 ± 0.5. We have observed that the amount of CTAB required for aqueous nanocrystal stabilization (i.e., colloidal stabilization) is variable, depending on whether larger or smaller micelles are desired. We have been able to produce aqueous, single Si NPs using variations of the method presented in this work, using a smaller excess of CTAB.
PAA-wrapped/CTAB-coated/decane-terminated Si NPs (PAA/CTAB/Dec-Si NPs) were prepared by dissolving 0.05 g of dried, purified PAA in 10 mL of water to form a PAA solution. Under ambient conditions, an aqueous CTAB/Dec-Si NP solution (0.2 mL) was transferred into a two-neck, round-bottomed flask and 2 mL of the PAA solution was added. The resulting solution was stirred for 10 min to generate the PAA/CTAB/Dec-Si NPs. To remove excess PAA, the aqueous Si NP solution was dialyzed against nanopure water using 1000 Da MWCO dialysis tubing for 24 h.
C. Characterization of water-soluble, red-emitting Si NPs and Si NP synthetic intermediates
1. In situ powder x-ray diffraction studies of solid-state precursor
The sol–gel hydrosilicate (HSiO1.5)n(0.10 g) was loaded onto a Pt sample holder and pressed flat before loading into the instrument’s furnace for annealing (under vacuum atmosphere). Data were collected at 30 °C, and the sample was then heated to 200 °C at 20 °C/min. The temperature of the stage was increased in 200 °C intervals at a heating rate of 20 °C/min and held at a given temperature (200, 400, 600, 800, or 1000 °C) for 1 h prior to the powder x-ray diffraction (PXRD) scan (30 min). The temperature of the stage was then further increased in 100 °C intervals at a heating rate of 20 °C/min and held at a given temperature (1100, 1200, 1300, or 1400 °C) for 1 h prior to the PXRD scan (30 min). Data were collected from 10° to 60° 2 theta on a Rigaku Ultima IV x-ray diffraction system (Rigaku Americas, The Woodlands, TX) in parallel beam geometry.
2. Characterization by transmission electron microscopy equipped with energy dispersive x-ray spectroscopy, Raman spectroscopy, and dynamic light scattering
Size, composition, and morphology analyses of Si NP colloids were done by transmission electron microscopy (TEM), energy dispersive x-ray (EDX) spectroscopy, Raman spectroscopy, and dynamic light scattering (DLS). TEM and EDX were performed on a FEI Tecnai F-20 TEM (North America NanoPort, Hillsboro, OR) operating at 200 kV. Aqueous samples were prepared by drop casting concentrated solutions of purified (as described in synthesis section) Si NPs in phosphate buffered saline (PBS, pH = 7.4) onto 400 mesh holey carbon-coated Cu grids (Ted Pella, Redding, CA), which were dried in air at 100 °C overnight prior to imaging. Point EDX spectra (collection time = 30–180 s) were collected on several spots within the same CTAB/Dec-Si NP micelle, as well as on several other micelles on the same TEM grid. High resolution-TEM (HR-TEM) was performed on the same instrument, and the d-spacing reported herein is calculated from the intensity profile of a single Si NP (five spacings were averaged) within a micelle. Raman spectroscopy was performed on a J-Y Lab RAM HR800 UV micro-Raman spectrometer (Jobin-Yvon/Horiba Scientific, Edison, NJ) using laser excitation at 532 nm. Samples were prepared by drop casting concentrated, aqueous solutions of purified CTAB/Dec-Si NPs onto carbon tape adhered to glass slides. Sample films were deposited in air. DLS measurements were done on the aqueous Si NP colloids using a Horiba LB-550 DLS instrument (Horiba, Edison, NJ). Purified samples were diluted in syringe-filtered nanopure water for measurement, and measurements were taken on serially diluted samples to ensure that size measurements were independent of multiple scattering effects.
3. Characterization by Fourier transform infrared spectroscopy and gel electrophoresis
To examine Si NP surfaces, Fourier transform infrared (FTIR) spectroscopy was performed on a ThermoFisher Nicolet iS10 infrared spectrometer (Thermo Scientific, Madison, WI) in reflection geometry using a single bounce diamond attenuated total reflectance (ATR) accessory. Purified, concentrated colloids of the Si NPs were drop cast and evaporated onto the ATR crystal to deposit a sample film for analysis. Gel electrophoresis was used to qualitatively determine the Si NP surface charge after CTAB coating or CTAB coating/PAA wrapping steps. An agarose gel (0.2% by weight) was made using TBE buffer (90 mM Tris, 90 mM borate, 4 mM ethylenediaminetetraacetic acid) at pH 8.17 with 200 mM NaCl to enhance ionic strength. CTAB/Dec-Si NP and PAA/CTAB/Dec-Si NP solutions of different volumes (1–10 μL) were mixed with 5 μL of 50 wt% aqueous glycerol, and the samples of varying concentration and surface charge were loaded into the wells in the center of the gel. Gels were run at 65 V for 1 h and were photographed under a 302-nm light source.
4. Steady-state PL spectroscopy and QY measurements
The emission properties of all Si NP colloids (H-Si NPs in hexanes, Dec-Si NPs in hexanes, CTAB/Dec-Si NPs in water, and PAA/CTAB/Dec-Si NPs in water) were examined using a Shimadzu-RF5310 PC spectrophotometer (Shimadzu Corporation, Kyoto, Japan). Steady-state emission spectra were collected in the 350–750 nm range on suitably diluted, purified samples using excitation wave lengths varying from 250 to 400 nm. The instrument has a standard photomultiplier tube detector (range 220–750 nm, wave length accuracy ±1.5 nm), with diminished sensitivity over the red-to-NIR spectral region.
QY measurements were done on a Horiba Jobin Yvon FL3-21 spectrofluorometer (Jobin-Yvon/Horiba Scientific, Edison, NJ) for the CTAB/Dec-Si NPs in water and the PAA/CTAB/Dec-Si NPs in water. Emission spectra were collected in the 385–850 and 470–850 nm ranges at excitation wave lengths of 365 and 450 nm, respectively, using purified samples of suitable dilution and water as a reference. Also, excitation scans were performed over a ±20 nm range about each excitation wave length to determine sample and blank absorptivity. Both excitation and emission scans were obtained with the sample (in a quartz cuvette) placed inside the integrating sphere, both in and out of direct light excitation, and with a solvent (water) sample in direct light excitation. The resulting six data sets (sample excitation scan, in beam and out of beam; sample emission scan, in beam and out of beam; and water blank excitation and emission scans, in beam only) for each excitation wave length were analyzed via two slightly different procedures previously reported61, Reference Porres, Holland, Palsson, Monkman, Kemp and Beeby62 to give both absorbance and QY values. The raw data sets were corrected for detector sensitivity (according to a system-specific calibration algorithm supplied by the instrument’s manufacturer) and integrating sphere reflectance, as well as for the measured transmittances of various filters used in the beam paths and variations in the excitation beam intensities.
5. Live cell microscopy of Si NP internalization
Murine neuroblastoma (N2a) cells were plated on 25-mm poly-D-lysine-coated glass coverslips and cultured in medium containing 47.5% DMEM, 47.5% Opti-MEM, and 5% FBS for 48 h at 37 °C under a 5% CO2 atmosphere. The cellular medium was aspirated and cells were incubated with a solution of CTAB/Dec-Si NPs in Opti-MEM solution and then returned to the incubator for 1 h. Afterward, this solution was aspirated, and the cells were washed once with PBS then transferred to an imaging chamber with Opti-MEM media for live cell imaging. Cells were imaged with a Zeiss Axiovert 200M epifluorescence microscope (Carl Zeiss, Gottingen, Germany) fitted with an Andor iXON CCD camera (Andor Technology, South Windsor, CT), a stage and objective heater, an appropriate filter set (excitation: 350 ± 25 nm, dichroic: 400-nm long pass, emission: 420-nm long pass), and an Apochromat 100x 1.4 NA oil immersion objective. Control cells were prepared and imaged the same way with the exception that they were not exposed to Si NPs. Images were minimally processed for background subtraction and brightness/contrast adjustment using the NIH freely distributed software ImageJ.63
III. RESULTS
A. Synthesis of red-emitting, water-soluble Si NPs
Synthesis of hydride-terminated Si NPs via disproportionation of solid-state silicon-rich oxides (O:Si ratio, less than 2:1), polymeric alkyl or hydrosilicates, or molecular alkyl or hydrogen silsesquioxanes (O:Si ratio, 1.5:1) have been previously reported.Reference Belyakov, Burdov, Lockwood and Meldrum7, Reference Hessel, Henderson, Kelly, Cavell, Sham and Veinot22, Reference Hessel, Henderson and Veinot40, Reference Henderson, Kelly and Veinot60, Reference Hessel, Henderson and Veinot64, Reference Veinot65 Briefly, silicon-rich oxide precursors, particularly those of stoichiometry O:Si 1.5:1,Reference Hessel, Henderson, Kelly, Cavell, Sham and Veinot22, Reference Hessel, Henderson and Veinot40, Reference Henderson, Kelly and Veinot60, Reference Hessel, Henderson and Veinot64, Reference Veinot65 are known to undergo thermodynamic disproportionation at elevated temperatures (e.g., 900–1500 °C), producing nanoscale Si domains encapsulated in an amorphous silica matrix. Such a reaction is usually done by heating a Si-rich oxide precursor under flowing forming gas (e.g., 10% H2 in N2), although qualitatively, the same product is obtained using inert (N2 or Ar) or vacuum atmosphere, according to our comparative results (using hydrolyzed trichlorosilane polymer as a precursor in these atmospheres, results not shown).
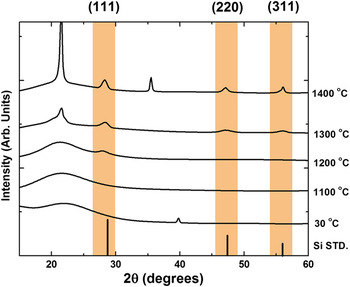
For all Si NP syntheses reported herein, trichlorosilane was used as the silicon source. The trichlorosilane was first hydrolyzed and polycondensed to produce a polymeric sol–gel hydrosilicate precursor of putative stoichiometry O:Si = 1.5:1,Reference Henderson, Kelly and Veinot60 which was subsequently subjected to various heating schemes under flowing N2. Though the subtle differences in reaction product as a function of heating scheme are beyond the scope of this paper (and have been covered elsewhere),Reference Veinot65 in general, we have observed that longer heating times and higher reaction temperatures facilitate the disproportionation reaction. For example, as shown in Fig. 1, heating the (HSiO1.5)n polymer at 1100 °C (here, under vacuum; in situ measurement) for 1 h does not produce crystalline Si domains, while crystalline domains are observed at the end of 1 h using a reaction temperature of 1400 °C. However, using longer reaction times, usually 10 h or longer, the crystalline Si domains can be generated at 1100 °C (see characterization of product synthesized at 1100 °C below), a temperature achievable in standard laboratory tube furnaces. It should be noted that the as-synthesized solid-state product containing the nanoscale Si domains is red emissive under 365-nm excitation, regardless of heating parameters and prior to liberation from the oxide matrix.
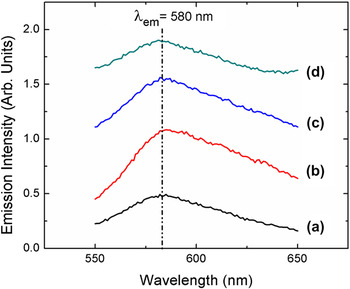
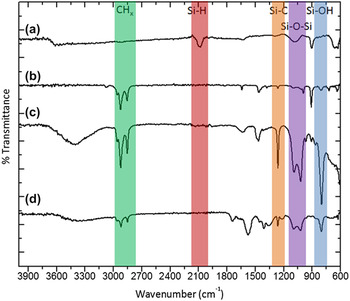
The crystalline, nanometer-sized Si domains generated in the disproportionation of the (HSiO1.5)n polymeric precursor at 1100 °C were liberated from the oxide host via a wet chemical etch (i.e., with HF/EtOH/H2O) to result in red-emitting, hydride-terminated Si NPs [λmax,em = 580 nm, Fig. 2(a); full spectrum, Fig. S1] that can subsequently be surface functionalized by thermal, photochemical, or chemically initiated hydrosilylation with a variety of terminal olefins. The neat Si NPs, as extracted from the aqueous ethanol/HF etching solution, were shown to have hydride surface termination by FTIR spectroscopy; the Si–H stretching, deformation, and bending modesReference Higashi, Chabal, Trucks and Raghavachari66, Reference Michalak, Amy, Aureau, Dai, Esteve and Chabal67 are observed at 2093, 958, and 617 cm−1, respectively [Fig. 3(a)], and little indication of surface oxide formation (as indicated by the Si–O–Si region, 1000–1100 cm−1)Reference Pasternack, Amy and Chabal68 during the etching step is observed. However, we have observed unpredictable changes in the PL of the Si NPs (usually dramatic blueshifts, data not shown) when terminal alkenecarboxylic acids, alkeneamines, and alkenethiols are used in hydrosilylation reactions, but preservation of the initial red PL when terminal alkenes and alkynes are used as capping agents. Because water solubility with preservation of red emission could not be directly achieved via hydrosilylation with bifunctional terminal alkenes (i.e., having a second, reactive functional group to impart hydrophilicity), 1-decene was used to cap the Si NP surfaces, followed by a surface coating step with surfactant, to achieve water solubility with preservation of red emission [λmax,em = 580 nm, Figs. 2(b) and 2(c) and Fig. S1].
In situ variable temperature PXRD study of the disproportionation of (HSiO1.5)n precursor. Vertical reflection markers are the calculated reflections for bulk silicon and highlighted regions are added to guide the eye.

Emission spectra of (a) H-Si NPs (in hexanes), (b) Dec-Si NPs (in hexanes), (c) CTAB-coated/Dec-Si NP micelles (in water), and (d) PAA-wrapped/CTAB-coated/Dec-Si NP micelles (in water). Excitation is at 340 nm.

FTIR spectra of freshly prepared (a) H-Si NPs, (b) Dec-Si NPs, (c) CTAB/Dec-Si NPs, and (d) PAA/CTAB/Dec-Si NPs. CHx(green), Si–H (red), Si–C (orange), Si–O–Si (purple), and Si–OH (blue) regions are highlighted and labeled.

FTIR was used to examine the Si NP surface changes after hydrosilylation [Fig. 3(b)]: loss of the Si–H stretch at 2093 cm−1 is clearly observed; the Si–H deformation and bend features (958 and 617 cm−1) are also lost with new peaks in these regions characteristic of decene (perhaps due to excess capping agent) at ∼625, ∼725, and ∼900 cm−1. The success of the hydrosilylation reaction to result in partially Si–C-terminated surfaces is indicated by the appearance of a Si–C stretch at 1256 cm−1, other weak features characteristic of decane/decane in the 1300–1600 cm−1 region, and the strong CHx features between 2800 and 3000 cm−1. It is worth noting that the surface is not significantly oxidized during the hydrosilylation reaction; only weak intensity in the 1000–1100 cm−1 region is observed. Furthermore, after hydrosilylation, the Si NP surfaces appear to be partially hydroxylated as indicated by the Si–OH stretch at 800 cm−1.Reference Michalak, Amy, Aureau, Dai, Esteve and Chabal67, Reference Thissen, Peixoto, Longo, Peng, Cho and Chabal69
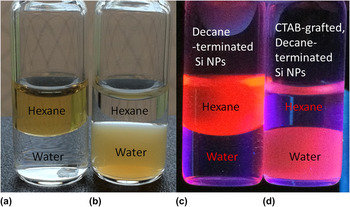
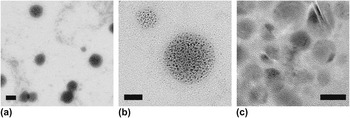
As described by Mazumder et al.,Reference Mazumder, Dey, Mitra, Mukherjee and Das70 a surfactant that intercalates hydrophobic chains on NP surfaces and is weakly bound to the NP by hydrophobic interactions can be used for phase transfer. Thus, the hydrophobic, red-emitting, decane-terminated Si NPs (Dec-Si NPs) were made water soluble through a surfactant mediator and phase transfer reagent via alkyl chain self-assembly (see Scheme 1). CTAB has a hydrophobic tail and a hydrophilic quaternary ammonium head group with a net positive charge, making it an ideal surfactant to phase transfer hydrophobic, alkyl chain-terminated NPs into aqueous media. An intermolecular hydrophobic interaction between CTAB and the decane-terminated Si NPs (previously dispersed in hexanes) generates water-soluble Si NPs (Fig. 4), with the CTAB hydrophobic tail appearing to intercalate the decyl chains on the Si NP surfaces leaving the quaternary ammonium head groups exposed to water, thus resulting in colloidally stable, water-soluble Si NP micelle assemblies [Figs. 5(a) and 5(b)] with emission λmax preserved at 580 nm [Fig. 2(c) and Fig. S1]. It should be noted that the measured pH values of as-prepared (after purification), aqueous CTAB/Dec-Si NP solutions are consistently 6.5 ± 0.5, and that, in general, the particles can be taken to dryness and redispersed in other aqueous solutions (e.g., PBS buffer).
Digital photographs of vials under ambient light [(a) and (b)] and 365-nm light [(c) and (d)] showing phase transfer of the Dec-Si NPs from hexanes to water after micelle encapsulation by CTAB. (a) and (c) are Dec-Si NPs before phase transfer, (b) and (d) are CTAB/Dec-Si NP micelles after phase transfer.

TEM images of CTAB/Dec-Si NP micelles. Scale bars: (a) 100 nm, (b) 50 nm, and (c) 5 nm.

The Dec-Si NPs, with an average size of 5.14 ± 1.46 nm (based on the TEM analysis of over 1000 individual Si NPs in the CTAB/Dec-Si NP micelles, data not shown), are observed to be clustered within the micelles. The CTAB/Dec-Si NP micelles were found to have a very polydisperse size distribution, based on DLS measurements. The effective diameter of the micelle assemblies by DLS was found to be 123.7 ± 96.1 nm [Fig. S2(a)]. The morphology of freshly prepared CTAB/Dec-Si NPs, as seen by TEM, is shown in Figs. 5(a) and 5(b). Such assembles have been observed by Erogbogbo et al.,Reference Erogbogbo, Yong, Roy, Hu, Law, Zhao, Ding, Wu, Kumar, Swihart and Prasad12, Reference Erogbogbo, Yong, Roy, Xu, Prasad and Swihart58 who have also reported a hydrophobic chain interaction to generate micellar Si QDs. HR-TEM [Fig. 5(c)] shows the high crystallinity of the Si NP cores within the micelles; inspection of the intensity profile for a single individual Si NP revealed a lattice spacing of 0.31 ± 0.16 nm, consistent with the (111) plane of diamond lattice cubic Si (JCPDS Card No. 27-1402). EDX spectroscopy on a large CTAB/Dec-Si NP micelle (shown in Fig. S3) reveals the presence of C, O, Cu (grid), Br, Si, P (from PBS), Cl (from PBS), and K (from PBS). Despite high elemental counts for the buffer components P, K, and Cl that were expected to be part of the diffuse micelles, Si and Br belonging to the particle and CTAB surfactant, respectively, are observed, which is consistent with CTAB-coated decane-terminated Si NPs with partial Br compensation for the positive surface charge. The high counts from C may be attributed to a combination of the carbon grid coating, the decane surface-terminating groups of the Si NPs, and, likely, from CTAB coated on the Si NPs. High counts from O may be attributed to trace atmospheric oxygen and water molecules associated with the micelle. Some O counts may be due to partial oxidation or –OH passivation of the Si NP surface, which is better discerned using infrared spectroscopy (see Fig. 3). Finally, while it is expected that the micelles would contain N from the polar CTAB head group, the counts from the Si NP micelles relative to the grid materials are low, thus the expected signal from N may be undetectable against this background; furthermore, the high O and C counts may hide the weak N signal, since the N signal should be observed between these two.
Once coated with CTAB, a broader feature (relative to that in the Dec-Si NP spectrum that is assigned to the decyl chain) is observed in the FTIR spectrum [Fig. 3(c)] at ∼1500 cm−1, which is likely due to CTAB C–C features superimposed on the decyl chain C–C features. Other weak intensity vibrations characteristic of CTAB are observed in the 875–1000 cm−1 region. Comparing the relative intensities of the Si–C (1256 cm−1), Si–O–Si (1000–1100 cm−1), and Si–OH (800 cm−1) features for the Dec-Si NPs versus the CTAB/Dec-Si NP micelles, the number and type of ligands on the Si NP surfaces appear not to have substantively changed during the CTAB coating step. There is, at best, a modest increase in the degree of Si–OH surface termination. A new broad feature between 3000 and 3600 cm−1 can be assigned as a combination of water molecules part of the micelles and SiO–H bond stretches.Reference Michalak, Amy, Aureau, Dai, Esteve and Chabal67, Reference Thissen, Peixoto, Longo, Peng, Cho and Chabal69 Raman spectroscopy was also performed on a macroscopic sample of the CTAB/Dec-Si NPs (Fig. S4). The maximum vibration band was found at 515 cm−1, which can be assigned as the Si–Si vibration of elemental Si, consistent with the results of TEM. The slight Raman blueshift from the bulk Si–Si vibration of 516 cm−1 has been observed for other Si NPsReference Shirahata, Linford, Furumi, Pei, Sakka, Gates and Asplund71 and has been attributed to the small domain size of Si NCs. The Raman spectrum of the CTAB/Dec-Si NPs also shows a weaker intensity Si–O vibration centered at 493 cm−1, which is in agreement with the FTIR and EDX results in that the Si NPs do show some degree of surface oxidation/hydroxide passivation following the alkyl chain self-assembly and phase transfer into water.
It should be noted that in adding CTAB to accomplish phase transfer, we have experimentally observed that the amount of CTAB required for aqueous nanocrystal stabilization (i.e., colloidal stabilization) is variable, depending on whether larger or smaller micelles are desired. We have been able to produce aqueous, single Si NPs using variations of the method presented in this work, using a smaller excess of CTAB, but these particles, while equally colloidally stable, are less photophysically stable with respect to the red emission (i.e., a blueshift of the emission λmax, originally at 580 nm, is observed within several hours after phase transfer to water, data not shown). No attempts were made to optimize the micelle size by optimizing the excess of CTAB used. The ratio used herein consistently yielded CTAB/Dec-Si NP micelles with persistent red emission (>6 mo) in water.
Taking advantage of the net positive charge on the CTAB/Dec-Si NP micelles, polymer wrapping with sodium polyacrylate was also done to modify the surface charge from net positive to net negative and to provide reactive carboxylate groups for future addition of biological honing moieties. With negatively charged carboxylate groups that can interact with the positively charged nitrogen on the outermost layer of the CTAB/Dec-Si NP micelles, a pure electrostatic interaction causes PAA to wrap around the CTAB/Dec-Si NPs without precipitation. The PAA-wrapped, CTAB-coated, decane-terminated Si NPs (PAA/CTAB/Dec-Si NPs), as analyzed by DLS [Fig. S2(b)], were ∼13 nm larger in diameter than the CTAB/Dec-Si NPs, supportive of PAA polymer shell encapsulation of the CTAB/Dec-Si NP micelles. As expected with a change in micelle diameter but not in Si NP core diameter or Si NP surface ligand identity (see FTIR results, Fig. 3), the PAA/CTAB/Dec-Si NPs were also shown to have a persistent red emission in water [emission λmax = 580 nm, Fig. 2(d) and Fig. S1] for several months. When wrapped in PAA, few changes are observed in the FTIR spectrum [Fig. 3(d)] when compared to the FTIR spectrum of the unwrapped micelles [Fig. 3(c)]. New features characteristic of PAA/polyacrylate are observed between 1300 and 1450 cm−1, at ∼1550 cm−1 (COO−), and at ∼1725 cm−1(COOH); otherwise, the spectrum is unchanged in its gross features.
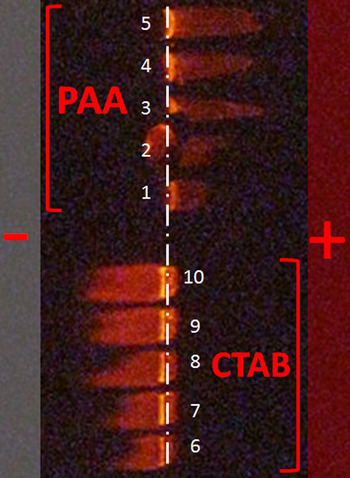
To illustrate the difference in surface charge between the CTAB/Dec-Si NPs and PAA/CTAB/Dec-Si NPs, gel electrophoresis was used, and the particle migration under an applied voltage was followed using a handheld UV lamp (λex = 302 nm, Fig. 6). As colloidal dispersions in buffer at pH ∼8, CTAB/Dec-Si NPs and PAA/CTAB/Dec-Si NPs of varying concentrations were loaded into different wells of an agarose gel. When a current was applied, migrations to oppositely charged electrodes were observed via the red Si NP fluorescence signal: the CTAB/Dec-Si NPs migrated toward the negative electrode, consistent with a net positive surface charge, while the PAA/CTAB/Dec-Si NPs migrated toward the positive electrode, consistent with a net negative surface charge. These results are consistent with the predicted positive and negative surface charges owing to the CTAB and PAA functional groups, respectively, at pH = ∼8, and confirm the success of each surface modification step.
Gel electrophoresis of PAA/CTAB/Dec-Si NPs (from lane 1 to 5, increasing concentration) and CTAB/Dec-Si NPs (from lane 6 to 10, increasing concentration). The positions of the positive (+) and negative (−) electrodes are indicated.

B. Stable red emission of Si NPs in live cells under physiological conditions
Bright, fluorescent Si NPs have been used as in vivo imaging agents and advanced tools for molecular tracking over the past 10 years.Reference Park, Gu, von Maltzahn, Ruoslahti, Bhatia and Sailor4, Reference Erogbogbo, Yong, Roy, Hu, Law, Zhao, Ding, Wu, Kumar, Swihart and Prasad12 The biocompatible nature of fluorescent Si NPsReference Erogbogbo, Yong, Roy, Hu, Law, Zhao, Ding, Wu, Kumar, Swihart and Prasad12 makes them ideal probes for live cellular and small animal studies involving molecular tracking, particularly for temporal studies if their emission properties are stable. For example, Rosso-Vasic et al.Reference Rosso-Vasic, Spruijt, Popovic, Overgaag, van Lagen, Grandidier, Vanmaekelbergh, Dominguez-Gutierrez, De Cola and Zuilhof14 have reported that positively charged, blue-emitting, amine-terminated Si NPs are internalized by the murine cell line BV2. However, red-to-NIR-emitting particles are more relevant for in vivo applications, since these long emission wave lengths are capable of penetrating tissues, thus facilitating imaging of dense biological samples. Additionally, autofluorescence due to cellular components and common components of cellular media (e.g., flavins) is greatly diminished when observing fluorescence in the red-to-NIR region, resulting in a high signal-to-noise ratio.
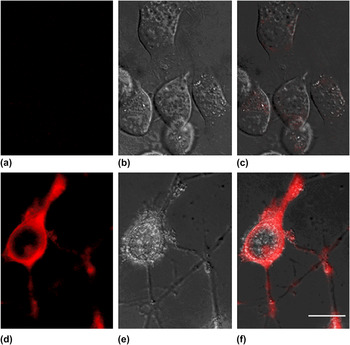
In Figs. 7(a)–7(c), control images show murine neuroblastoma (N2a) cells that were not exposed to Si NPs; these control images demonstrate the advantage of using a filter set appropriate for red or NIR fluorophores in that, practically, no fluorescent signal from the cells/media is observed. Figures 7(d)–7(f) show images of cells that were exposed to CTAB/Dec-Si NPs. These images demonstrate the ability of these cells to internalize the positively charged CTAB/Dec-Si NPs; the bright fluorescence signal, originating from red-emitting CTAB/Dec-Si NPs, is densely distributed throughout the cell, only being excluded from the nucleus, which is expected due to the capacity of the cell to tightly regulate transport into and out of this important organelle. These internalized Si NPs retain bright red PL, even from within the cellular interior, demonstrating that the micellar, hydrophobically protected Si NPs in a physiological environment have appropriate spectral characteristics for biological imaging. Though the ∼100-nm micellar CTAB constructs and the PAA-coated micellar CTAB constructs we report herein are relatively large for use as practical biological fluorophores, optimized syntheses may produce smaller and less polydisperse micelles with similar, stable, aqueous red emission properties. Ultimately, however, inorganic shell passivation may provide both the protection of Si NPs against water and the ability to functionalize for solubility and bioconjugation while making the size more appropriate (e.g., a 4–5 nm Si NP, with a 2-nm ZnS shell is approximately 12–15 nm in diameter) for fluorescence assays. Furthermore, it should be noted that CTAB is widely known to be cytotoxic, and that in our ongoing work, we have found that more biocompatible lipids can be used for phase transfer to achieve micelles with similar photophysical properties to the particles reported herein.
Fluorescence microscopy study of control N2a cells [(a), (b), and (c)] and N2a cells incubated with CTAB/Dec-Si NPs [(d), (e), and (f)]. (a) and (d) are fluorescence microscopy images, (b) and (e) are differential interference contrast (DIC) images, and (c) and (f) are overlaid fluorescence and DIC images. Scale bar = 10 μm.

C. Effect of pH on aqueous Si NP photoluminescence
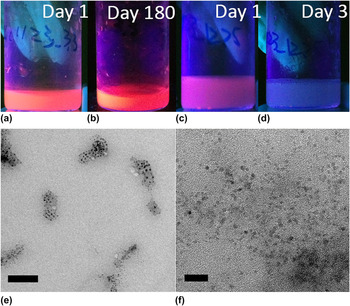
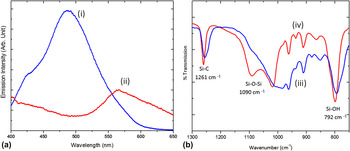
The PL properties of the CTAB/Dec-Si NPs were also assessed in varying pH environments; TEM images, FTIR spectra, and PL spectra for CTAB/Dec-Si NPs adjusted to pH = 3.3 or 12.3 (Figs. 8 and 9) were compared against the corresponding data [Figs. 2(c), 3(c), and 5(a)–5(c) and Figs. S1(c) and S6] for the as-prepared aqueous solutions (following dialysis), which were at pH ∼7, to correlate morphology and/or surface changes to PL changes as a function of pH and time. In strongly acidic conditions (pH = 3.3), the CTAB/Dec-Si NPs maintain a persistent red emission for over 180 days, both visually [Figs. 8(a) and 8(b)] and spectroscopically [Fig. 9(a)], with λmax,em = 580 nm when excited at 370 nm, similar to the PL behavior of CTAB/Dec-Si NPs at pH ∼7 [Fig. 2(c) and Figs. S1c and S6; note that these data correspond to excitation at 340 nm, rather than 370 nm, but the red λmax,em is at 580 nm using either excitation wave length]. By contrast, in strong basic conditions (pH = 12.3), the emission of the CTAB/Dec-Si NPs changes drastically and rapidly. Within 3 days, the observed emission color has changed from red to blue [visually, Figs. 8(c) and 8(d)] with a new λmax,em at 488 nm when excited at 370 nm [Fig. 9(a)]. The blue emission also remains qualitatively unchanged over the course of 180 days. Unlike the red emission, which changes in intensity but not λmax with changing excitation wave length, the blue emission changes substantively in both intensity and peak position with changing excitation wave length (Fig. S7).
(a) As-prepared (day 1) CTAB/Dec-Si NPs at pH = 3.3, (b) CTAB/Dec-Si NPs at pH = 3.3 after 180 days, (c) as-prepared (day 1) CTAB/Dec-Si NPs at pH = 12.3, (d) CTAB/Dec-Si NPs at pH = 12.3 after 3 days, and (e) TEM image of CTAB/Dec-Si NPs from a pH = 3.3 solution, and (f) TEM image of CTAB/Dec-Si NPs from a pH = 12.3 solution. Scale bars: (e) 50 nm and (f) 20 nm.

(a) Emission profile (370-nm excitation) of CTAB/Dec-Si NPs at pH = 12.3 (blue trace, i) and pH = 3.3 (red trace, ii), (b) corresponding FTIR spectra of CTAB/Dec-Si NPs at pH = 12.3 (blue trace, iii) and pH = 3.3 (red trace, iv).

Since CTAB is simply coated on or intercalated with the decane surface groups of the Si NPs, it is possible that electrostatic interactions between the positively charged CTAB and negatively charged hydroxide may have occurred. Such an effect has been previously observed for nanovalves synthesized in the presence of CTAB.Reference Liu and Du72 Liu et al. report that as the pH and deprotonation of the solvent increases, the electrostatic interaction between CTAB and OH− ions is significant enough to remove CTAB from the surface, causing the nanovalve to open. For the as-synthesized CTAB/Dec-Si NPs presented herein, a similar result may be expected: if the CTAB becomes deintercalated from within the decane chains under basic conditions, this would result in gaps along the protective layer, thus exposing the Si NP surface to water and/or hydroxide that can passivate unsaturated surface sites, remove alkyl surface passivation, partially or wholly dissolve the Si NPs, or otherwise corrode the Si NP surfaces.
TEM was used to analyze the morphology of the CTAB/Dec-Si NP micelles after exposure to acidic or basic conditions, and as shown in Figs. 8(e) and 8(f), particles exposed to basic conditions no longer maintain the micellar structure [Fig. 8(f)], whereas the micelles are preserved (from near neutral pH solutions, see Fig. 5) at acidic pH [Fig. 8(e)]. The breakdown of the micellar structure can cause the Si NP surfaces to be more susceptible to oxidation, other passivation, surface reconstruction, or dissolution (partial or whole), although, with respect to the latter, the Si NPs after breakdown of the micelles in base are still abundant in number, not significantly different in size, and still contain crystalline cores (see HR-TEM image, Fig. S7). Furthermore, evidence for retention of Si0 cores at high pH also comes from the PL spectra, which show an excitation wave length dependence of λmax,em (Fig. S7) that others have reported as characteristic of aqueous blue-emitting particles that have been confirmed to contain nanoscale Si0 domains.
While there are no significant differences in the sizes of individual Si NPs regardless of pH, the FTIR spectra of these pH-adjusted samples [Fig. 9(b)] indicate a large difference in the degree of surface oxidation/hydroxide passivation in acidic versus basic media. While both the Si–O–Si and Si–OH features are observed for the CTAB/Dec-Si NP micelles regardless of pH [Fig. 3(c) (pH ∼7) and Fig. 9(b) (red, pH = 3.3; blue, pH =12.3)], the width of both features is greater in highly basic versus highly acidic or near neutral media, suggesting a greater number and variety in the various Si–O surface bonding environments with greater accessible Si NP surface area in aqueous base. FTIR spectroscopy is thus supportive of the hypothesis that electrostatic interaction between CTAB and hydroxide essentially deprotects the Si NP surfaces, making them more susceptible to formation of Si–O bonds. Conversely, the FTIR spectrum of the CTAB/Dec-Si NPs at pH = 3.3 [Fig. 9(b)] does not show a significant difference in the Si–O–Si and Si–OH regions as compared to the FTIR spectrum of the CTAB/Dec-Si NPs in neutral water [Fig. 3(c)]. The qualitative behavior of the PAA/CTAB/Dec-Si NPs as a function of pH is the same as that of the unwrapped CTAB/Dec-Si NPs (not shown).
IV. DISCUSSION
A. PL properties of water-soluble Si NPs: Consequences of protecting against surface passivation by OH− and H2O in preservation of aqueous red PL
We have shown persistent red emission (>6 months) from aqueous Si NPs encapsulated in sufficiently large micelles, on the order of 100 nm in size. We have also observed a rapid onset (<3 days) of blue emission intensity with commensurate loss of red emission intensity for single Dec-Si NPs rendered hydrophilic by CTAB coating (data not shown), and we have shown herein a similar rapid (<3 days) red to blue PL change when the large CTAB/Dec-Si NP micelles are destroyed by base. These results demonstrate the importance of protecting Si NPs against water and hydroxide in achieving persistent red emission in aqueous media. It should be noted that for the ∼100-nm micellar CTAB/Dec-Si NPs reported herein, there is a gradual intensity increase in the blue region (400–500 nm) in neutral to acidic pH solutions (see Fig. S5, which is at pH ∼7), indicating that even with the micellar constructs intact, the presumably diffuse hydrophobic organic shell around the Si NPs is somewhat permeable to H2O and OH−, which is consistent with other reports of somewhat long-term stable red emission from micellar Si NPs.Reference Erogbogbo, Yong, Roy, Hu, Law, Zhao, Ding, Wu, Kumar, Swihart and Prasad12, Reference He, Kang, Li, Tsang, Fan and Lee21, Reference Erogbogbo, Yong, Roy, Xu, Prasad and Swihart58 Despite the gradual increase in blue emission intensity over time, we observe that the red emission event remains dominant over the blue emission event for prolonged periods, likely because the majority of particles are well protected from H2O and OH− within the interior of the large intact micelles. However, although the diffuse organic shell provides reasonable protection against further H2O and OH− reaction with Si NP surfaces, an epitaxially grown inorganic shell should ultimately provide better long-term surface protection and thus more stable emission properties, and we are examining this in our ongoing work.
While our data show the consequences of protecting Si NPs against water and hydroxide in achieving persistently red, aqueous emission, they do not fully explain the origin of the red emission, the origin of the blue emission, or the reason for the observed red-to-blue PL change. However, recent literature reports have suggested that either slow unintended surface oxidation of Si NPs or passivation of Si NP surfaces by coordinating solvents or ligands (e.g., water or hydroxide) results in a blue emission due to formation of emissive Si–O surface states.Reference Yang, Li, Cao, Zeng and Cai27, Reference de Boer, Timmerman, Dohnalova, Yassievich, Zhang, Buma and Gregorkiewicz28, Reference Brewer and Von Haeften50 Our FTIR and accompanying PL data indicate that the blue emission is likely not originating due to the formation of states associated with pure surface oxide, consistent with prior reports of stable red emission from purposefully oxidized Si NPs,Reference Park, Gu, von Maltzahn, Ruoslahti, Bhatia and Sailor4, Reference Vincent, Maurice, Paquez, Sublemontier, Leconte, Guillois, Reynaud, Herlin-Boime, Raccurt and Tardif29, Reference Kang, Liu, Tsang, Ma, Fan, Wong and Lee39 since red emission is observed here alongside significant indications of surface oxidation. Our data are not contraindicated with previous suggestions that strong blue PL from Si NPs results from localized Si–OR states lying outside the Si NP band gap since we have observed that at low to neutral pH, samples exhibiting a lesser degree (relative to their basic counterpart) of Si–OH bonding features characteristic of water or hydroxide surface passivation remain red emitting, while at high pH, a large increase in the degree of Si–OH bonding is observed and is accompanied by a rapid emission color change from red to blue. However, it is also possible that Si–OH surface passivation deactivates or destroys a red emission pathway, versus activating or creating a blue emission pathway, or that invasive corrosion, dissolution, or surface reconstruction of the Si NPs by H2O or OH−, versus simple surface passivation by these species, results in the formation of a competitive blue emissive state. We are examining these and other reasonable origins of the red and blue PL events in our ongoing work.
B. PL properties of water-soluble Si NPs: QY and detector sensitivity
In addition to PL emission scans done on a standard (light collection from the sample only at 90° to incident angle) laboratory fluorometer, we also measured emission QYs for the aqueous Si NPs using an instrument having an integrating sphere (light collection from the sample over a sphere, with the sample both in and out of direct light excitation). Both instruments have photomultiplier tube detectors; the latter has an instrument-specific algorithm to correct for the variable wave length sensitivity of the detector, while the former does not. The two instruments, consequently, give qualitatively the same raw emission spectra but slightly different processed emission spectra, as we discuss below.
The peak of the emission spectrum for the CTAB/Dec-Si NPs using a 365-nm excitation and after correcting for both background and detector sensitivity is at 740 nm [Fig. S6(a)], versus at 655 nm in the uncorrected data (not shown), which is greatly redshifted as compared to the observed emission λmax at 580 nm using the 340-nm excitation light of the traditional laboratory instrument without detector sensitivity correction. For the most part, sensitivity of a photomultiplier tube detector steeply decreases over the emission wave length range of 555–850 nm, which is consistent with the large observed redshift of λmax,em in the raw versus processed data when a detector sensitivity correction is applied. It should be noted that the two instrument detectors also vary in their sensitivity and operable wave length range, enough to produce differences in the raw emission data. However, this result shows that the CTAB/Dec-Si NPs also have considerable NIR fluorescence intensity, which spans a wave length range of over 200 nm [full width at half maximum = 185 nm, Fig. S6(a)]. The absolute QY of the CTAB/Dec-Si NPs was determined to be 4.8% ± 0.1% when excited at 365 nm and 3.9% ± 0.2% when excited at 450 nm. The λmax,em at 740 nm does not substantively change as a function of excitation wave length, which we also observe using the standard laboratory instrument. The PAA/CTAB/Dec-Si NPs also have an emission λmax at 740 nm (Fig. S6b) when excited at 365 nm. The absolute QY of the PAA/CTAB/Dec-Si NPs was determined to be 4.6% ± 0.2% when excited at 365 nm and 3.8% ± 0.3% when excited at 450 nm. The samples used in this measurement were of unknown concentration, but the solution absorbance corresponding to the data above is given in the supporting information.
V. CONCLUSIONS
We have developed a new synthetic strategy that produces aqueous, red-emitting micellar Si NPs, where red PL is stable in water and certain other aqueous solutions for longer than 6 mo. Micellar protection by CTAB encapsulation provides water solubility and protection against surface interaction with water and hydroxide, which we have shown is crucial for preserving red PL and avoiding blue PL in aqueous solutions. We have also shown, as others have reported in the past, that gradual or purposeful oxidation of Si surfaces occurs with preservation of red emission. The photophysical properties of the ∼100-nm CTAB/Dec-Si NP and PAA/CTAB/Dec-Si NP micelles are stable in water and aqueous buffers with pH less than or equal to 7, as well as in cellular media at physiological pH (7.4), but unstable in sufficiently basic environments pH (greater than or equal to 8) where substantive interaction with H2O and OH− occurs.
ACKNOWLEDGMENTS
Financial support for this project was provided by the Burroughs Wellcome Fund (Award No. 1007294.01; A.M.G. holds a Career Award at the Scientific Interface from the Burroughs Wellcome Fund), the Oregon Nanoscience and Microtechnologies Institute and the Office of Navel Research (Task Order No 3. of the Master Grant Agreement, A.M.G. is a Signature Research Fellow; and Award No. GBMEN0105A, T.V.Q. and A.M.G.), Portland State University, and Sharp Laboratories of America. We also acknowledge the National Science Foundation for x-ray diffraction instrumentation (NSF-MRI, Award No. DMR-0923572) and other related support (Award No. 1057565). Microstructural and compositional analysis was performed at the Center for Electron Microscopy and Nanofabrication, Portland State University. Finally, the authors thank Dr. Douglas Tweet and Sharp Laboratories of America (Camas, WA) for assistance with QY measurements.