1. Measuring sustainable development
Sustainable development and its measurement would be a key for success in the United Nations’ Sustainable Development Goals (SDGs). This measurement is an old question, but it is not yet resolved. The ability to measure sustainable development would enable us to understand the status of the world by checking progress in achieving sustainability.
The United Nations Environment Programme (UNEP), for example, supports measuring progress for sustainability and value for nature as natural capital. Inclusive growth as a key indicator for SDGs is the growth in inclusive wealth (IW). IW has been developed theoretically and empirically in economics and widely applied in many different regions (see Arrow et al., Reference Arrow, Dasgupta, Goulder, Mumford and Oleson2012; Muñoz et al., Reference Muñoz, Petters, Managi and Darkey2014; Dasgupta et al., Reference Dasgupta, Duraiappah and Managi2015; Yang et al., Reference Yang, Managi and Sato2015; Urban Institute and UNEP, 2017; Yamaguchi and Managi, Reference Yamaguchi and Managi2017). The symposium issue on ‘Sustainability and the measurement of wealth’ in Environment and Development Economics provides a unique forum on progress and problems measuring sustainability (Arrow et al., Reference Arrow, Dasgupta, Goulder, Mumford and Oleson2012; Solow, Reference Solow2012; Xepapadeas, Reference Xepapadeas2012).
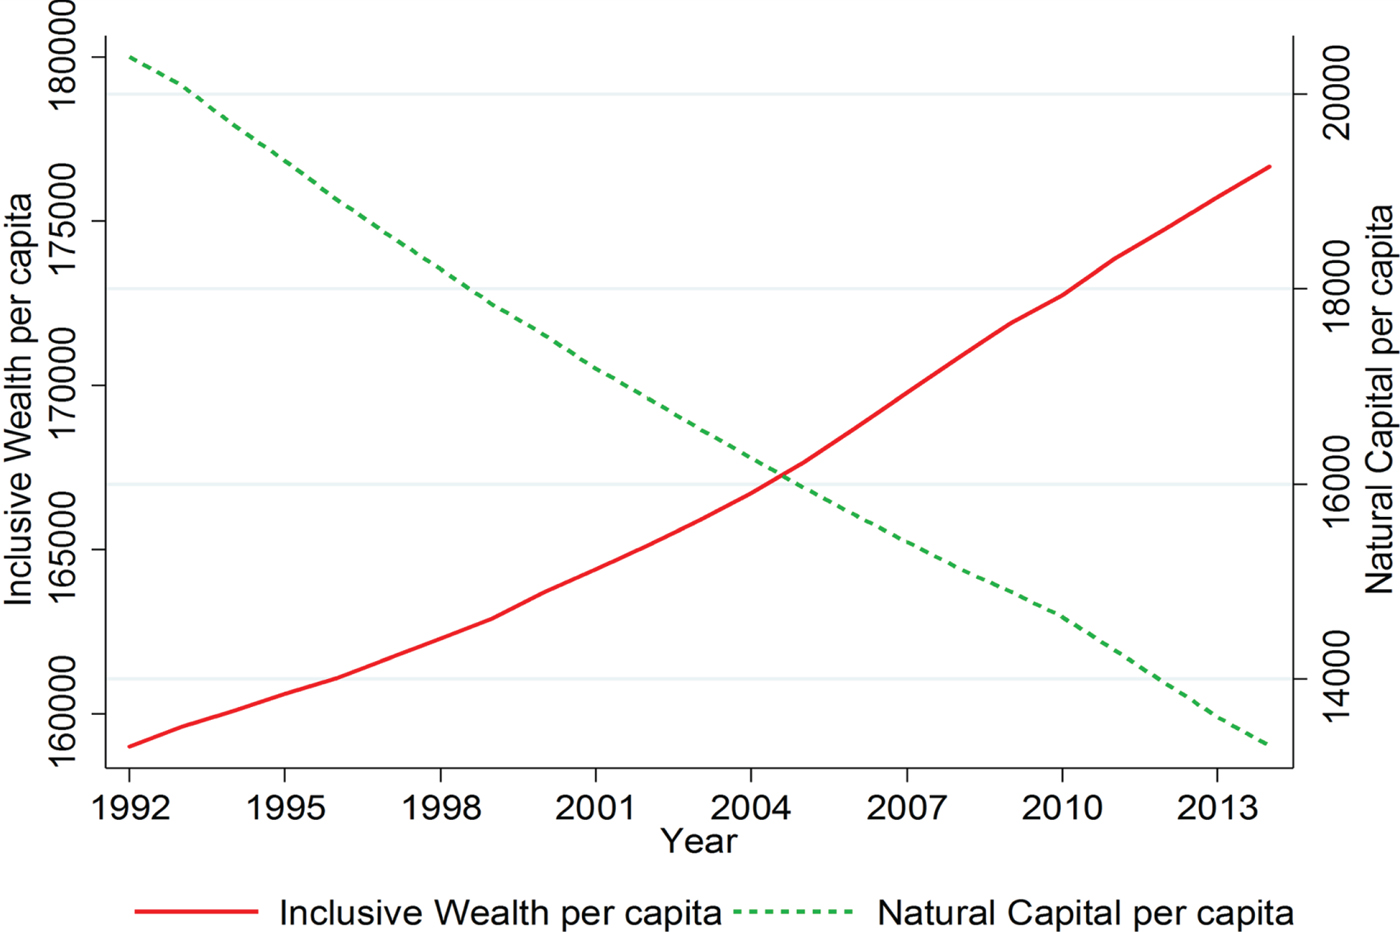
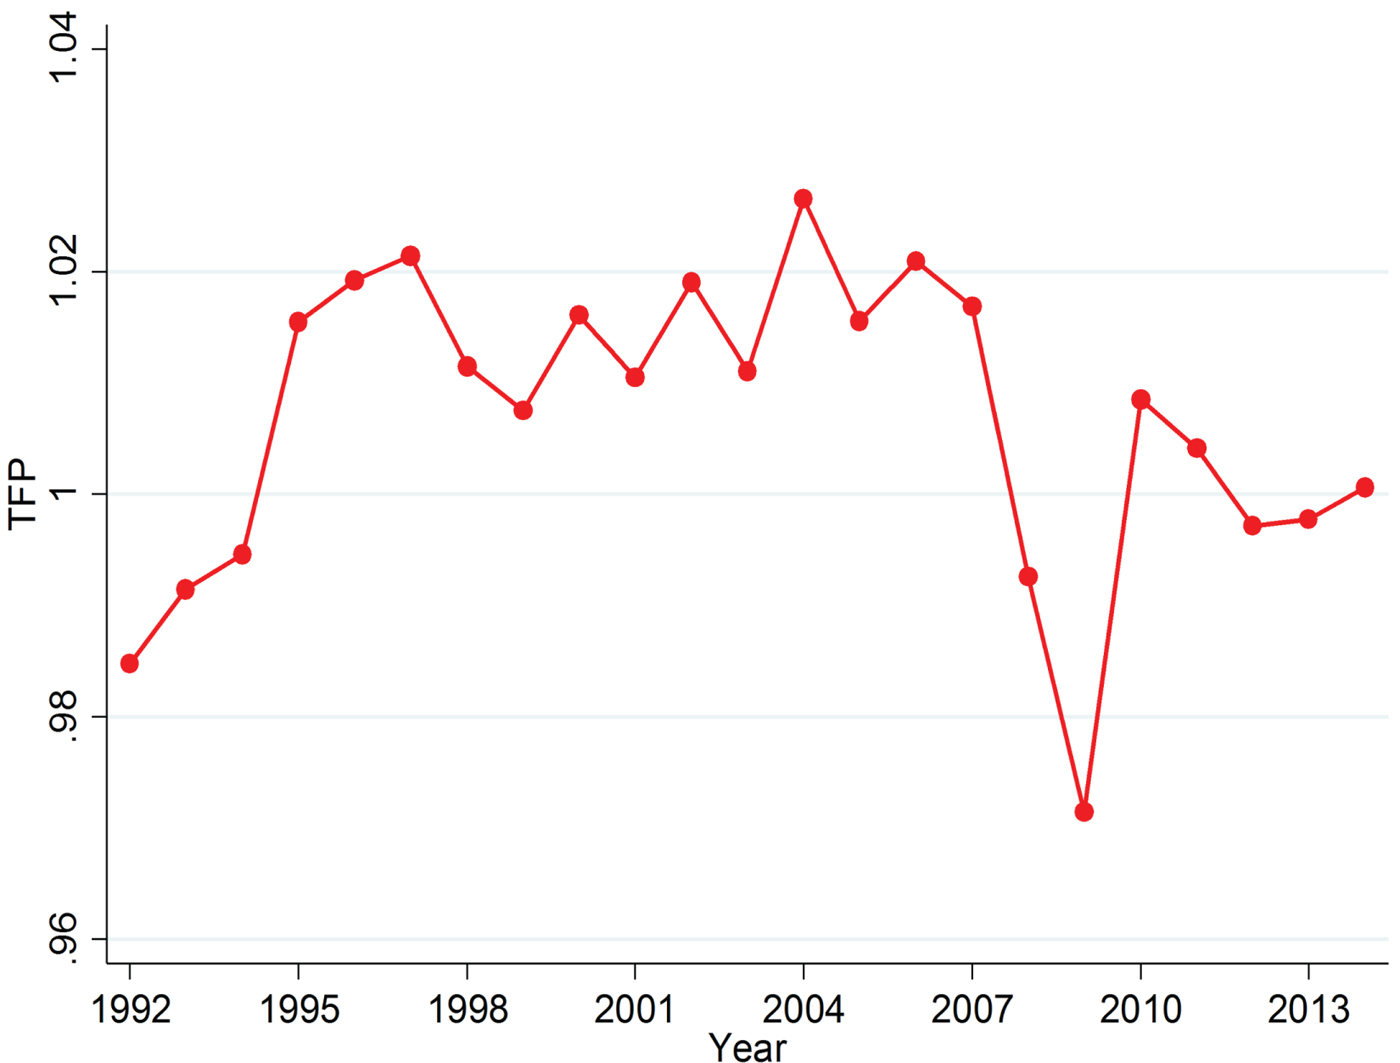
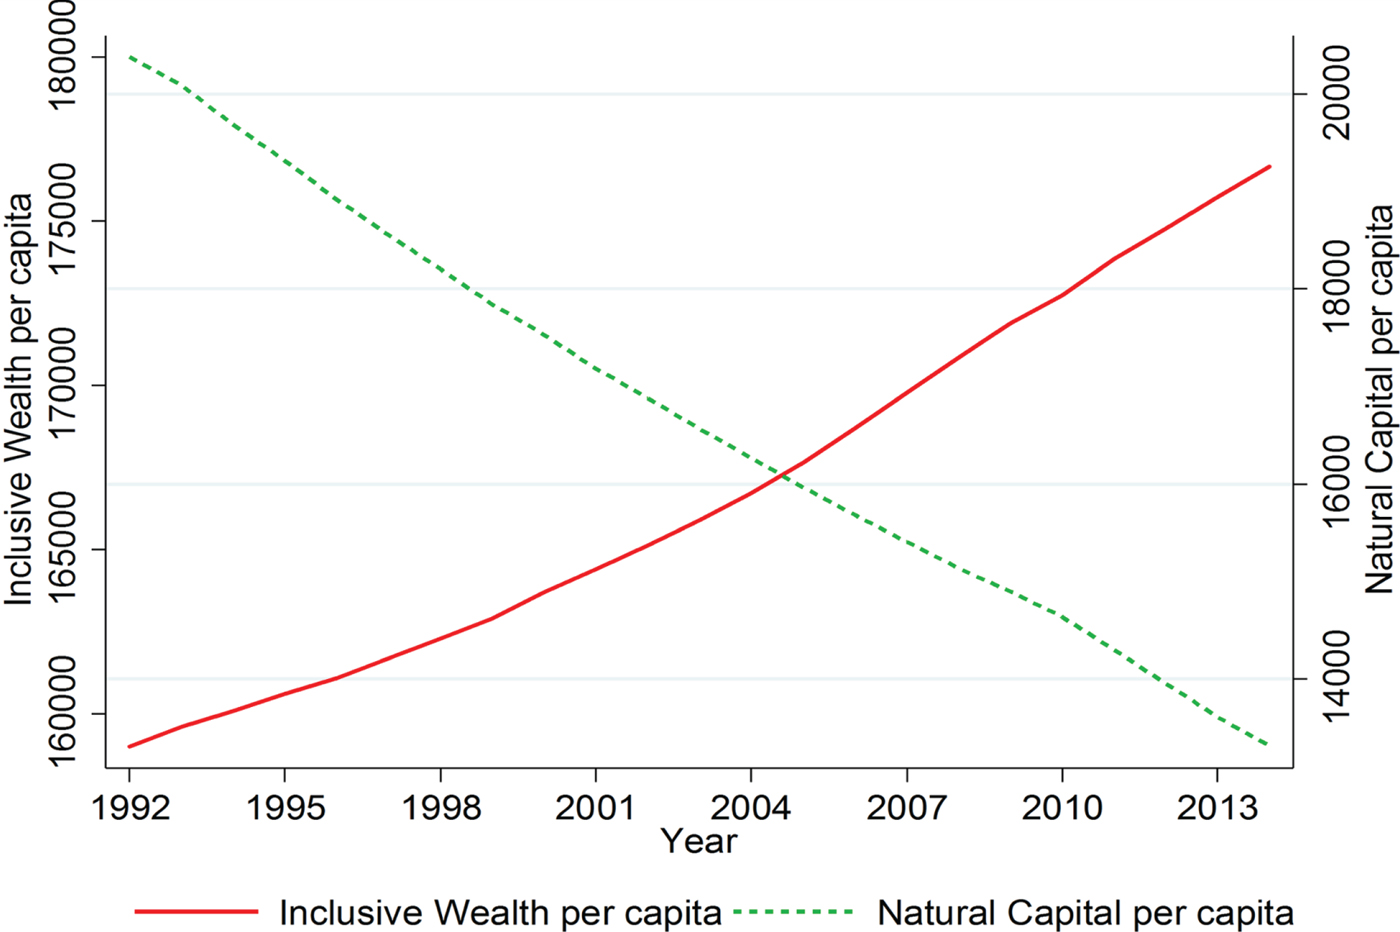
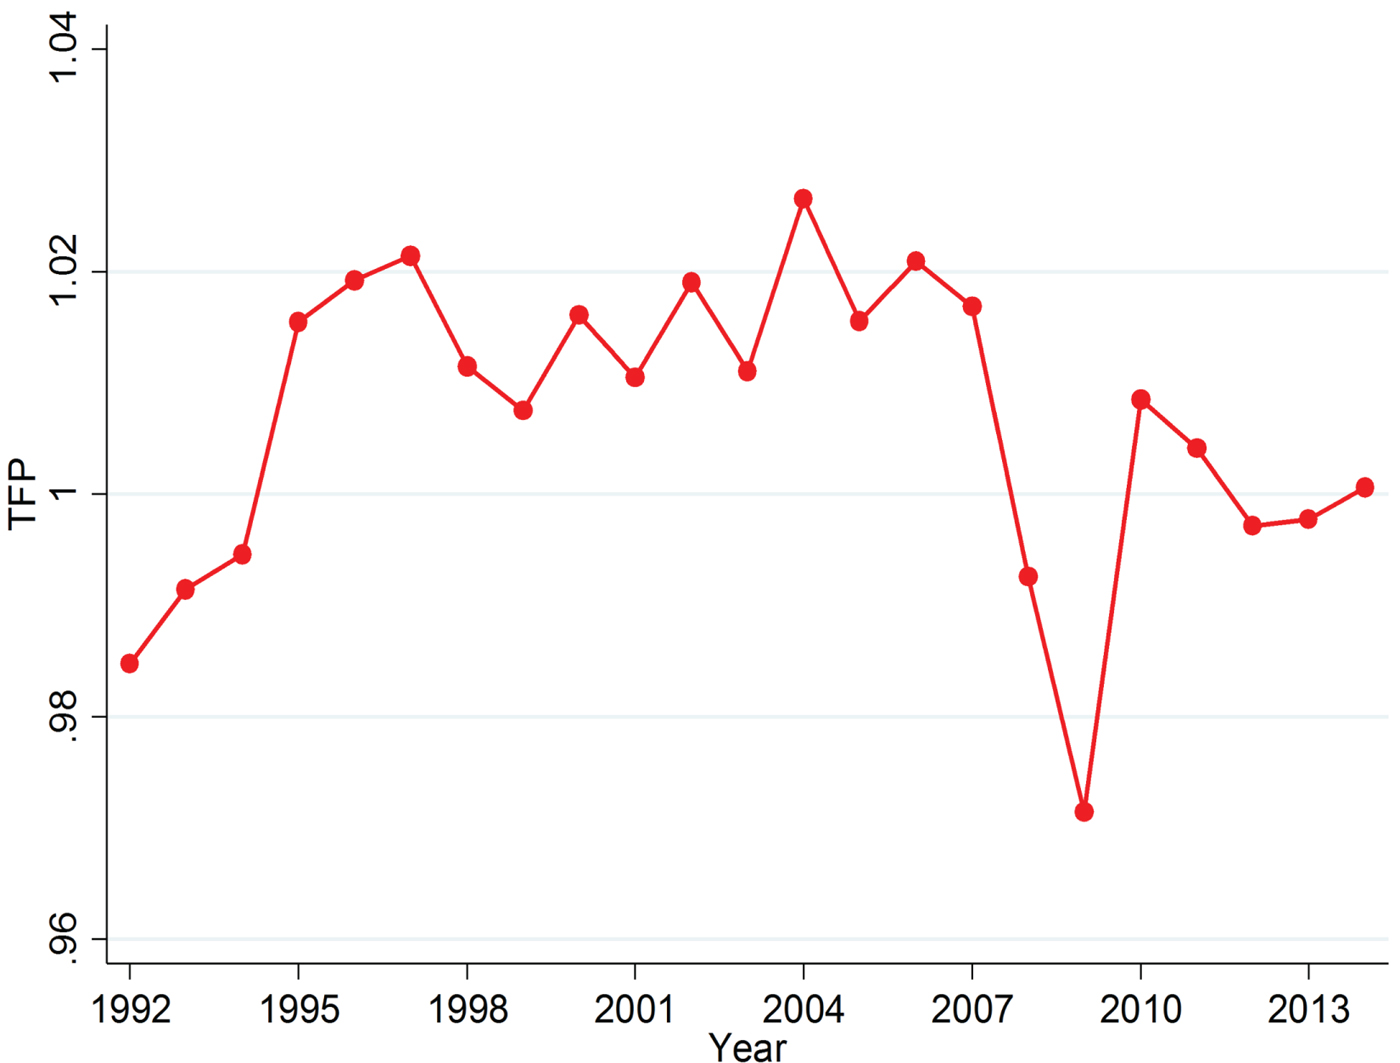
A measurement of sustainability, such as the Inclusive Wealth Report by UNEP, has been disclosed (UNESCO/UNU-IHDP and UNEP, 2014). The SDGs further emphasize the importance of understanding each goal as it related to the environment. Along these lines, figure 1 from the Urban Institute of UNEP (2017), as a new report on IW, shows the annual world trend of IW per capita and natural capital (NC) per capita from 1992 to 2014. IW per capita has been increasing steadily over time (11.1 per cent growth from 1992 to 2014), whereas NC per capita continues to decrease. NC per capita experienced a decline of about 34.7 per cent between 1992 and 2014. Similarly, figure 2 provides the IW-based Total Factor Productivity (TFP) trend in the world. This IW-based TFP measures both the technological progress and the efficiency change of capital use. A value of the TFP greater than 1 indicates positive TFP growth from the previous year to the current year, while a value of less than 1 indicates a TFP decline. The IW-based TFP decreased substantially during the 2007–2008 global financial crisis. Figures 2 and 3 show that the world is improving its economic and social status, but environmental damage has been increasing. The world economy continues to grow at the expense of the environment, and neither technological change nor productivity growth have offset the problem yet. These are in line with points made in a past Special Issue of Environment and Development Economics ‘Looking back and moving forward’ (Xepapadeas and Stefan, Reference Xepapadeas and Stefan2014).
Annual world trends of inclusive wealth per capita and natural capital per capita (1992–2014)
Annual world trend of IW based total factor productivity (1992–2014)
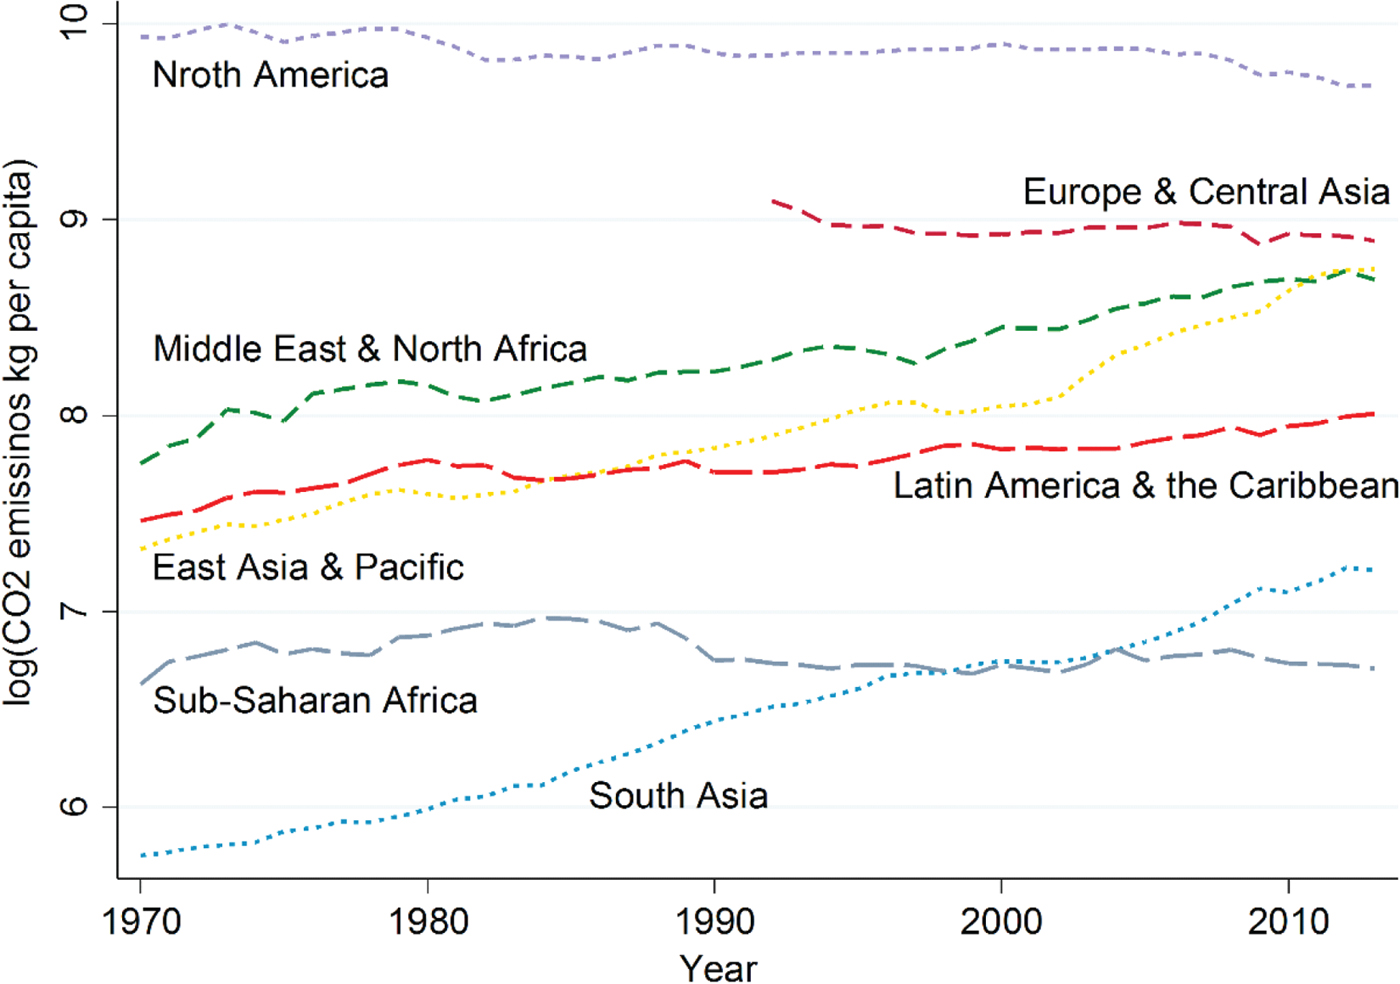
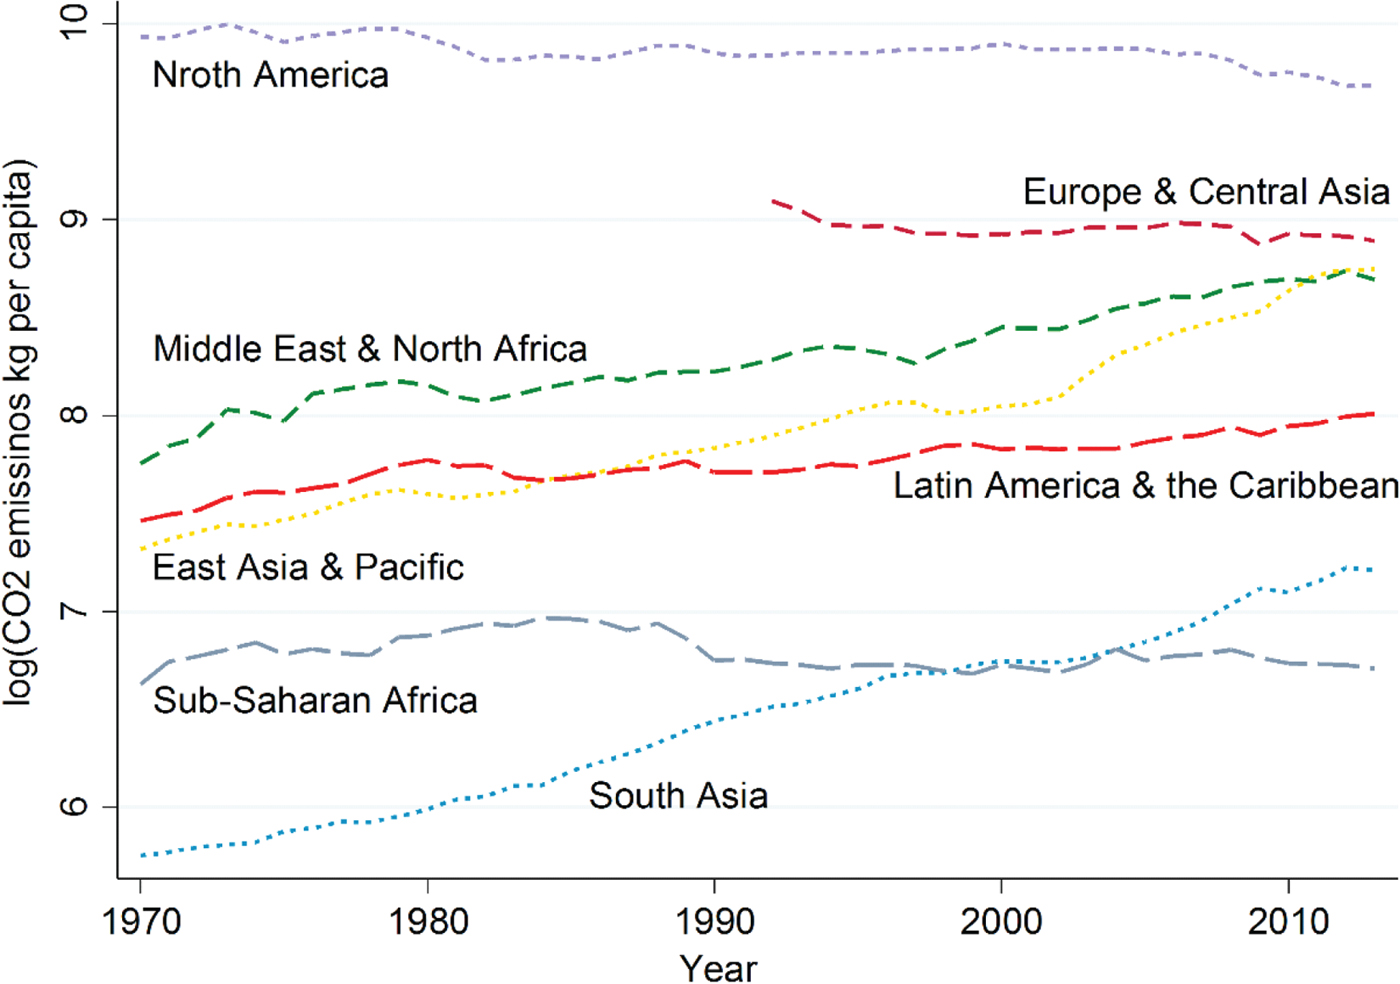
Annual trend of CO2 emissions per capita in seven regions (1970–2013)
2. Pollutants’ emissions and economic development: trends and relationships
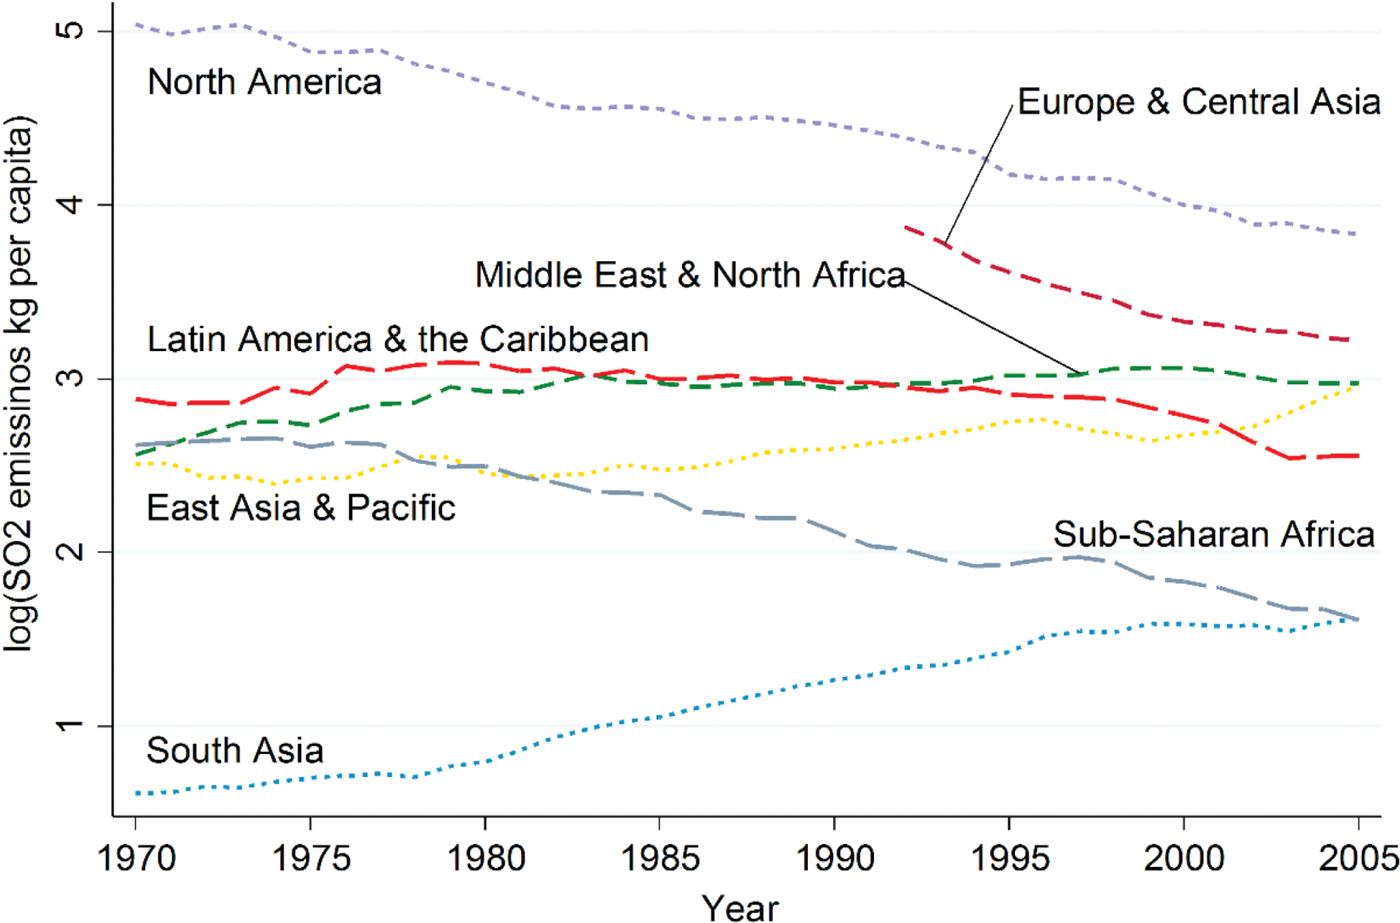
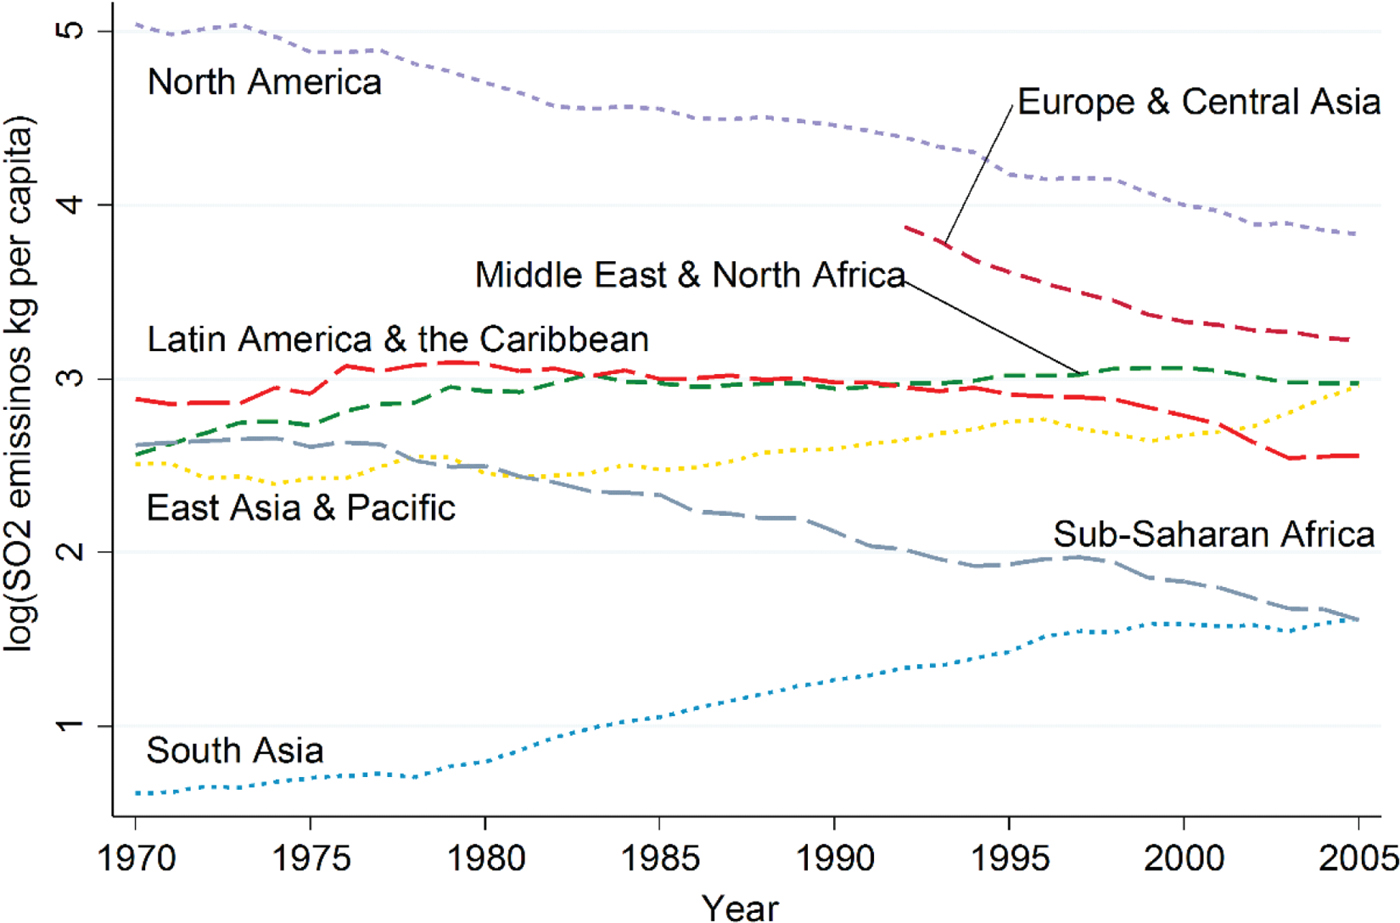
The trend on emissions varies: some are decreasing while others are not (Halkos, Reference Halkos1993, Reference Halkos1994; Managi et al., Reference Managi, Hibiki and Tsurumi2009; Managi, Reference Managi2015; Halkos and Paizanos, Reference Halkos and Paizanos2016; Halkos et al., Reference Halkos, Managi and Tsilika2017). Figures 3 and 4 illustrate the annual trend of CO2 and SO2 emissions in seven regions in the world and show that environmental performance varies considerably among regions. No regions excluding Europe and Central Asia have reduced CO2 emissions per capita, and South Asia, East Asia and Pacific, Middle East and North Africa, and Latin America and the Caribbean all show increases in emissions year by year. On the other hand, SO2 emissions per capita have been reduced in South Asia, Europe and Central Asia, North America, and Sub-Saharan Africa. These trends can be explained by economic development.
Annual trend of SO2 emissions per capita in seven regions (1970–2005)
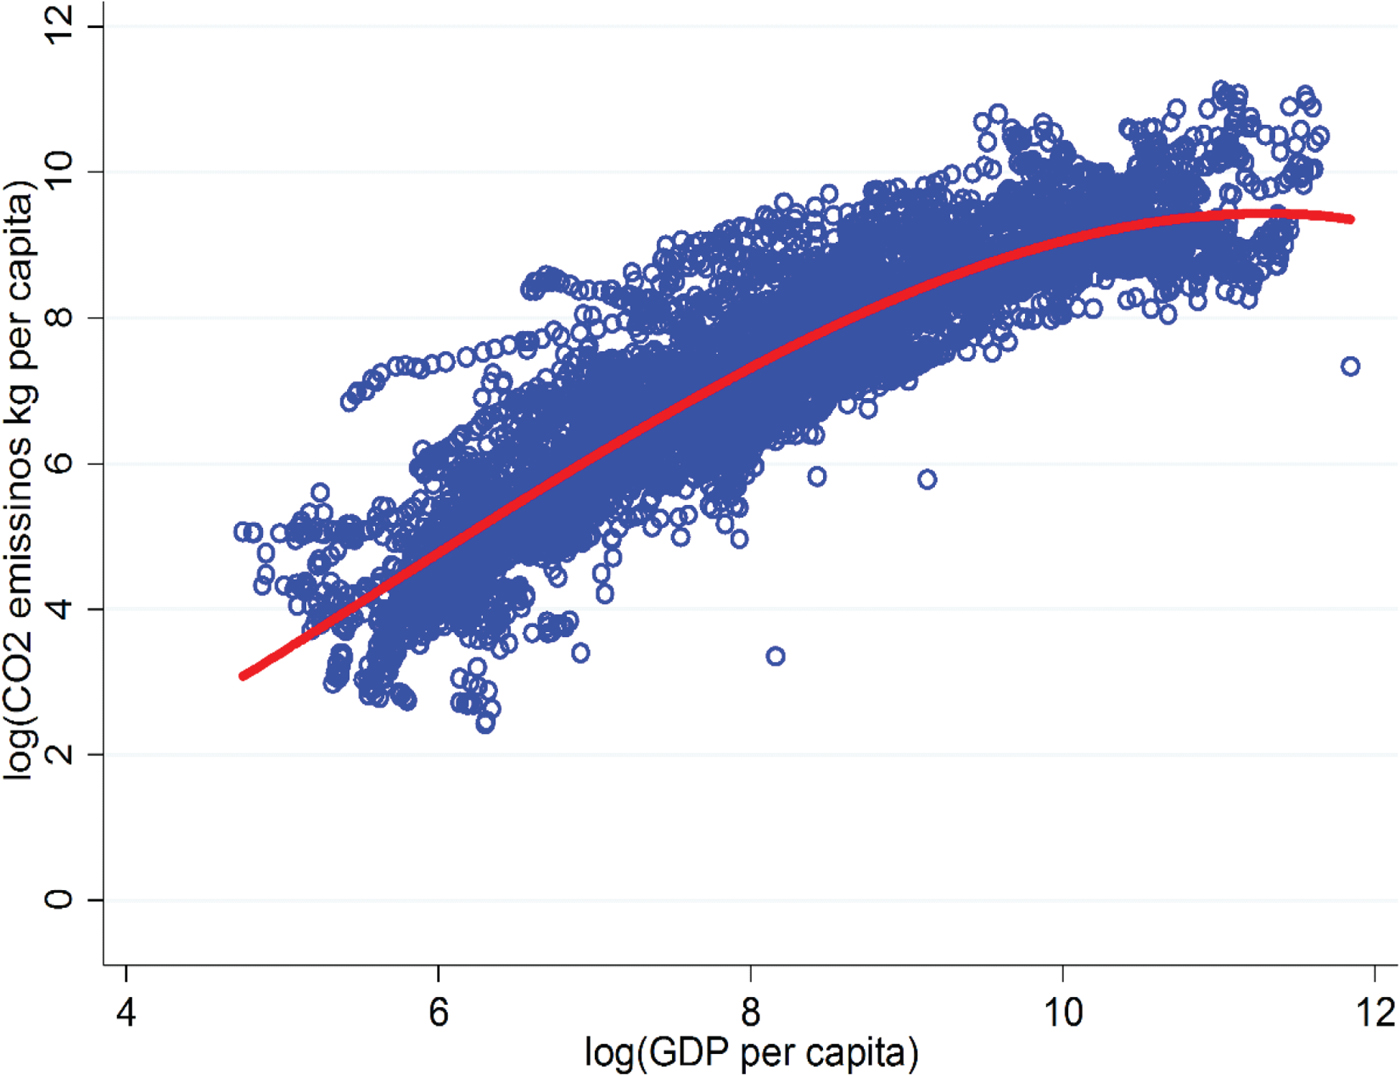
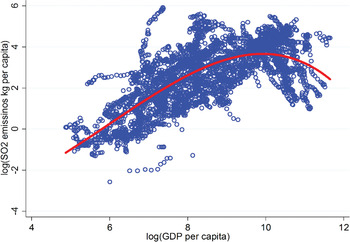
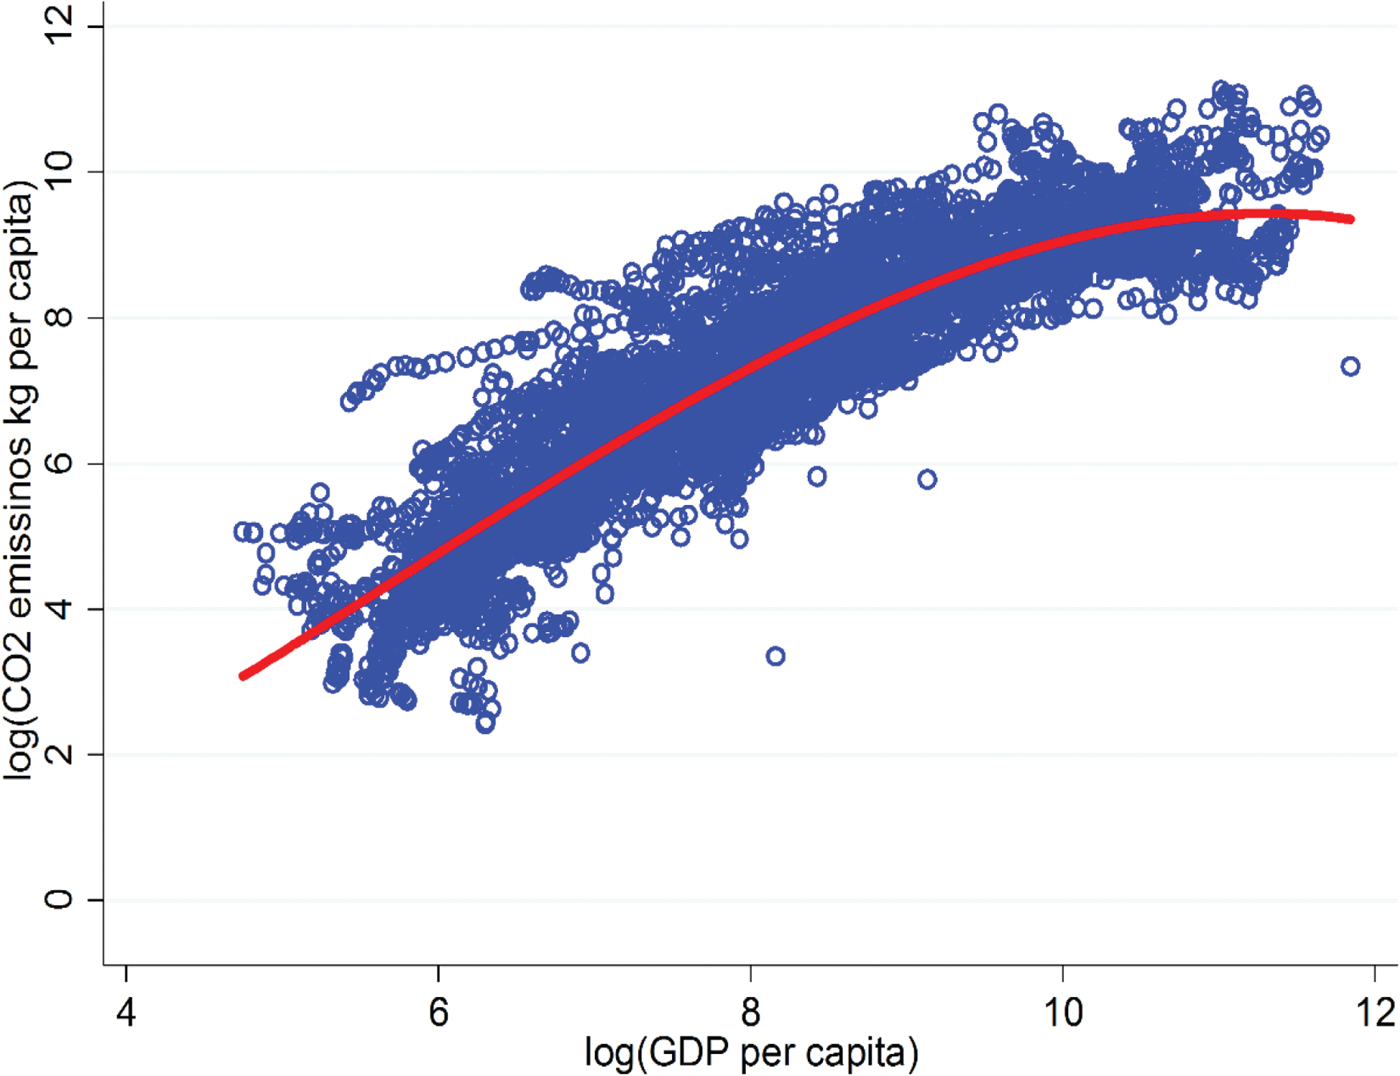
The environmental Kuznets curve (EKC), which is a variation of the Kuznets curve (Kuznets, Reference Kuznets1955), posits an inverted-U relationship between environmental degradation and economic development. The EKC suggests that economic development initially leads to deterioration in the environment, but after a certain level of economic development, a society begins to improve its relationship with the environment and levels of environmental degradation are reduced. Figures 5 and 6 depict the relationship between CO2/SO2 emissions and per capita income. CO2 and SO2 emissions are the most common environmental indices for testing the EKC hypothesis. As shown in both figures 5 and 6, fitting a fractional polynomial trend line reveals the inverted-U shaped relationship between both emissions and income levels. Although most previous studies (e.g., Heil and Selden, Reference Heil and Selden2001; Halkos, Reference Halkos2003, Reference Halkos2013; Miah et al., Reference Miah, Masum and Koike2010; Miyama and Managi, Reference Miyama and Managi2014) find that the data for CO2 exhibit a clear increasing relationship with economic development, the WDI data updated in more recent years have started to show the EKC for CO2. The inverted U-shaped EKC for SO2 can be clearly displayed. In order to achieve sustainable development, environmental quality must be maintained or improved with economic growth.
Relationship between CO2 emissions per capita and GDP per capita (1970–2013).
Relationship between SO2 emissions per capita and GDP per capita (1970–2005)

Even more, and apart from modeling the specification form of the income-environment relationship, the Paris agreement on climate change shows the importance of understanding climate change policy impacts on the economy. The Intergovernmental Panel on Climate Change (IPCC) AR5 Working Group 2 shows uncertainty in damage estimates. Better estimates are essential for future policy discussion. The 1.5°C target on climate change is a rather unexpected outcome as the global policy option for climate change agreement, since many past studies have focused on a 2°C target.
3. Empirical advances on growth and environment
Our special issue covers this important policy request on these questions, such as expected outcome in economy, land use and food availability among others. In light of this progress and new problems, this special issue provides a forum for ‘Recent Advances in Empirical Analysis on Growth and Environment’. Here the key findings of each of the six papers in the special issue are discussed.
Along these lines, the first paper of the special issue by Edward Barbier and Joanne Burgess models the world's ‘carbon budget’ as a resource asset depleted by annual emissions of greenhouse gases, estimating the user cost associated with depletion. Specifically, the user cost method developed here to tackle the world's carbon budget as calculated by the fifth IPCC assessment report is the total amount of anthropogenic CO2 emissions required to reduce global warming below 2°C. In the case of constant emissions, social welfare increases $3.3 trillion (6 per cent of global GDP) over the business as usual scenario of increasing emissions, and the carbon budget's lifetime increases from 18 to 21 years. In the case of declining emissions, the gain is $10.4 trillion (19 per cent of global GDP) and the budget's lifetime is 30 years. Expanding the lifetime of the carbon budget indefinitely would necessitate emissions decreasing exponentially by more than 4.8 per cent. Although the Paris Agreement abatement pledges will generate social gains of $2 to $2.5 trillion (4–5 per cent of world GDP), they are not enough to prevent depletion of the 2°C global carbon budget by 2030.
Moreover, and in terms of land use, the second paper by David Greasley, Eoin McLaughlin, Nick Hanley and Les Oxley relies on Comprehensive Investment (Genuine Savings), which has become a widely-used economic indicator of sustainable development. It explores the utility of the Comprehensive Investment (CI) indicator for Australia by constructing CI data from 1861 over periods of 50 years ahead, providing an indicator of future changes in a country's per capita consumption. CI includes changes in natural, produced and human capital, with allowances for exogenous technological progress. For the case of Australia, and without allowing for technological progress, CI has been positive in most years since 1870. A mean genuine savings ratio is about 5 per cent of GDP, which is possibly what Australia has achieved since 1870, and may be sufficient to comply with the generalized ‘Hartwick’ rule for unbounded consumption over time. But, as shown in this paper, the growth of Australia's consumption after 1870 has sufficiently exceeded what would result from the abovementioned 5 per cent savings rate.
Obviously, the historical data used may not fully reflect all changes in natural capital. Without permitting for technological progress, the CI measures understate future consumption and with allowance for productivity advances the technology augmented measure of savings shows the future changes in consumption remarkably closely. As shown, assuming weak sustainability on which CI is relying, Australia can readily consume natural capital and sustain consumption growth, providing that sufficient technological progress is preserved. In the perspective of strong sustainability, certain forms of natural capital depletion, such as minerals extraction, may have little economic importance, given the lifetimes of remaining reserves at current extraction rates.
The third paper, by David Stern, Reyer Gerlagh and Paul J. Burke, adopts a new approach to modeling the relation between carbon and sulfur dioxide emissions and income, relying on long-run per capita growth rates. In this way, it is possible to test various hypotheses regarding the determinants of per capita emissions, thus dealing with several econometric issues which plague the environmental Kuznets curve literature. It is found that the influence of income growth on emissions is strongly positive, with a mean elasticity, almost unity, for both CO2 and SO2 emissions per capita. But a simple GDP/c growth rates model is not enough to clarify changes in per capita emissions with beta convergence effects adding significant explanatory power for country-level emissions. On the other hand, there is a strong negative time effect for SO2 from -1.0 to -2.2 per cent yearly, while time effects for CO2 are insignificant. There is also a strong verification of convergence across countries. The empirical results present lower elasticities of emissions with respect to income, while it is also found that countries with more abundant fossil fuel endowments have faster emissions growth.
The fourth paper, by Zengkai Zhang and ZhongXiang Zhang, examines the effect of intermediate input linkages on carbon leakage. It develops a Harberger-type model considering the sectoral intermediate input linkage structure. It is found that intermediate input linkage has significant implications for assessing carbon leakage. Through the multiplier effect, sectoral linkages affect carbon leakage in a straightforward way, with producers being able to adjust the intermediate input structure due to climate policies related to the production substitution effect. Additionally, sectoral linkages have an effect on the magnitude of the scale and consumption substitution effects. In more detail, this study proposes a computable general equilibrium model of China's economy, proposing a method to associate the theoretical and empirical models by implementing structural decomposition analysis and examining the effects of China's climate regulations on the electricity generation sector. The empirical findings demonstrate that climate regulations on electricity generation may produce significant leakages, mainly established by the production substitution effect followed by the multiplier effect.
The fifth paper, by Arne Steinkraus, studies the effect of carbon leakage on the environmental Kuznets curve using satellite nighttime light data. It is shown that nighttime lighting is a significant parameter for estimating carbon dioxide emissions worldwide. An inverted-U shaped relationship is evident between light and the associated greenhouse gas emissions and income, finding a turning point at around $50,000. This association is mainly determined by changes in the international trade structure, entailing solid carbon leakage effects. Unfortunately, this inverted-U shape almost disappears if it is controlled for international trade. As with the carbon leakage phenomenon, this result implies that high-income countries export their energy-intense production to less-developed countries. The empirical findings indicate the necessity for global environmental policies, as only comprehensive legislation and global conventions may be able to decrease the total amount of GHG emissions.
The last paper, by Melike Bildirici, uses panel data for G7 countries from 1985 to 2015 and tests the relationship between militarization, CO2 emissions, economic growth and energy consumption. Long- and short-run coefficients and causal relationships between the variables are significant for the energy policy and strategy of G7 countries. Cointegration among the variables of interest was determined using panel Johansen and panel autoregressive distributed lag (PARDL) methods. Further, panel trivariate causality tests were applied, and unidirectional causalities from militarization to CO2 emissions and from energy consumption to CO2 emissions were found. The relation between CO2 emissions, militarization, economic growth and energy consumption was positive and significant with short-run as well as long-run relationships. The empirical findings suggest that in order for G7 countries to reduce their emissions levels, they have to reduce not only energy consumption per unit of output, but also militarization.