


Introduction
In laboratory environments dense flow avalanches may be investigated as granular Hows on inclined chutes. They have the advantage that they can be repeated many times and studied under the same conditions. A disadvantage in the experiment is the difficulty of reproducing the material properties of snow in a dense flow avalanche.
On this subject, different experiments with different materials have been carried out, e.g. in Reference PlÜSSPlöss (1987), using plastic beads, in Reference KosugiKosugi and others (1994), with ping-pong balls, and in Reference Nohguchi, Izumi., Nakamura and SackNohguchi (1997), with styrene-foam particles; in all of these measurements the main focus was on flou propagation and related aspects. In another group of experiments, the main investigation was the measurement of velocity profiles in the flow. There are, e.g. the reviews of Reference Savage, Nedderman, Tüzün and HoulsbySavage and others (1983), Reference Hungr and MorgensternHungr and Morgenstern 1984), Reference DrakeDrake (1990), Nishi mura (1990) and Reference Nishimura, Kosugi and NakagawaNishimura ami others (1993). In all these experiments, different materials (mostly spheres) and bed roughness have been used; in common is the velocity measurement in the body of quasi-two-dimensional flows through transparent side walls.
In this paper, large-scale experiments with ping-pong-ball (PPB) flows in a channeled and open set-up are described, the focus here lies on the velocity distribution (of particle and air) in the flow. For the particle-velocity measurement, a vertically placed video camera is used. This allows a remote measurement in the centre of the flow, without any influence of side walls. The air velocity within the flow is measured on the basis of static pressure depression. The main investigation is the study of the distinct head tail Structure, which is inherent in most granular flows and snow avalanches. These measurements are part of a project investigating the dynamics and internal structures of snow avalanches, including systematic observations of real avalanches in Kurobe Canyon (Japan) and artificially released snow flows on a ski-jump field. The most recent results have been summarized in Reference Nishimura, Nohguchi, Ito and KosugiNishimura and others (1997).
The similarity of granular flows is mainly governed by the following set of physical parameters (from Reference Hutter and SinghHutter. 1995):

with the gravity acceleration g, downslope velocity u flow depth H, particle diameter d, kinematic viscosity of the fluid V, internal angle of friction θ and the bed-friction angle δ. A set of dimensionless quantities follows with

In the present experiments, special care has to be taken With A, the ratio of particle diameter and flow depth. With A ≥ 0.1, this value is rather high. i.e. the PPB flows only correspond to shallow-flow avalanches.
Reference Nohguchi, Izumi., Nakamura and SackNohguchi (1997), on the other hand, described a similarity analysis for the formation of a head-tail structure in granular flows, which depends on the terminal velocity of the flow and on the slope length. This similarity is valid for granular flows with PPB as well as for snow avalanches.
In addition, it can be mentioned that PPB flows fulfill the condition of being calculated easily, since there is no cohesion between the balls. For example, this is most ideal for the application of the Savage-Hutter model (Reference Savage, Nedderman, Tüzün and HoulsbySavage and Hutter, 1989). currently lite most complex model for granular flows that is being used to model snow avalanches.
Experiments and Measures
The channeled flows were carried out in the chute of the Shinjo Branch of Snow and Ice Studies, NIED, Japan. The chute has a slope angle of 30° and a width of 1 m. The ground and one side wall consist of glass plates, while the other side wall is made of wood. The balls were kept in a container on top of the chute. The velocity measurement was made after a run-out distance of 11.5 m in the center of the chute.
The three-dimensional experiments were made at the Miyanomori 70 m ski-jump field in Sapporo. The ground consists of plastic wires (artificial grass for ski jumpers). The balls were put into a large box just below the edge of the jump field, from where the flow could develop over the landing track. After a How distance of 55 m the steepest slope angle of 36° is reached (where the avalanches were in a steady-state condition), and the measurement devices were installed at a distance of 85 m: the video camera for measurement of the particle velocities on the left side, 2.4 m from the How center, and the tubes for air-flow measurement on the right side, 1.5 m from the flow centre.
In all experiments, ping-pong balls with a diameter of 37.7 mm and a weight of 2.48 g (p = 0.0884 Mg m -3) were used. The free-fall velocity is calculated to be 9.4 m s-1. In the chute, avalanches with 2000, 3000 and 6000 balls, and in the three-dimensionฟ set-up, with 150 000, 200000 and 300 000 balls were produced (sec Fig. 1).
Ping-pong-ball avalanche with 250 000 halts on the ski-jump field. The measurement devices will be put on the lowest horizontal line.

Velocity Measurement with a Video Camera
The velocity measurement of the PPBs is based on a uniform ball size; balls close to the observer, e.g. a video camera, appear bigger than balls further away (Fig. 2). That is, with the visible diameter of a ball in the picture frame of the video camera, the location of the ball, including the distance from the camera, can be calculated. If the same ball can be tracked within two subsequent pictures, the three-dimensional velocity vector is obtained. In the calculation, different corrections have to be made, such as the distortion of the lens system and rotation and position of the camera, to the ground. For these measurements an ordinary video camera with a wide-angle lens was used. The height of the camera above the ground was fixed at 470 and 820 mm, in the channeled and open flow, respectively. For evaluation of the coordinates and calculation of the velocities, a maximum resolution of 60 pictures/s, which are stored on the video tape, was used.
Set-up of the video camera at the measurement of the ball velocity (left) and set-up of the tubes at the air-flow measurement (right).

The accuracy strongly depends on the distance of the ball from the camera; at 450 mm, the error in the calculation of the distance is about ± 25 mm, at 800 mm it is increased to ±80 mm. The error in the horizontal coordinate is smaller: the accuracy of the downslopc velocity component is about 5% at a distance of 450 mm with a ball velocity of 8 m s-1, and about 8% at a distance of 800 mm with a ball velocity of 15 m s-1.
To calculate the velocity, a ball has to be seen in two subsequent frames. In the head of dense flows, the density is often so high that only balls from the upper part can he measured.
Air-Flow Measurement with Static Pressure Depression
For this purpose, four tubes were fixed at 0.01, 0.15, 0.3 and 0.45 m above the ground, with their open ends facing downwards (Fig. 2). The inner diameter of a tube is 10 mm, its length is 35 m and the ends are connected to sensitive pressure-difference sensors. The air flow perpendicular to the lube induces a reduced pressure in the tube. For a downslope velocity u the pressure difference Δ P is
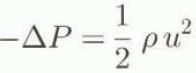
(p is density of the air), To include the tube length, the whole set-up was calibrated in a wind tunnel. However, this equation is only valid for an air How perpendicular to the tube. Since air fluctuations within the ping-pong-ball avalanches must be assumed, this method can only give a rough esti-mate of the air velocity.
Results
Channeled Flows
Characteristics that distinguish head and tail are ball velocity and flow height. Figure 3 shows the maximum velocities, Umax (average of the three highest values in the main flow direction) and the flow height (centre of ball). In the latter, the highest ball has been excluded, assuming it is an isolated jumping ball. The flow height shows clearly the shape of the avalanche head, which is about twice as high as the following tail. A similar tendency can be seen in the velocities. They increase first to a maximum value within the avalanche head and then decrease slightly in the tail. From now on, the head shall be defined as the first part of the flow with a high flow height. For avalanches in the chute, ibis corresponds to 233, 283 and 317 ms (2000, 3000 and 6000 balls, respectively).
Maximum ball velocities and flow heights of the avalanches in the chute with 2000, 3000 and 6000 balls.

The measured front velocities tifr of the flows are: 6.3,6.3 and 6.8 ms-1 (for 2000, 3000 and 6000 balls, respectively). This gives the following ratios of the maximum velocity to the front v elocity u
max/u
fr: 1.4, 1.43 and 1.35. Thus, a mean ratio
 can be assumed.
Figure 4 is a representation of vertical profiles in the head of the avalanche with 3000 balls. In each profile, the start and end points of the balls after a lime interval of 17 ms are given. It can be seen that vertical activity is high; the balls are jumping up and down.
Vertical profiles in the head of the avalanche with 3000 halls.

Averaged vertical profiles of the downslope velocity components in the rear part of the head (117-167 ms, where u
max≈const.) and tail are given in Figure 5. In the head, the vertical profiles show lower velocities at ground level: the balls in the middle part of the flow and towards the sur-face are ≈1ms-1 faster. In the tail, this is very different; the profiles are almost constant and no reduced velocities at ground level can be seen. The mean flow heights in the tail are 70, 70 and 90 mm, corresponding to about 2.5, 2.5 and 3 layers of balls. Since there are few jumping balls, the flow heights in Figure 3 appear to be larger. The lateral profiles in the head and tail are constant. The lateral component of the velocities
 is small anyway; it is
 at any time and at all avalanche sizes in the chute.
Averaged vertical profiles of the downslope velocity components in the rear part of the head (left) and in the tail (right) of the avalanches in the chute.

The volume fraction Cball of the balls in the flow was not measured directly. Estimations give Cball ≤ 0.3 in the lower parts of the head, which decreases to Cball ≤ 0.05-0.1 in the tail.
Another difference between head and tail follows from the fluctuations in the different velocity components. The mean standard deviations
 and
 (which is the square root of the granular temperature, as was introduced by Reference OgawaOgawa (1978)), calculated from the velocities at each time-step and then averaged over the head and tail, are given in Table 1. The fluctuations are always higher in the head than in the tail.
Mean velocity fluctuations in head and tail for the different avalanche sizes in the channeled flow.

Open Flows
The same represent at ions of the maximum downslope velocities and flow heights with time for the unconfined flows at the Miyanomori ski jump are given in Figure 6. The curves are no longer similar for the different flow sizes. This corresponds to a varying flow pattern in the open run-out (see also Fig. 1). For example, for the smallest avalanche, the position of the video camera was near the edge of the flow, where the head is relatively long. This situation has an influence on the ratio of the maximum velocity in the flow u max to the front velocity u fr; for the 150000 ball avalanche umax/u fr= 1.15 but for the larger avalanches it is 1.25 and 1.23 (the front velocities are 13.6,13.6 and 15.0 m s-1, respectively).
Maximum ball velocities and flow heights of the avalanches in the open flow with 150 000, 200 000 and 300 000 balls.

Figure 7 shows vertical and lateral profiles in the head of the avalanche with 200000 balls. The time interval of one profile is 17 ms. Again, there is high vertical activity. The lateral profiles show a strong outwards movement (luring the first 50 ms (corresponding to a length of about 0.7 m), away from the centre of the flow (which is at y = -2.4 m). After this first part in the head, there is no more specific lateral movement. Further behind the head (from 133-167 ms) the lateral profiles are not uniform; the balls with low y values, towards the centre of the flow, are faster. Towards the tail (from 183 ms on), this tendency cannot be recognized anymore; there, the flow seems to be uniform, without an) specific lateral velocity component. As in the channeled flows, the vertical profiles in the tail (Fig. 8) are almost constant. The mean flow heights in the tail are 100, 120 and 140 mm, corresponding to about 3,3.5 and 4 layers of balls.
Vertical (above) and lateral (below) profiles in the head of the avalanche with 200 000 balls.

Averaged vertical profiles of the downslope velocity components of the PPBs (left) and of the air (right) in the tail of the avalanches in the open flow.

Again, the fluctuations of the different velocity components in the head are higher than in the tail (Table 2).
Mean velocity fluctuations in head and tail for the different avalanche sizes in the open flow

All results listed above describe characterizations of the balls in the avalanche. With measurement of the static pressure depression, characteristics of air flow around the balls and above the flow can be obtained. In Figure 8, mean velocities in the tail are given. The vertical profiles are more or less uniform. Remarkably, there are no reduced air velocities above the flows. A second sensor at a height of 150 mm is at the surface of the tail of the PPB flow; above this there are only jumping balls. But the flow-induced air movement can be seen even 300-350 mm above the flow surface and 250-300 mm above the highest jumping flails.
Discussion
In ping-pong-ball avalanches as in other similar flows, the formation of a head is very obvious, for example, something which does not occur in flows using golf balls. From the results, the head and tail are distinguished in many ways, which are summarized in the following. Most remarkable is height, which is more than twice as high in the head as in the tail. The downslope velocity increases to its maximum in the head, while it is somewhat lower in the tail. Only in the head is there any influence of ground friction. The fluctuations of all velocity components are higher in the head than in the tail. All of this comes together with higher ball concent rations in the head. Since the maximum How velocity is in the head and not in the tail, there is no feeding of new balls from the rear part of the flow to the front. This is a general occurrence in such a short gravity current.
The different vertical velocity profiles in head and tail are very interesting. Phis can be explained by the low concentration in the tail. There are fewer contacts from ball to ball than in the dense head. This allows a longer free length until the next ball contact. As a result, the momentum in the tail is distributed throughout the whole flow height. This is not possible in a dense head; the moment urn cannot be transferred immediately from the bottom to I fie top and vice versa.
Comparing these velocity profiles with the above-mentioned measurements in other granular flows, the almost vertical profile is striking, whereas in other flows the halls al ground level are much slower. Although all these measurements vary in many aspects (such as diameter, density, volume fraction, elasticity, restitution and angle of friction of particles, acceleration or steady state of flow), tw o points seem to be important: the ratio A = d/H, which is comparatively high in the present experiments and the roughness which is very low.
A comparison of the velocity profiles obtained with the few available measurements for dense-flow avalanches in Nature (Reference GublerGubler, 1987: Reference Dent, Adams, Bailey, Jazbulis and SchmidtDent and others, 1994) points out the dilferent behaviour at the bottom of the flows. While in Nature, at ground level a high-velocity gradient and therefore high shear stress is measured, there is nothing similar to be seen in the PPB avalanches. Above the zone of high-velocity gradients, all profiles are similar, showing roughly constant velocities. There are dilferent material properties, ground friction, etc., which explain the different flow structures near ground level. However, in spite of the different properties, in the upper part of the flow ihc profiles are similar.
The higher fluctuation of the downslope velocity in the head partly follows from the vertical velocity gradient, since the fluctuation was calculated from the mean velocity of all measured balls at the same time. But the higher fluctuations of the other velocity components, where no distinct velocity gradient is measured, show thai there is in general increased activai y in the head.
The ratio of maximum velocity to front velocity u max/u fr in the open flow is lower than in the chute. It can be seen that the velocities in the centre of the How are higher, so that the same ratio u max/u fr ≈ 1.4 can be readied as observed in the chute. For comparison, in powder-snow avalanche experiments in the laboratory (Reference KellerKeller, 1996) using small glass spheres as the particle phase and water as the fluid phase, a constant ratio u max/u fr = 1.5 has been found, which is independent of the initial particle volume, distance in the run-out zone and slope angle. Further measurements using ping-pong balls have to prove whether the velocity ratio in PPB flow s shows the same behavior.
The PPB avalanches in the chute have a very small lateral velocity component and it has been shown that the in-iluence of the side walls on the velocity distribution is below the accuracy of the measurement. Thus, such a channeled avalanche can really be regarded as a two-dimensional flow. This is dilferent from the open flow on the ski-jump field. The head shows a rather complex structure with a short lime of 0.05 S (which corresponds to a flow length of approx. 0.7 m), where the velocity is directed outwards from the main (low direction. in the same time, the velocity increases, lbllowcd by a short period (roughly 0.08s), when the downslope velocities of the balls closer to the middle of the flow are slightly higher. Afterwards, in the rear part of the head and in the tail, the flow is uniform and can be regarded as two-dimensional.
The measurement of the air velocity in and above the tail shows high flow-induced velocities distinctly above those of the flow surface. A possible explanation is that the high avalanche head accelerates all of the air mass up to the height of the head and even higher and after decrease of lite avalanche height the air in the upper parts keeps moving at least some meters behind the head where the air flow was measured. With this strong air flow clearly above the flow itself, it can be understood why the highest-jumping PPBs in the tail do not show any reduced velocity due to air friction: they move within the accelerated air.
The method described for the remote measurement of the location and v elocity of a ball using a video camera is appropriate for such flows. However, this method is restricled to flows using spheres of uniform sizes or using easily distinguishable different diameters. The accuracy of the distance measurement is restricted to the pixel resolution of the video camera and the quality of the data-recording system.
The measurement of the air velocity on the basis of static pressure depression seems to be a useful technique for two phase Hows, where another system such as a wind anemometer does not work anymore. But it is a serious deficiency that the flow direction, which cannot be measured using a single tube, has a strong influence on the pressure depression. An improvement to the system, which is currently being applied to new measurements, uses differently orientated tubes at the same point.
Conclusions
It has been shown that large-scale experiments with ping-pong-ball avalanches allow a study of specific features of granular flows, which also lead to a better understanding oí dense-flow avalanches. Different aspects of the head-tail structure, which is a typical property of many granular flows, including snow avalanches, are pointed out. The measurements show that, in the present set-up using a smooth surface, there is only slip almost at ground level. A dependence of the shear flow on the ratio A = d/H (particle diameter/flow depth) in the ping-pong-ball flows can be assumed, and in comparison with other measurements this ratio seems to be at its upper limit.
In future experiments, it might be useful to include different bed roughness and dependence of the shear flow and the vertical velocity profiles on flow height should be studied.
Acknowledgements
The authors gratefully acknowledge all the people who joined our experiments in Shinjo and at the ski jump in Sapporo and who contributed in many different ways. This work was made possible by thejapanese Society for the Promotion of Science (JSPS); the experiments were partly supported by a grant-in-aid for Co-operative Research and Science Research from the Ministry of Education, Science and Culture, Japan.



