Implications
Differences in the raw materials used for ethanol production in the European Union and in processing details result in a high variability of the chemical composition of dried distillers’ grains with solubles (DDGS), which is an important by-product largely used in the feeding of dairy cows. It is important to consider that not only the content of rumen undegradable protein and its concentration of amino acids (AAs) such as lysine and methionine, but also protein digestibility vary greatly between different sources of DDGS. This should be considered when attempting an efficient protein and AA utilization of the cow.
Introduction
Ethanol production has increased considerably in the European Union. The increasing demand of energy, increasing raw oil prices and the implementation of the European Programme for the use of energy from renewable sources favours further growth of ethanol production. Subsequently, the production of dried distillers’ grains with solubles (DDGS) as the main by-product of ethanol production is expected to increase. The DDGS is well recognized as a good energy and protein source for feeding of livestock, especially cattle. However, European DDGS varies substantially in nutritional composition, energy value or content of rumen undegradable crude protein (UDP; Cozannet et al., Reference Cozannet, Primot, Gady, Métayer, Callu, Lessire, Skiba and Noblet2010, Reference Cozannet, Primot, Gady, Métayer, Lessire, Skiba and Noblet2011; Westreicher-Kristen et al., Reference Westreicher-Kristen, Steingass and Rodehutscord2012). The variability in the feeding value in conjunction with the expected increase of DDGS production demand for further and more specific characterization of this by-product.
In high-yielding dairy cows, UDP substantially contributes with 20% to 50% to the supply of amino acids (AAs) at the duodenum (Storm and Ørskov, Reference Storm and Ørskov1983). Hence, the AA composition of UDP and its intestinal digestibility (ID) are further important characteristics of the protein value of a feedstuff (Weisbjerg et al., Reference Weisbjerg, Hvelplund, Hellberg, Olsson and Sanne1996). Unlike the well-balanced AA profile supplied by the microbial protein, AAs coming from the UDP largely reflect the AA pattern of the original feed (Kleinschmit et al., Reference Kleinschmit, Anderson, Schingoethe, Kalscheur and Hippen2007; Mjoun et al., Reference Mjoun, Kalscheur, Hippen and Shingoethe2010; Li et al., Reference Li, Li, Yang and Beauchemin2012). However, AAs of the UDP sometimes do not match the AA needs of the cow in terms of concentration and digestibility. This may become especially relevant if the UDP content of a feedstuff is high and one AA is particularly low, as is the case for lysine in DDGS. Knowledge about whether or not the AA composition of DDGS and UDP fraction of DDGS are similar is important for ration formulation and has been reported so far (Kleinschmit et al., Reference Kleinschmit, Anderson, Schingoethe, Kalscheur and Hippen2007; Mjoun et al., Reference Mjoun, Kalscheur, Hippen and Shingoethe2010; Li et al., Reference Li, Li, Yang and Beauchemin2012). However, these experiments only considered a maximum of five samples of DDGS mainly originating from corn and did not consider blend-DDGS or DDGS originating from a wide variety of grains or mixtures like those produced under European conditions.
The determination of the ID of UDP is a prerequisite for calculating the AA supply to the cow. It has often been assumed that the ID of UDP is constant. However, ID of UDP from corn-DDGS was found to be reduced in batches that had a high UDP content (Kleinschmit et al., Reference Kleinschmit, Anderson, Schingoethe, Kalscheur and Hippen2007). As the UDP content in European DDGS samples was largely variable (Westreicher-Kristen et al., Reference Westreicher-Kristen, Steingass and Rodehutscord2012), the question is whether any variation of the ID of UDP is related to the UDP content of DDGS. In vivo determination of the ID of CP in ruminants is expensive and time-consuming. In addition, endogenous losses of protein at the intestinal level might have some influence on in vivo results. A method used by ruminant nutritionists is the three-step in vitro procedure for estimating intestinal digestion of protein (Calsamiglia and Stern, Reference Calsamiglia and Stern1995). In this approach, after ruminal incubation, feed is subsequently incubated with pepsin and pancreatin solutions. Undigested protein remaining after incubation is precipitated with trichloroacetic acid and separated by centrifugation and, finally, the supernatant is analysed for N by the Kjeldahl method. In addition, Boisen and Fernández (Reference Boisen and Fernández1995) proposed a very similar in vitro method in terms of the enzyme digestion steps used on the basis of the pepsin–pancreatin solubility of CP (PPS) to predict the ID of feedstuff for pigs. Although in vitro methods cannot precisely simulate an in vivo situation, the proposed method was found to be reliable for a quick characterization and prediction of ID of dry matter (DM) and CP.
The objectives of this study were (1) to compare the in situ ruminal degradation of CP and AAs of DDGS from European ethanol plants and (2) to estimate the ID of UDP with the PPS method using either DDGS samples (DDGS-s) or DDGS residues (DDGS-r). We hypothesized that (1) it is possible to predict the ruminal degradation of individual AAs from CP degradation; (2) there exists a large variation of the PPS of UDP of DDGS; and (3) there is a relationship between the PPS and in situ UDP.
Material and methods
Samples
Thirteen samples of DDGS from ethanol facilities located in eight European countries were studied. One sample per factory was obtained. Detailed nutrient composition, energy and protein values of the DDGS studied in this experiment were reported previously (Westreicher-Kristen et al., Reference Westreicher-Kristen, Steingass and Rodehutscord2012). In brief, the samples originated from wheat, corn, barley and blends of different substrates. Ten samples were in pellet form. Chemical fractions varied among samples and were (in g/kg DM±standard deviation): 310±33 CP, 86±37 ether extract, 89±18 CF, 408±39 neutral detergent fibre, 151±39 acid detergent fibre, 62±31 acid detergent lignin, 21±5 neutral detergent-insoluble nitrogen and 8±4 acid detergent-insoluble nitrogen (ADiN). The concentration of UDP at a passage rate of 8%/h varied from 9% to 63% of CP. Metabolizable energy was estimated to vary between 10.9 and 12.8 MJ/kg DM.
In situ rumen degradation of CP and AAs
The rumen degradation of CP and AAs was determined using nylon bags incubated in the rumen. Four non-lactating cows fitted with a rumen cannula were used. The cows were fed twice daily a ration consisting of hay (9% CP and 32% CF) supplemented with 2 kg of concentrate (30% wheat, 30% maize, 22% rapeseed cake, 15% field beans and 3% of a mineral and vitamin premix). Hay and water were offered for ad libitum consumption. Around 8 g of sample, in original conditions, was placed into nylon bags (10×20 cm, ∼50 µm of pore size, Type R1020, Ankom Technology, Macedon, NY, USA). Nine nylon bags per DDGS and cow were ruminally incubated for 16 h. This incubation time was chosen as a universal standard that represents a rumen outflow rate of 6.3%/h, which corresponds to a feeding level of about 2.5×maintenance (Agricultural and Food Research Council (AFRC), 1993). In addition, Calsamiglia and Stern (Reference Calsamiglia and Stern1995) found no differences in the PPS of UDP of different plant and animal protein sources when samples were pre-incubated in the rumen between 12 and 18 h. Immediately before placement in the rumen, the filled nylon bags were soaked in warm water (∼39°C) for 15 min. The bags were introduced into the rumen immediately after the afternoon feeding. Three separate runs at different days were required to incubate all the samples and to obtain enough DDGS residues for further analyses. Three nylon bags were assigned to each run and cow and all samples were incubated simultaneously in each run. After incubation, the bags were removed from the rumen and immersed in ice-cold water to minimize microbial activity. Thereafter, the bags were rinsed in cold tap water to remove the excess ruminal contents and were stored frozen (−20°C) until the end of the experiment. The incubated bags were washed with cold water in a washing machine (extraKLASSE E12.18 Siemens, Berlin, Germany) for 15 min without centrifugation, and subsequently freeze-dried, weighed and ground to pass a 0.5 mm screen for later analyses of DM, CP and AAs.
In vitro PPS
The PPS was determined according to the pepsin and pancreatin procedure described by Boisen and Fernández (Reference Boisen and Fernández1995). The DDGS-r obtained after the ruminal incubation and DDGS-s ground to pass a 0.5 mm sieve were used. For analysis, the DDGS-r were pooled per DDGS and per cow, resulting in four repetitions for each DDGS sample. The PPS analysis was carried out in triplicate. Briefly, samples (500±5 mg) were suspended in 100 ml Erlenmeyer flasks with 25 ml phosphate buffer (0.1 M; pH 6.0) and incubated with 10 ml 0.2 M HCl and 1 ml pepsin solution (0.01 g/ml; Merk 7190, 200 FIP U/g) for 6 h at a pH of 2.0 to simulate abomasal digestion. Thereafter, 5 ml of 0.6 M NaOH and 10 ml of a phosphate buffer were added, and the pH of the samples was adjusted to 6.8 with 5 M HCl or 5 M NaOH using a pH meter. Immediately, the samples were incubated with 1 ml pancreatin solution (0.05 g/ml; Sigma P-1750) for 18 h to simulate small intestinal digestion. The incubations were performed under constant stirring in an oven at 40°C. After in vitro incubation, samples were treated with 5 ml of solution containing 20% of sulfosalicylic acid for 30 min at room temperature. Then, the whole content of the Erlenmeyer flasks was filtered through nylon bags (4×12 cm, ∼30 µm of pore size, No. 10-0127, C. Gerhardt GmbH & Co. KG, Bonn, Germany) and washed with ethanol and acetone. The nylon bags containing the insoluble residues were weighed, dried for 4 h at 103°C and analysed for CP content. Simultaneously, in each incubation run, two blanks containing only incubation solutions and without samples were treated the same way and used for correction of PPS. Owing to shortage in the sample size after rumen incubation, one sample of DDGS-r could not be analysed for PPS.
Chemical analyses, calculations and statistical analyses
The chemical analyses followed the official analytical standards in Germany (Verband Landwirtschaftlicher Untersuchungs- und Forschungsanstalten (VDLUFA), 2006). The DDGS-s, DDGS-r and PPS residues were analysed for DM and CP content (methods 3.1 and 4.1.1, respectively). The AA analysis of DDGS-s and DDGS-r were run in duplicate. The samples were hydrolysed with 6 M HCl for 24 h at 110°C after oxidation using performic acid and hydrogen peroxide (Rodehutscord et al., Reference Rodehutscord, Kapocius, Timmler and Dieckmann2004). Norleucine was used as the internal standard. Separation and detection of AAs were carried out with an AA analyser (Hitachi L-8900). Photometric detection was at 570 nm (440 nm for proline) with post-column ninhydrin derivatization. Methionine and cysteine were determined as methionine sulfone and cysteic acid, respectively. Owing to shortage in the amount after rumen incubation, only 11 samples of DDGS residues could be analysed for their AA contents.
The rumen degradation of AAs was calculated by the difference of AA from DDGS weighed into the nylon bags and the AAs remaining in the respective bags after rumen incubation. The rumen degradation of CP and of individual AAs were statistically compared within each DDGS sample. The milk protein score (MPS) was calculated as (g of essential AA/kg CP)/(g essential AA in milk/kg of milk protein) according to Schingoethe (Reference Schingoethe1996), and estimates of the AA content of milk protein were according to Waghorn and Baldwin (Reference Waghorn and Baldwin1984). The PPS of DDGS-s and DDGS-r was calculated by the difference of the original amounts of N, and the N remaining in the nylon bags after incubation with pepsin and pancreatin. Avoiding the laborious rumen incubation would be a considerable simplification. Therefore, we attempted the direct determination of CP digestibility of UDP from DDGS-s. In addition, the PPS of DDGS-s is a valuable information to assess the protein value of DDGS for non-ruminants. The intestinally absorbable dietary protein (IADP) was calculated as UDP×PPS/100, where IADP and UDP are in per cent of CP, and PPS in per cent.
All statistical analyses were performed using the software package SAS (version 9.2, SAS Institute Inc., Cary, NC, USA). Correlations and linear regressions were tested using the CORR and REG procedure, respectively. Data were subjected to ANOVA using the GLM procedure. Significant differences between individual means were identified using the least significance difference. All significant differences were declared at P<0.05, with tendencies associated with the P-value between 0.05 and 0.10.
Results
AA content and in situ rumen degradation of CP and AAs
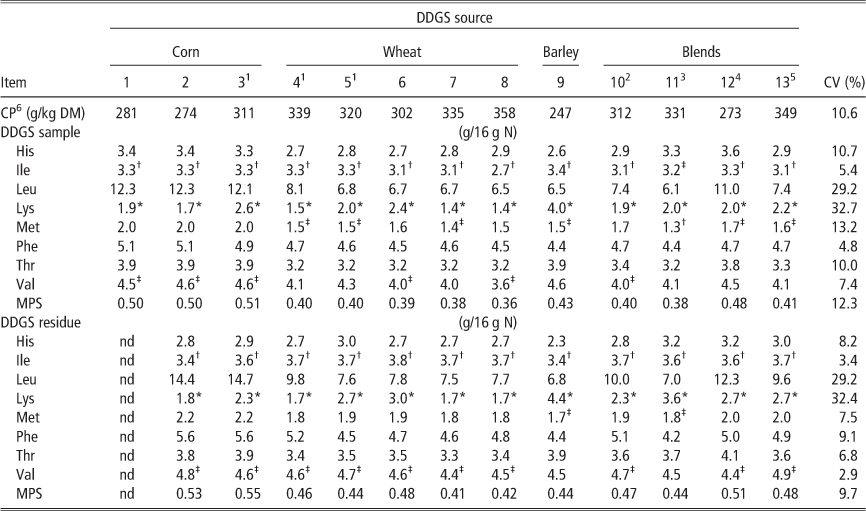
The essential amino-acid (EAA) composition, the MPS and the ranking of the three most limiting EAAs of the DDGS-s and DDGS-r are shown in Table 1. Among the EAA, and according to the coefficient of variation (CV), lysine, leucine and methionine were the most variable (32.7%, 29.2% and 13.2%, respectively). Lysine averaged 2.1 g/16 g N and ranged from 1.4 to 4.0 g/16 g N. Leucine had the highest concentration among the EAA, averaging 8.5 g/16 g N. Methionine averaged 1.6 g/16 g N and ranged from 1.3 to 2.0 g/16 g N. The MPS of DDGS-s averaged 0.43 and ranged from 0.36 to 0.51. According to MPS, lysine was the first limiting AA in all DDGS; isoleucine was the second limiting AA in 12 DDGS, whereas methionine and valine were the third limiting AAs in six of the 13 DDGS.
Concentration of CP and EAA and MPS of dietary and residues of distillers’ dried grains with solubles with CV

EAA=essential amino acid; MPS=milk protein score; DDGS=dried distillers’ grains with solubles; nd=not determined due to shortage in sample size.
MPS=(g of EAA/kg CP)/(g EAA in milk/kg of milk protein) according to Schingoethe (Reference Schingoethe1996).
*,†,‡indicate the apparent sequence of the first, second and third most limiting AA, respectively, on the basis of the estimates of the AA content of milk protein (Waghorn and Baldwin, Reference Waghorn and Baldwin1984).
1 Not pelleted.
2 Wheat : barley : corn : sugar beet syrup in unknown proportions.
3 Wheat : barley malt 85 : 15.
4 Corn : barley malt 85 : 15.
5 Wheat : corn : triticale 68 : 25 : 7.
6 Originally presented by Westreicher-Kristen et al. (Reference Westreicher-Kristen, Steingass and Rodehutscord2012).
In all DDGS-r, the first and second limiting AAs were lysine and isoleucine, respectively. The concentration of EAA was slightly higher and that of non-essential amino acid (NEAA) was lower in DDGS-r than in DDGS-s. Therefore, the MPS of DDGS-r were slightly higher, averaging 0.47 and ranging from 0.41 to 0.55.
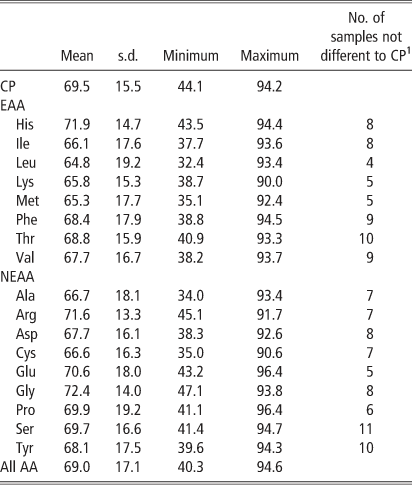
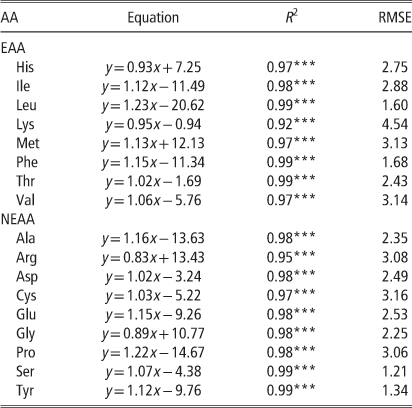
After 16 h of ruminal incubation, the CP degradation varied widely from 44.1% (sample 4) to 94.2% (sample 11) (Table 2). This was similar for total AA degradation, which varied from 40.3% to 94.6%. The mean rumen degradation of individual AA varied from 64.8% (leucine) to 72.4% (glycine). The rumen degradation of lysine and methionine varied from 38.7% to 90.0% and from 35.1% to 92.4%, respectively. Of all the analysed samples (n=11), the majority of the degradation values for individual AA were statistically similar to their respective CP degradation (P>0.05), with the exception of leucine, lysine, methionine and glutamic acid. For these four AAs, in more than half of the DDGS samples, rumen AA degradation values were statistically different from rumen CP degradation. The degradation of EAA was slightly lower than CP degradation, with the exception of histidine. Among the NEAAs, the AA degradation tended to be similar or slightly higher than the CP degradation (69.5%), with the exception of alanine, asparagine, cysteine and tyrosine (data not shown). Regression equations showed significant relationships between the degradation of CP and degradation of lysine and methionine (R 2=0.92 and 0.97, respectively; Figure 1), as well as between CP degradation and degradation of other EAAs and NEAAs, with R 2 values from 0.95 to 0.99 and low root mean square error (RMSE) for all AAs (Table 3).
Relationship between the ruminal degradation of methionine (□; y=1.131x+12.13; R 2=0.97; P<0.0001) and lysine (▼; y=0.954x−0.94; R 2=0.92; P<0.0001) and the degradation of CP.
In situ degradation (%) of individual amino acids and CP after 16 h ruminal incubation of DDGS (n=11) with means, s.d. and ranges of values
DDGS=dried distillers’ grains with solubles; s.d.=standard deviation; EAA=essential amino acid; NEAA=non-essential amino acid; AA=amino acid.
1 P≥0.05 between individual AA degradation and CP degradation, one value calculated on mean of four replicates (cows) per DDGS.
Relationship between ruminal degradation of individual amino acids and CP of DDGS
DDGS=distillers’ dried grains with solubles; AA=amino acid; RMSE=root mean square error; EAA=essential amino acid; NEAA=non-essential amino acid.
y=ruminal degradation of amino acid (%), x=ruminal degradation of CP (%).
***P<0.001.
In vitro PPS of CP
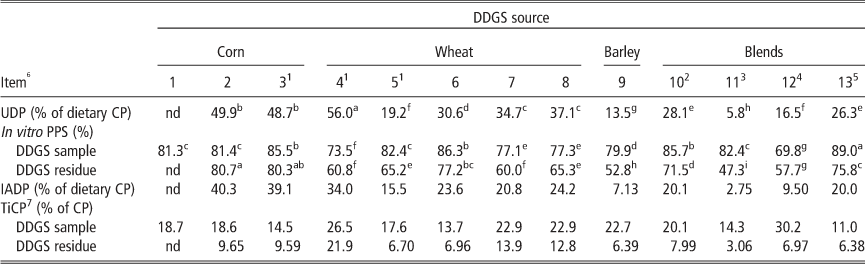
The PPS of DDGS-s was higher than that of DDGS-r and varied from 69.8% to 89.0% and from 47.3% to 80.7%, respectively (Table 4). Considering the raw materials, corn-DDGS averaged the highest PPS (81%), followed by wheat-DDGS (66%) and blend-DDGS (63%). The PPS of blend-DDGS was similar to that of wheat-DDGS but was the most variable (47% to 76%). The PPS of barley-DDGS was 53%. IADP averaged 21% of CP and varied considerably from 2.8% to 40.3% of CP.
UDP values, in vitro PPS, and calculated IADP of DDGS and DDGS residues
PPS=pepsin–pancreatin solubility of CP; IADP=intestinal absorbable dietary protein; s.d.=standard deviation; TiCP=total indigested CP; DDGS=distillers’ dried grains with solubles; UDP=undegradable CP; nd=not determined due to shortage in sample size.
1 Not pelleted.
2 Wheat : barley : corn : sugar beet syrup in unknown proportions.
3 Wheat : barley malt 85 : 15.
4 Corn : barley malt 85 : 15.
5 Wheat : corn : triticale 68 : 25 : 7.
6 UDP after 16 h ruminal incubation; in vitro PPS determined through the pepsin–pancreatin method; DDGS residue obtained after 16 h of ruminal incubation; IADP=UDP×PPS/100.
7 TiCP of DDGS sample=100−PPS DDGS sample; TiCP of DDGS residue=100−UDP−IADP.
a b,c,d,e,f,g,h,iDifferent superscripts indicate significant differences between samples (P<0.05).
There was only a tendential relationship (P=0.06) between the PPS of DDGS-s and PPS of DDGS-r (Figure 2) with a low R 2 (0.31). To estimate the PPS of DDGS-r, correlations with chemical constituents and protein fractions of DDGS-s previously published (Westreicher-Kristen et al., Reference Westreicher-Kristen, Steingass and Rodehutscord2012) were calculated. Of the chemical constituents, only CF was correlated with the PPS of DDGS-r (r=−0.66, P=0.02). Among protein fractions according to the Cornell Net Carbohydrate and Protein System (Licitra et al., Reference Licitra, Hernandez and van Soest1996), the PPS was negatively correlated with protein fraction A (r=−0.75) and positively with fractions B2 and B3 (r=0.64 and 0.61, respectively), whereas protein fraction C or ADiN only tended to correlate with PPS (r=−0.51, P=0.09). Other chemical constituents neither had significant relations nor tended to correlate with PPS. When estimating the PPS of DDGS-r from chemical composition, only CF delivered a significant equation but with a low coefficient of determination (PPS=−0.109CF+149.5, R 2=0.43, P=0.02), whereas ADiN. delivered a non-significant one (PPS=−0.213ADiN+106.1, R 2=0.26, P=0.09). The estimation of the PPS of DDGS-r from the UDP value of DDGS-s was significant but with low relationship (PPS=0.86UDP+30.73, R 2=0.37, P=0.04).
Relationship between in vitro CP pepsin–pancreatin solubility of DDGS samples and DDGS residues after the rumen incubation (y=1.090x−21.9; R 2=0.31; P=0.06; n=12).
Discussion
AA profile and in situ rumen degradation of CP and AAs
The high variability of lysine concentration in DDGS that we found confirmed results from previous reports (Spiehs et al., Reference Spiehs, Whitney and Shurson2002; Stein et al., Reference Stein, Gibson, Pedersen and Boersma2006). In addition, the lysine content in DDGS was similarly reported to be the most variable among AAs (Cozannet et al., Reference Cozannet, Primot, Gady, Métayer, Callu, Lessire, Skiba and Noblet2010, Reference Cozannet, Primot, Gady, Métayer, Lessire, Skiba and Noblet2011). High variability of lysine could be explained partly by the variable degree of heating during the drying process of DDGS (Kleinschmit et al., Reference Kleinschmit, Anderson, Schingoethe, Kalscheur and Hippen2007), which could reduce the concentration and availability of lysine. Fontaine et al. (Reference Fontaine, Zimmer, Moughan and Rutherfurd2007) found a linear decrease of lysine concentration in DDGS as a function of heat treatment time. Moreover, DDGS is often pelleted, a process involving additional heat, which may affect lysine availability. Maillard reactions have been divided into early, advanced and final reactions (Mauron, Reference Mauron1981). Final reactions decompose AA resulting compounds that are not detected by AA analysis (Classen et al., Reference Classen, Newkirk and Maenz2004), thus resulting in lower concentrations of AA in the sample. The methionine concentration was higher for corn-DDGS than for wheat-DDGS and similar values were reported previously (Stein et al., Reference Stein, Gibson, Pedersen and Boersma2006; Widyaratne and Zijlstra, Reference Widyaratne and Zijlstra2007). Variability of the AA content could be also explained by the use of different raw materials and their mixtures. Finally, the contribution of yeast used during ethanol production should be also considered as a source of AA and its variation. Li et al. (Reference Li, Li, Yang and Beauchemin2012) found that the changes in the AA profile from the original grain to its DDGS did not follow the same trend as the changes in CP, suggesting that yeast AA would have influenced the AA profile of DDGS. More specifically, Han and Liu (Reference Han and Liu2010) found that yeast contributed about 20% to DDGS protein.
Concentrations of EAAs slightly increased after rumen incubation. Similar tendencies were found by Kleinschmit et al. (Reference Kleinschmit, Anderson, Schingoethe, Kalscheur and Hippen2007), but contradictory results were reported by Li et al. (Reference Li, Li, Yang and Beauchemin2012), Boucher et al. (Reference Boucher, Calsamiglia, Parsons, Stein, Stern, Erickson, Utterback and Schwab2009a) and O’Mara et al. (Reference O’Mara, Murphy and Rath1997). The increase in the EAA portion within DDGS-r resulted from a slightly higher degradability of NEAAs relative to EAAs. This increase was more obvious for lysine, which probably had a higher resistance to ruminal degradation because of heat exposure. Contrary to this, O’Mara et al. (Reference O’Mara, Murphy and Rath1997) reported lysine as one of the more degradable AAs of DDGS in the rumen. Concentrations of isoleucine, leucine and methionine also increased in the DDGS-r, which is in concordance with the tendencies reported by O’Mara et al. (Reference O’Mara, Murphy and Rath1997), reflecting their higher resistance to ruminal degradation. Boucher et al. (Reference Boucher, Calsamiglia, Parsons, Stein, Stern, Erickson, Utterback and Schwab2009a) also found some resistance of methionine to ruminal degradation when compared with other AAs. However, the increase in lysine, methionine, isoleucine and leucine concentrations in DDGS-r compared with DDGS-s may not be necessarily advantageous regarding EAA supply to the animal. Boucher et al. (Reference Boucher, Calsamiglia, Parsons, Stein, Stern, Erickson, Utterback and Schwab2009a) found a lower ID of lysine in DDGS compared with other AAs and other feedstuff. In addition, O’Mara et al. (Reference O’Mara, Murphy and Rath1997) found lower intestinal disappearance of lysine than total AAs in DDGS. This suggests that heat treatment would positively increment the EAA content of UDP by reducing its degradability in the rumen but may simultaneously reduce its ID.
According to Boucher et al. (Reference Boucher, Calsamiglia, Parsons, Stein, Stern, Erickson, Utterback and Schwab2009a), one reason for discrepancies in the AA profile between the intact feed and UDP could be the microbial contamination of DDGS during ruminal incubation. Diaminopimelic acid (DAPA) is a component of bacterial cell walls, and is therefore an indirect indicator of microbial protein (Rubio, Reference Rubio2003) that has been used for the measurement of bacterial contamination in biological materials (Puchala et al., Reference Puchala, Piór and Kulasek1992). We have used performic acid oxidation preceding hydrolysis of proteins for AA analysis. Although oxidative hydrolysis was proved to not interfere in the determination of DAPA (Csapó et al., Reference Csapó, Csapó-Kiss, Csordás, Martin, Folestad, Tivesten and Némethy1995), we observed that the appearance of DAPA peaks on the chromatogram was not sharp and well defined. We hypothesized that during oxidative hydrolysis, new substances originated that co-eluted with DAPA, giving no reliable measurements, and this may be a particular problem for this group of feedstuff. Consequently, DAPA was not used for the correction of microbial AA contamination in the present study. Erasmus et al. (Reference Erasmus, Botha and Cruywagen1994) studied 12 different feedstuff after 16 h of ruminal incubation and reported for 11 feeds that 0.9% to 5.9% of AAs came from bacterial contamination. Only for fish meal they reported a contamination of 8.6% and these values were even lower than those reported by Crooker et al. (Reference Crooker, Clark, Shanks and Fahey1987) (8% to 26.8%) in a similar study. Erasmus et al. (Reference Erasmus, Botha and Cruywagen1994) attributed this relative low microbial contamination of the feed residues to the washing procedure (10 min with washing machine). In our experiment, bags were first intensively rinsed in cold tap water to remove the excess rumen content until the water came clear and then were additionally washed in a washing machine for a longer period (15 min). Steingass et al. (Reference Steingass, Kneer, Wischer and Rodehutscord2013), using a similar approach as in the present study, found no need for the correction of microbial AA with DAPA after 16 h of ruminal incubation of the rapeseed meals because of low microbial contamination, which was estimated to be 3.4%±0.3% of total N. Thus, we assumed low microbial contamination in the DDGS residues, and data were interpreted considering that this aspect did not considerably affect the AA profile of DDGS-r.
Despite the high variation of rumen degradation of AA, it reflected the overall pattern of CP degradation. Similar tendencies were found by Mjoun et al. (Reference Mjoun, Kalscheur, Hippen and Shingoethe2010), Kleinschmit et al. (Reference Kleinschmit, Anderson, Schingoethe, Kalscheur and Hippen2007) and Li et al. (Reference Li, Li, Yang and Beauchemin2012). However, lysine and methionine degradation values of the majority of the samples were significantly different from those of CP degradation (Table 2). Considering the variation around the regression line, deviation of the slopes from 1 and the low RMSE, linear regressions between degradation of CP, and degradation of lysine and methionine show that the rumen degradation of these AAs can be reliably predicted from CP rumen degradation. This approach also allows for the reliable prediction of degradation of the other AAs from CP degradation. The results show that CP degradation can be used to predict the AA content of UDP of DDGS. Similarly, Steingass et al. (Reference Steingass, Kneer, Wischer and Rodehutscord2013) published specific regression equations for the rapeseed meal.
The UDP after 16 h of ruminal incubation tended to be higher for corn-DDGS (49.3%), followed by wheat-DDGS (35.5%), blend-DDGS (19.2%) and barley-DDGS (13.5%). One blend-DDGS showed a very low UDP content (5.8%), which is not consistent with general findings for DDGS. Low UDP can be partly explained by the relative high A-fraction (soluble protein) but mainly by the very fast degradation rate of the potentially degradable fraction (Westreicher-Kristen et al., Reference Westreicher-Kristen, Steingass and Rodehutscord2012). Moreover, interpretations about DDGS types should be made with caution, because different processing methods could influence the estimated UDP values. In addition, the number of samples per DDGS is not sufficient to make comparisons between DDGS types. Moreover, as factories did not deliver information on the processing method used, it is not possible to state which factor was most likely to affect the variation of parameters. Therefore, further studies should evaluate the effect of potential factors and processing steps on the feed value of DDGS.
As it can be assumed that the AA composition of milk protein is indicative of the ideal AA balance for cows, the MPS may be an indicator of the protein quality of feedstuff (Schingoethe, Reference Schingoethe1996). Owing to its low lysine content, the MPS of DDGS is generally low but varied considerably owing to the variability of lysine and isoleucine. The MPS of DDGS in the present study was higher than published before (Schingoethe, Reference Schingoethe1996; Kleinschmit et al., Reference Kleinschmit, Anderson, Schingoethe, Kalscheur and Hippen2007), which may be related to the different types of DDGS used in different studies. Lysine and isoleucine, like in our study, were also reported as the first and second limiting EAAs, respectively, in DDGS-s and DDGS-r (Kleinschmit et al., Reference Kleinschmit, Anderson, Schingoethe, Kalscheur and Hippen2007).
In vitro PPS of CP
The ID of CP is an important factor that determines the amount of CP and AAs available for the animal. The values for PPS of DDGS-r and IADP found in the present study are lower and more variable than those reported by Kleinschmit et al. (Reference Kleinschmit, Anderson, Schingoethe, Kalscheur and Hippen2007). Carvalho et al. (Reference Carvalho, Melo, Pereira, Rodrigues, Cabrita and Fonseca2005) and Mjoun et al. (Reference Mjoun, Kalscheur, Hippen and Shingoethe2010) reported an in vitro digestibility of DDGS-r of 51% and 92%, respectively. These differences may be attributed to the different DDGS sources and to the in vitro procedure used. Processing and drying techniques were found to affect the intestinal CP digestibility of DDGS (Cao et al., Reference Cao, Anderson and Kalscheur2009) and were postulated to affect the CP degradability in the rumen (Kleinschmit et al., Reference Kleinschmit, Anderson, Schingoethe, Kalscheur and Hippen2007). Therefore, we hypothesized to find a lower PPS of DDGS-r with a higher in situ UDP. There was a positive relationship between in situ UDP and PPS of DDGS-r, but the determination coefficient was low (R 2=0.37, P=0.04). This suggests that PPS is not well predictable from UDP content, perhaps because of differences in the processing and drying methods between ethanol production plants. In addition, different substrates and their mixtures used in the plants should also be considered as contributing to the variability observed in the present data set.
As ADiN seems to be indigestible in the intestine (Lanzas et al., Reference Lanzas, Broderick and Fox2008), it was proposed as an indicator for CP digestibility. Although the content of ADiN was highly variable and could be considered high enough to have negative effects (3 to 16 g/kg DM), there was only a weak relationship between ADiN and PPS of DDGS-r (r=−0.51, P=0.08). The same relationship was found between ADiN and total indigestible CP (TiCP) of DDGS-r. Similarly, Nakamura et al. (Reference Nakamura, Klopfenstein and Britton1994) found a low relationship between ADiN and apparent digestibility of N (R 2=0.24) for eight feed proteins including corn-DDGS. Woods et al. (Reference Woods, Moloney, Calsamiglia and O’Mara2003) found a poor relationship between ADiN of different feedstuff and unavailable protein in the small intestine. Similarly, Kleinschmit et al. (Reference Kleinschmit, Anderson, Schingoethe, Kalscheur and Hippen2007) and Li et al. (Reference Li, Li, Yang and Beauchemin2012) reported that neutral detergent-insoluble CP did not reflect the unavailable CP of DDGS in the intestine. This suggests that ADiN is not a good indicator for unavailable CP in DDGS-r. This may be explained owing to the relative high degradation of ADiN in the rumen (Nakamura et al. Reference Nakamura, Klopfenstein and Britton1994; Kajikawa et al., Reference Kajikawa, Miyazawa, Yanase, Tanabe, Tsuchida, Mitsumoto, Kozato and Mitsumori2012) so that the amount of ADiN that reaches the duodenum is relatively low and does not have any relevance or negative effect in the intestinal digestion of ruminants. On the other hand, there was a moderate relationship between ADiN and PPS of DDGS-s (r=0.79, P=0.002). The latter suggest that ADiN of DDGS may be an indicator of indigestible CP for non-ruminants and confirms that microbes partially degrade ADiN in the rumen. The fact that TiCP was higher in DDGS-s than in DDGS-r may suggest that there is a CP fraction of DDGS that is degraded by microbes in the rumen but cannot be digested in the intestine. The higher variation of PPS obtained in the present study compared with those published could be owing to a great variability of the raw materials and their mixtures used for the ethanol production, because of differences in the drying processes among samples and because of differences in the techniques used to estimate the digestibility of UDP.
Although DDGS may be considered as a good source of UDP, the PPS values showed that ID of UDP may be low compared with soya bean meal and corn gluten meal (Maiga et al., Reference Maiga, Schingoethe and Henson1996; Kleinschmit et al., Reference Kleinschmit, Anderson, Schingoethe, Kalscheur and Hippen2007) but can be higher than the rapeseed meal (Steingass et al., Reference Steingass, Kneer, Wischer and Rodehutscord2013). The PPS of DDGS-s was higher than from DDGS-r, and they were low correlated with each other. Similar results were reported by Boucher et al. (Reference Boucher, Calsamiglia, Parsons, Stern, Ruiz Moreno, Vásquez-Añon and Schwab2009b) for DDGS. Our results suggest that the previous rumen incubation is always necessary for the determination of ID of UDP from DDGS and that it is not possible to estimate with sufficient accuracy the PPS of DDGS-r from the digestibility of CP in DDGS-s. The National Research Council (NRC, 2001) model assumes a UDP digestibility of 80% for DDGS and the UK Feeding System 90% (AFRC, 1993) for all feeds, whereas the German Protein System assumes a UDP ID of 85% for all feedstuff (Gesellschaft für Ernährungsphysiologie (GfE), 2001). Chrenková et al. (Reference Chrenková, Ceresnaková, Formelová, Poláciková, Mlyneková and Fl’ak2012) determined the ID of five wheat-DDGS, with the mobile bag procedure ranging from 79.6% to 92.2%. The French protein system uses a value of ID of UDP of 85% for wheat-DDGS (Sauvant et al., Reference Sauvant, Perez and Tran2004). These values are higher than the values estimated in the present study for wheat-DDGS (60.0% to 77.2%). As we determined the ID of UDP in vitro, these values should not be compared directly with absolute values of in vivo ID, but rather as relative values to evaluate the ID among DDGS. However, the ID of UDP from our two corn-DDGS (average 80.5%) match with the NRC (2001) value and are not far from the Dutch table value (88%; CVB, 2012). In addition, our wheat-DDGS samples had much lower percentage of UDP compared with Chrenková et al. (Reference Chrenková, Ceresnaková, Formelová, Poláciková, Mlyneková and Fl’ak2012) (29.7 to 62.7). Steingass et al. (Reference Steingass, Kneer, Wischer and Rodehutscord2013) studied the rapeseed meal and showed that the ID of UDP decreased with the decreasing percentage of UDP in the rapeseed meal. Although these comparisons should be interpreted with care, the in vitro data obtained in the current study give an indication that the contribution of UDP to the intestinal AA supply may be overestimated by the values implemented in some protein systems. The data also indicate a need for specific values of ID for each class of feedstuff, and in the case of DDGS a differentiation of ID values according to DDGS type. Similar overestimations were observed for the rapeseed meal when compared with the German protein system (Steingass et al., Reference Steingass, Kneer, Wischer and Rodehutscord2013).
The digestibility of individual AAs can vary widely with AAs and feeds (Mjoun et al., Reference Mjoun, Kalscheur, Hippen and Shingoethe2010; Li et al., Reference Li, Li, Yang and Beauchemin2012). Therefore, in further studies, when considering a high variability of DDGS types and protein values like the European DDGS described here, the aim should be to estimate the digestibility of each AA instead of the digestibility of UDP to better characterize the variation of UDP quality.
To conclude, the data delivered in this study confirmed that DDGS used in Europe are characterized by a wide range in protein values. The ruminal degradation of individual AAs could be predicted from the degradation of CP. Lysine was the first limiting EAA in DDGS. Therefore, including DDGS as a major protein source in rations for high-yielding dairy cows may not meet the requirement for lysine. The PPS of DDGS-r was lower compared with DDGS-s and constant values used in some protein evaluation systems. Therefore, an estimation of the intestinal UDP digestibility of DDGS should consider previous ruminal incubation. The PPS of DDGS-r was not related to in situ UDP or to chemical constituents; therefore, predictions are not reliable through this approach. More research is required and recommended to assess the digestibility of individual AAs from DDGS in the intestine. Validation of PPS of DDGS with in vivo data is also suggested.
Acknowledgements
This study was supported by the Ministerium für Wissenschaft, Forschung und Kunst Baden-Württemberg with a doctoral scholarship for Edwin Westreicher-Kristen, which is gratefully acknowledged. Furthermore, the authors thank Dr Christine Potthast for the recollection of the DDGS samples.