1. INTRODUCTION
Maritime navigation is a process that depends heavily and crucially on the navigator's experience and judgement, as there are no specific rules governing the optimum use of navigational systems and techniques apart from the general rules outlined in collision regulations (COLREGSFootnote 1) coupled with the traditional practices of seamanship. Currently, collision avoidance manoeuvres for local trafficFootnote 2 or obstacles are usually performed under the navigator's own reaction and judgement, even though there are numerous navigational advising equipments available on the bridge (e.g. Automatic Identification System (AIS) and automatic radar plotting aid (ARPA)). Nevertheless, navigators usually take the safety of the ship as the first priority while the other aspects (e.g. fuel saving and transverse distance) are mostly treated as secondary issues having a lower priority. This practice was acceptable for many decades but increasing sea-borne trading has greatly elevated marine traffic so that congestion is now a significant problem. Furthermore, and particularly in littoral, the average cruise speed of ships is increasing. As a notable number of accidents at sea are associated with human error; so close range collision avoidance methods have become an important subject in marine navigation.
The majority of the studies in this area are focussed on collision free manoeuvres and recently some investigations have been conducted on path planning. Traditionally path planning algorithms originate from:
• land-based robotic navigation e.g. rule-based expert systems or combinatorial motion planning,
• iterative non-deterministic optimisation algorithms from other areas e.g. dynamic programming or genetic algorithm.
However, the major difficulties in adopting such approaches were the incorporation of COLREGS and the practise of seamanship. Unlike land-based navigation, the rules for ship encounters are unique and specific to each encounter. In addition to the regulations, the dynamics of ships are also highly complex and depend upon many factors such as hull-form and speed, as well as environmental conditions. There are still no universally agreed solutions to incorporate such factors and up to now all reported studies have either disregarded the regulations, employed specific databases or used different safety domain geometries to emulate COLREGS; and have assumed a highly simplified version of the ship dynamic model.
Recently, a review article by Statheros et al. (Reference Statheros, Howells and McDonald-Maier2008) discussed the development of ship collision avoidance and categorised most of the published works over the past two decades. The purpose of this article is to expand the coverage of the Statheros work and not to overlap it. The following sections discuss selected publications that are deemed significant for the subject's development; however, the intent is not to recommend nor discredit any other published works, rather it is to construct a database to allow each method to be contrasted, such that advantages and disadvantages can be analysed impartially to assist in identifying common shortcomings among the reported studies.
1.1. Adopted terminologies
Several terminologies have been adopted. An approach is deemed to have optimisation only if it has certain features i.e. computing the shortest path, or has a minimum amount of manoeuvring etc. An approach is considered to have taken environmental conditions into account if the navigation path heading(s) has been checked with respect to the direction of wind and/or current flow in the vicinity such that the ship headings are coherent i.e. do not go against the direction of wind or current unnecessarily. A ship that is in direct control is referred as own-ship (OS), any other ships beside OS are referred to as target ships (TS) or obstacles. A semi-dynamic TS is a moving obstacle traversing uni-directionally without altering its heading, such that Σ∀tΔTS −θ=0, where TS −θ is the heading of the TS. A dynamic TS is a moving obstacle with change in heading, where Σ∀tΔTS −θ>1.
1.2. Organisation
This article has been structured into six sections based on the area of study. Section 2 reviews the initial studies on collision avoidance for ships. Section 3 reviews the development in collision risk assessment in close range encounters. Section 4 reviews the development of collision avoidance for ships, but is limited to studies that are only interested in avoiding a potential collision with no optimisation to the navigation path. Section 5 reviews studies that have been conducted in path planning with optimisation, and it is further categorised into subgroups according to the method of optimisation. Section 6 discusses the findings of this study with concluding remarks in Section 7.
2. START OF COLLISION AVOIDANCE FOR SHIPS
Qualitative studies on marine collision avoidance manoeuvres started in the decade after World War II largely due to the advancement of radar and increasing ship-borne commercial trading. The majority of such early studies were mainly focussed on the interpretation of the collision regulations and discussing their practicability and shortcomings, particularly the guidelines for close range encounters (e.g. Sharpey-Schafer Reference Sharpey-Schafer1955). In general, there were two areas of focus for study, namely:
• The behaviour of marine traffic as a whole,
• Optimal strategies for evasive manoeuvres in close range encounters.
Most studies were devoted to determining the position of a potential collision for two ships that were on a collision course. In the 1960s, voyage (or weather) planning was introduced; and there was increasing adoption of shore-based navigation advising systems (mainly for weather information). Collision avoidance manoeuvres were largely based on basic information extracted from radar with the decision being made by the officer on watch (OOW) and their interpretations of the situation, which could be rather unpredictable, especially in traffic involving three or more ships. Instrument-based collision avoidance manoeuvres were simply inconceivable because sophisticated radar systems were not readily available (Wepster Reference Wepster1969). At the same time, accidents involving ship collisions were becoming a significant issue, particularly in areas of heavy traffic. The Liverpool Underwriters Association reported in 1963, 21 collisions that resulted in total ship loss, a sharp increase from a five-year average of 13·8. Most of these accidents were deemed to be caused by human error, when the ships were operating at speed in congested waters.
In response to such issues, the Institutes of Navigation in West Germany, France and the United Kingdom proposed several ideas to improve safety in congested areas including the idea of one-way traffic schemes such as those implemented so successfully on land. These ideas were positively received by the International Maritime Organization (IMO) (then the Inter-Governmental Maritime Consultative Organization IMCO) and subsequently the traffic separation scheme in the Dover Strait was mandated in June 1967. A significant fall was observed in the number of collisions between ships on an opposing heading. Similar schemes were later implemented by other governments across the world especially in areas of heavy traffic (IMO 2005) e.g. Malacca Strait.
However, such traffic management schemes only partly solved the issue as crossing traffic still posed a threat to the regulated traffic flow; furthermore it is impractical to impose one way traffic schemes over large areas. Traffic management schemes are therefore only practical where there is uni- or bi-directional traffic. Phillips (Reference Phillips1975) proposed a conceptual marine traffic system based on land traffic regulations; however, such a system was deemed impractical because traffic lights at sea are infeasible.
3. COLLISION RISK ASSESSMENT
Several concepts have been reported in assessing the risk of collision for ships. The initial concepts were based on the closest point of approach (CPA) or the shortest instantaneous distance between the ships involved; parameters investigated included the time of closest point of approach (TCPA) or distance to closest point of approach (DCPA). Most recent path planning algorithms adopt a safety domain around each obstacle that serves to indicate the risk of collision.
Fujii & Tanaka (Reference Fujii and Tanaka1971) were the first to present the concept of the ship domain, which represents one of the important concepts in marine traffic modelling that has since become the basis for other similar approaches to assess collision risk; and it remains an important element in marine navigation to this day. The proposed ship domain is of an ellipsoidal shape with OS at the centre, formulated from the results of a study on marine traffic in Japanese channels.
Goodwin (Reference Goodwin1975) published a statistical study on a ship's surrounding spatial requirement in the open sea, and proposed a ship domain that was discretely divided into three zones; the domain is defined as the area around a ship that the navigator would like to keep free of other ships or objects. The three zones correspond to give-way, stand-on and overtaking depending on the direction of approach, and this could be interpreted as discretised regions of the critical CPA.
The shape of the proposed domain was largely due to COLREGS as one would expect more ships near to the port bow rather than the starboard bow since in head-on encounters it should be a port-to-port passing. Navigators would also tolerate closer distances astern because they are not directly responsible for the astern traffic. The radius of domain is dependent on many independent variables according to the author, such as the type of area, traffic density, ship length, maximum speed etc. This is also one of the important concepts in collision risk assessment.
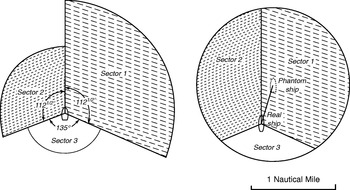
Davis et al. (Reference Davis, Dove and Stockel1980) reported a study in marine traffic simulationFootnote 3, adopted and modified Goodwin's (1975) discrete ship domain boundary with an eccentric circle in such a way that the weighting of different areas around the ship are still maintained whilst having a continuous external boundary (see Figure 1). The ‘smoothed’ ship domain was claimed to be easier to handle in terms of mathematical modelling as well as eliminating the discrete discontinuities in the domain boundary, which could produce unrealistic behaviour of marine traffic; besides, the authors also reported that the ship domain needed to be enlarged significantly for realistic traffic behaviour. The enlarged region, which the authors referred to as ‘arena’ served as the ‘action’ domain, where upon infringement, the navigator would be required to consider the necessity of an evasive manoeuvre. In the same period, several other researchers (e.g. Holmes Reference Holmes1980) also reported studies in marine traffic simulation using Goodwin's (Reference Goodwin1975) ship domain concept.
Comparison between the proposed ship domains of Goodwin (Reference Goodwin1975, left) and Davis et al. (Reference Davis, Dove and Stockel1980, right), the discontinuous boundary on Goodwin's (1975) was eliminated to lighten the computational complexity by offsetting the position of the ship.

Coldwell (Reference Coldwell1983) described a scenario-based ship domain concept for navigating in restricted waters, where the ship domain's shape for head-on encounter had the stern part completely removed as the author argued that the aft section is not vital during such an encounter; whereas for an overtaking encounter, it was a symmetric oval similar to Fujii & Tanaka's (1971) model. Nevertheless, practical use of such a concept is yet to be seen.
In the same year, Colley et al. (Reference Colley, Curtis and Stockel1983) reported another type of ship domain (or modified Davis et al. (Reference Davis, Dove and Stockel1980) model) to become the range-to-domain over range-rate (RDRR) model. The fundamental idea of RDRR was adopted from air traffic control theory. The principle of the method is based on the ratio of the distance from the TS to reach the OS domain (rate-of-change-of-range or range-to-domain) over the rate of change of relative velocity (range rate); by comparing this value against a pre-defined critical value, the model could then determine the appropriate position or time for enacting a collision avoidance manoeuvre. This concept has been frequently adopted among other researchers in the field such as Curtis et al. (Reference Curtis, Goodwin and Konyn1987), who modified the RDRR to automatically detect a potential encounter and determine the type of encounter; it used the RDRR model with additional distance and time terms. These additional terms were added to determine various encounter types especially for overtaking and head-on encounters, where the authors claimed that the original RDRR would result in unrealistic behaviour. However, and similar to Coldwell's (Reference Coldwell1983) ship domain, such concepts have yet to be adopted by other researchers.
Zhu et al. (Reference Zhu, Xu and Lin2001) reported an alternative method of determining the subjectiveFootnote 4 ship domains using back propagation neural networks (BPNN), which eliminated the usually complicated mathematical modelling of the environment. The BPNN was structured to take in non-dimensional variables such as beam over length ratio, normalised distance, normalised visible distance as well as block coefficient. However, it remained a partially completed work as training data was limited only to some specific types of ship. Szlapcynski (Reference Szlapcynski2006b) published a conceptual study on scaling factors on the domain's radius for the various ship domains mentioned earlier and this study was based mainly upon modification of the DCPA and TCPA.
4. STUDIES IN COLLISION AVOIDANCE
The ‘first’ assessment of collision avoidance was carried out by Calvert (Reference Calvert1960), who proposed the concept of starboard manoeuvres during close-quarter such that the sight-lineFootnote 5 always rotates counter-clockwise during manoeuvres; his method was later explained and justified mathematically by Hollingdale (Reference Hollingdale1961). Since then, there have been numerous discussions and studies devoted to analysing similar collision avoidance manoeuvres (mostly considering two ships on collision course) and debating ‘suitable’ evasive manoeuvres (e.g. Calvert Reference Calvert1961, Morrel Reference Morrel1961, Wylie Reference Wylie1962).
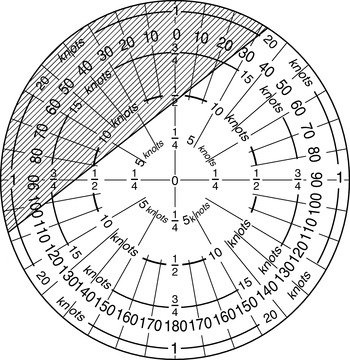
For collision-risk indication, an anti-collision indicator has been developed by Mitrofanov (Reference Mitrofanov1968), which was an electro-mechanical analogue computer installed onboard the shipFootnote 6 that computed evasive action if it existed; it was based upon (manually input) data from radar and the evasive manoeuvres were determined with a mathematical model that related speed and course for the two closing ships. The suggested manoeuvres were presented as non-shaded regions on a display (see Figure 2). The navigator however, still had to make a decision on the most appropriate evasive manoeuvre manually.
Mitrofanov's (Reference Mitrofanov1968) segment of safe heading, the non-shaded region represents the area for suggested evasive manoeuvre.

The use of a manoeuvre diagram was published by Jones (Reference Jones1974). The diagram serves as an illustration on the bridge to highlight the region of collision risk based on geometrical relationships and likelihood of a particular manoeuvre expected by TSs; its purpose was to show the regions of high collision risk, which were represented by regions overlapping on other ships' diagram. However, similar to Mitrofanov (Reference Mitrofanov1968) this technique only highlights and advises the risk as a result from a particular manoeuvre without further recommendation on the evasive manoeuvre.
Merz & Karmakar (Reference Merz and Karmakar1976) published a study of a two-ship encounter in open sea. The collision avoidance manoeuvre was modelled with a trigonometric model and solved analytically for maximum miss distanceFootnote 7 between the two ships using the radar data (i.e. relative position and velocity, turning capabilities of the ship); while other properties such as the ship's dynamics or external environmental influences were excluded in the computation.
Up to this point, most publications were either conceptual evaluation of the marine navigation or statistical studies of ship traffic. In the late 1970s and early 1980s, most navigation bridge components were mainly devoted to illustrative or visualisation purposes; the marine community was still unaware of the potential of the computer to improve ship operation and the idea of manipulating radar signals with computers to improve navigation was greeted with subdued enthusiasm partly due to the limitations in size and reliability of their electronic components. The attitudes of the navigators were that knowledge of practical seamanship was far more important than advice from a gadget that was based strictly on pure technical knowledge (Harry Benford Reference Harry and William1993).
Cannell (Reference Cannell1981) described an attempt to solve the two-ships collision avoidance problem by modelling it as a one stage co-operative game, with the objective of maximising safety (by diverting the collision-course). The characterisation of the ‘safeness’ of each action was based on a matrix of possible (scenario-based) actions for the ship, the algorithm searched for actions that were non-conflicting; conflicting action was defined as a combination of individual actions that result in a zero net rotation of the LOS. COLREGS were also incorporated by characterising the encounter scenario such that COLREGS incompatible manoeuvres were specified in the action matrix (i.e. forcing the TS to select the opposite direction of OS chosen manoeuvre under a crossing encounter, such that relative heading remains unchanged). Similar to previous attempts, it was still a rather unrealistic approach to the problem as it only dealt with two potentially colliding ships.
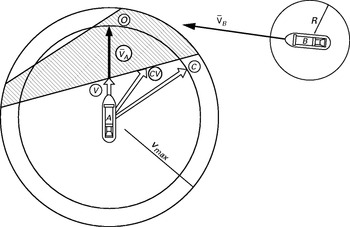
Degré & Lefèvre (Reference Degré and Lefèvre1981) proposed a collision avoidance system based on the room-to-manoeuvre principle, which could be employed either as a navigation advisory tool or a decision maker. The room-to-manoeuvre principle was based upon a geometrical model, generating the danger zones with velocity vectors and closest passing distance. The ‘room’ that was deemed ‘safe for manoeuvre’ was indicated as the region outside the shaded area, where collision risk was unlikely to exist (see Figure 3). The authors also claimed that the navigation process could be automated with the device; however, COLREGS were not incorporated into the system and it only represents a collision avoidance system where no optimisation of the navigation path is considered.
Degré & Lefèvre's (Reference Degré and Lefèvre1981) room-to-manoeuvre principle for a two ship encounter. OS A with velocity vector  A, TS B with B and closest safe passing distance R. V max is the maximum speed of OS, O is the extremity of vector A, if it is located inside the shaded region would mean A would pass B below threshold R therefore in risk of collision. C represents the manoeuvre without change of speed, V is the manoeuvre with speed change but not course alteration; whereas CV is the manoeuvre with both speed and course alteration.

The Colley et al. (Reference Colley, Curtis and Stockel1983) ship domain modelling has been adopted by Dove et al. (Reference Dove, Burns and Stockel1986) to compute automated collision avoidance of an autonomous guidance system. The RDRR model gives the time when the give-way vessel must alter course to avoid a collision. Colley & Stockel (Reference Colley and Stockel1984) also employed the RDRR method to simulate the marine traffic flow and compute collision avoidance manoeuvres. The collision avoidance was initiated upon domain infringement and depended upon the type of encounter; starboard manoeuvre would be executed every subsequent iteration until the domain was no longer infringed, the original course would then be resumed. Multi-ship encounter was subdivided into a series of two-ship encounters and would be dealt with in sequence according to the level of each obstacle's threat (the authors used the TCPA, lower TCPA indicates higher threat). This work only dealt with the collision problem with one obstacle at one instance without considering the existence of other obstacles of lower collision risk and without optimisation of the navigation path.
Fuzzy set theory was adopted by James (Reference James1986) to make collision avoidance decisions; the avoidance actions were categorised based on distance and passing side. The reported work aimed solely to solve the collision-free and COLREGS conforming path in open sea for two colliding ships without optimisation or compatibility check with respect to the environmental conditions. Coenen et al. (Reference Coenen, Smeaton and Bole1989) reported a navigation advising system based on knowledge based collision avoidance with a database generated from rules of COLREGS 1972, experts' interpretations and standard practise. The system was structured on heuristic sequences, and multiple TS encounters were treated similarly to previous attempts, by subdividing the problem into multiple two-ship encounters with different priorities that only solves the highest prioritised obstacle at one instance. The proposed system generates output (in the form of suggested actions) from the databases as illustrative advice such as:
• type of course alteration,
• magnitude of alteration,
• time of alteration,
• time to resume original course.
All of the suggested actions were returned as descriptive advice to the navigator e.g. Stand on or Alter course to Starboard. It is apparent that such a system was only capable of advising on collision-free navigation paths but not the optimum path. Furthermore, and similar to previous attempts, the algorithm structure of treating a single obstacle in sequence may lead to an unfavourable situation at a later stage.
Smeaton & Coenen (Reference Smeaton and Coenen1990) also used a fuzzy logic-based algorithm with rules mainly from COLREGS and the collision avoidance manoeuvre was computed by two descriptors:
• Status descriptors that determine the type & encounter,
• Risk descriptors that generate a risk status based on a function of the TS's CPA, TCPA and range.
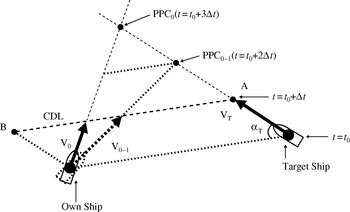
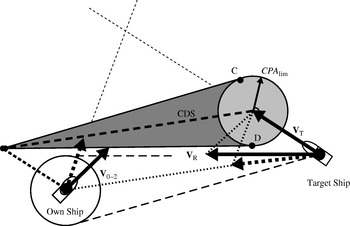
The authors used the Davis et al. (Reference Davis, Dove and Stockel1980) arena to determine the time to initiate a manoeuvre, and the direction depends on the outcome from the descriptor (of the most dangerous target). The collision avoidance manoeuvre is computed using a generate and test routine, testing all course alterations at 10 degree intervals at a specific time based on a rule-based algorithm structured in a similar manner to James's (Reference James1986) work. Similar to Coenen et al.'s (Reference Coenen, Smeaton and Bole1989) framework, it solves the multi-ship encounter by reducing multi-TS problems to a series of two ship problems and addressing them in series following the order of decreasing collision risk. (Pedersen et al. Reference Pedersen, Inoue and Tsugane2002a, Pedersen et al. Reference Pedersen, Inoue and Tsugane2002b, Pedersen et al. Reference Petersen, Inoue and Tsugane2003) reported another variation of anti-collision indicator, constructed from velocity vectors of both OS and TS. It generates a line (collision danger line (CDL)) and an area (collision danger sector (CDS)) that represent different levels of collision risk as shown in Figure 4. Any manoeuvre that has the tip of the OS velocity vector within the CDS is a likely collision-bound manoeuvre and the navigator is expected to manoeuvre (manually) according to the position of the tip of the OS velocity vector, preferably to keep it outside such areas. Referring to Figure 5, if the tip of the vector is located on the edge of the CDS, OS will pass with a distance equal to the set CPA limit either ahead or astern of the target. However, such a system offers only visualisation of collision risk and no advice in terms of an optimal manoeuvre with respect to the TS. Furthermore, it makes no attempt to incorporate COLREGS and might ‘encourage’ the navigator to either move parallel or behind the TS due to its presentation of collision risk. From observation of the published figures, the display would get somewhat messy or confusing when traffic was heavy, as too many geometries (cones) are displayed to the navigator.
Construction of CDL. αT=relative bearing of TS, t 0=reference time. PPC=potential point of collision. Any manoeuvre that has the OS velocity vector on the CDL is a collision bound manoeuvre. Taken from Pedersen et al. (2003).

Wilson et al. (Reference Wilson, Harris and Hong2003) adopted the proportional navigation method from missile guidance systems to compute the evasive manoeuvre for a surface ship. The method worked on the principle that encouraged mis-aligning the relative velocity and LOS by an acceleration command on OS once a collision condition was satisfied. The collision conditions used by the authors were:
• Range between ships warning distance (similar idea to the circular ship domain),
• Direction of velocity of TS to OS aligned with its LOS,
• Turning rate of relative velocity between two ships is proportional to the rotational rate of LOS.
In essence, such a method is over-idealised with many constraints ignored (i.e. COLREGS) and it adopted some rather impractical assumptions (i.e. solely mis-aligning the velocity vectors to accomplish collision avoidance manoeuvres).
Cone-shaped collision danger region (Collision danger sector (CDS)) indicates the region which the tip of the OS velocity vector must avoid in order to avoid risk of collision. It was constructed based on minimum passing distance (CPAlim) around the CDL. A change of velocity vector to V 0−2 would change the relative vector (V R) to pass tangential to the OS CPA limit circle, hence clearing the risk of collision. Taken from Pedersen et al. (2003).

5. PATH PLANNING
Ship path planning can be categorised into two general groups, namely the deterministic and the heuristic approach. The deterministic approachFootnote 8 follows a set of rigorously defined steps in order to determine the solution; whereas the heuristic approachFootnote 9 only searches inside a subspace of the search space for an ‘acceptable’ solution rather than the best solution that satisfies the design requirements. Hence the iteration time for a heuristic algorithm is generally much shorter than a deterministic algorithm.
5.1. Deterministic approaches
Iijima & Hagiwara (Reference Iijima and Hagiwara1991) developed an autonomous collision avoidance manoeuvre control system using a knowledge-based expert system. It was designed to be capable of executing a collision avoidance manoeuvre autonomously, including judging the collision risk, planning decision and manoeuvre control. The selection and planning of a collision-free path is determined by breadth-first search; evaluations at each branch were based on successive approximated criteria such as:
• Collision danger (by using circular ship domain),
• Shortest track,
• Least rudder angle,
• COLREGS conformity (from knowledge-based rules).
The collision avoidance path was evaluated at approximately 10 second intervals, handling the targets in order of priority and assuming TS maintains on the detected bearing. Similar to most reported methods, the system was designed to function as an anti-collision navigation tool without consideration of the environmental conditions.
Churkin & Zhukov (Reference Churkin and Zhukov1998) reported an attempt to solve the mathematical model of evasive manoeuvre employing both continuous and discrete methods. The continuous method was based on linear programming, aiming to minimise the cost function of the rate of change of yaw; whereas the discrete method determined the solution by discretising the course and evaluated the path optimality at each vertex using the branch-and-bound method. The continuous method might be too computationally expensive and not feasible for multiple ship encounters in comparison with the discrete method as it involves some complex mathematical models to describe the scenario. Nevertheless, both approaches were without consideration of influences due to environmental conditions.
Miele et al. (Reference Miele, Wang, Chao and Dabney1999) formulated the collision avoidance manoeuvres as Chebyshev problems of optimal control and solved via the ‘sequential gradient restoration algorithm’, maximising the minimum time of the distance between two identical ships with respect to state and control history. The authors studied two cases, namely with and without cooperation between two converging ships; manoeuvring without cooperation was defined as only the OS manoeuvring while the other stays-on; whereas in the case with cooperation, the TS simply traced the mirror image of the manoeuvring ship with respect to the midpoint of the initial distance between the ships. The reported work solely solved for minimum time of the distance between two identical and colliding ships, which represents an over-simplified view of true marine navigation.
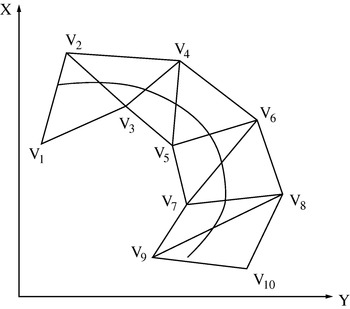
A recursive algorithm for autonomous ship collision-free, trajectory navigation and control system has been reported by Hong et al. (Reference Hong, Harris and Wilson1999). The collision avoidance algorithm was based on analytical geometry and convex set theory, where the heading command sequence was a set of recursively generated waypoints, located within a small neighbourhood of current OS positions, which lie within a bounded obstacle-free region.Footnote 10 These were generated using convex set theory by decomposing the obstacle-free regions into various triangular regions, as shown in Figure 6. In general, it represents a similar approach to planning with a ‘voronoi diagram’, where the mean distance in free space is used as the solution for collision-free navigation and hence may not be practical for actual navigation as maintaining mean distance between obstacles is not something the navigator does in practice.
Triangle decomposition of collision-free regions.

(Hwang et al. Reference Hwang, Yang and Chiang2001, Hwang Reference Hwang2002) employed fuzzy set theory to assess risk of collision as well as determining the collision avoidance manoeuvres. The proposed system consists of five modules, all operated using fuzzy set theory, and evaluations are based on the degree of nearness. The algorithm adopted was developed to satisfy the spatial requirement, and the action (or solution) space was established using a circular ship domain. Similar to all knowledge-based systems previously proposed, it only advised on collision-free manoeuvres by treating each TS in stages, and hence the final output might not be the optimum. In another publication by Lee & Rhee (Reference Lee and Rhee2001), the authors used a fuzzy reasoning method (based on TCPA and DCPA) to determine the collision risk, which then activates the collision avoidance module. An expert system was used to construct the action space based on COLREGS; a search algorithm would search the action space for feasible safe actions before employing the A* search algorithm to determine the feasible safe actions of minimum costFootnote 11. It still has limitations as the environmental conditions were disregarded and the authors assumed constant OS speed, which in practice, is fairly unrealistic.
Chang et al. (Reference Chang, Jan and Parberry2003) reported an alternative model to compute the collision free path on a raster chart using Lee's (or maze-routing) algorithm. Discretised circular ship domainsFootnote 12 were used to construct the obstacle space, where the TS domain and OS were marched forward according to the magnitude of their velocity vectors. If the cell which OS presently occupies is marked (or infringed) by another obstacle's domain, the cell would be marked as a forbidden (or impassable) zone such that only one ship is allowed to be present in one cell at any given time. A maze-routing algorithm would then be applied to determine the shortest collision-free navigation path within the solution space, but without considering COLREGS or environmental conditions.
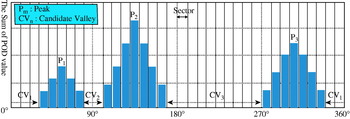
Lee & Kim (Reference Lee and Kim2004) presented a collision avoidance system for an autonomous ship based on a knowledge-based system using COLREGS. A polar histogramFootnote 13, representing the risk of collision was computed around OS, any valley below a certain threshold would become the candidate valley, as shown in Figure 7. The system identified and selected the candidate sectors that satisfied the optimality and safety criteria as candidate sectors, these were evaluated based on fuzzy relational product. These candidates were then checked for COLREGS compliance, based on an action table. Similar to previously reported knowledge-based systems, it only assesses the traffic configuration for a single TS at a time and hence the final navigation path is unlikely to be optimal.
Polar histogram of sectors around the ship representing the polar obstacle density (Lee & Kim Reference Lee and Kim2004).

Benjamin & Curcio (Reference Benjamin and Curcio2004) reported a navigation system for an autonomous ship using interval programming, which is capable of returning a collision-free COLREGS conforming path. It is constructed based on a set of rules describing the environment, comparing the external conditions with the predefined rules and returning the suitable ‘action’. While the authors have not fully explained the construction of the algorithm, it is thought that a comprehensive database must be required in order to fully handle all possible scenarios. Furthermore, it only computes a COLREGS conforming path without optimisation nor consideration of the environmental conditions.
Liu & Shi (Reference Liu and Shi2005) reported a collision avoidance method constructed with fuzzy set theory and a neural network. The overall structure was based on a three-subnet neural network with specific subnets monitoring different aspects as follows:
• encounter type (based on DCPA, course and distance) and output collision avoidance action (i.e. starboard, port or stand-on manoeuvres),
• speed ratio (based on fuzzy set theory, dimensional ratio between OS and TS, and output ‘fuzzified’ terms (i.e. small, equal or large)),
• alteration action (from the inferring subnet), and output ‘fuzzified’ terms (magnitude and duration).
The reported work generated only an evasive action for a specific encounter and did not analyse the traffic beyond the TS with the highest collision risk, therefore the path it generated was solely the best turn to avoid collision with the TS with the highest risk of collision. This makes it rather similar to James's (Reference James1986) attempt, that solved only collision-free and COLREGS conforming path incrementally without optimisation of any sort.
Szlapcynski (Reference Szlapcynski2006a) reported a modified version of the Chang et al. (Reference Chang, Jan and Parberry2003) maze-routing method, with additional turn penalties, time-dependent forbidden zone and speed reduction ability. Turn penalties were modelled by increasing the arrival time whenever a turn was initiated; forbidden zone was given a time parameter such that it only activated at a certain window of time when TS was nearby, such that computation of navigation path in a narrow passage or channel for OS would not be affected. Speed reduction ability of OS was also added to the algorithm whenever manoeuvring alone could not produce a satisfactory outcome. It modelled the speed reduction as a linear function of ‘distance to the forbidden zone’ and rounded to the nearest feasible engine speed. The author used a binary search algorithm to determine the necessary speed reduction such that only the minimum speed reduction is necessary to avoid collision. The reported work appeared promising in terms of the number of variables it could handle; however it still lacked optimisation with respect to the environmental conditions that had been left out by previous researchers and is only capable of handling OS speed reduction.
5.2. Heuristic approaches
Smierzchalski (Reference Smierzchalski1999) documented a method of ship trajectory planning using an evolutionary algorithm. Alteration of the OS speed (only discretely for a number of specific values) was made possible by using gene mutations at particular sections of the navigation path. The solution space was first established with polygon-shaped domains, then feasible navigation paths (initial solutions) were randomly populated before the algorithm searched for the optimum configuration based on cost functions of spatial, time and trajectory's smoothnessFootnote 14 requirements. COLREGS recommended manoeuvres were modelled with the shape of the ship domain, which has a preferential dimension on a certain side depending on the encounter type. The method was later adopted as part of an intelligent ship steering system that combines ship course guidance in a ship simulator model at Gdynia Maritime University (Smierzchalski & Lebkowski Reference Smierzchalski and Andrzej2006). Nevertheless, the reported method was still without consideration of influences due to environmental conditions.
Genetic algorithm was employed again by Ito et al. (Reference Ito, Zhang and Yoshida1999) to compute the collision avoidance navigation path. Similar to previous applications of the technique, the solution space was first defined using ship domainFootnote 15 as the danger zone, and feasible passing points were randomly generated in the solution space before the generic algorithm was employed to search for optimal configurations of passing points. The cost functions used for determining the optimality were:
• Danger level – the probability of getting into danger zone,
• Distance – sum of distance between passing points,
• Straightness – sum of cosine of course direction,
• Energy loss – sum of kinetic energy at the sampling time.
When compared with the Smierzchalski (Reference Smierzchalski1999) method, this work represents a rather basic implementation of genetic algorithm even without consideration of COLREGS. The authors also indicated that it was still under-developed but no follow-up publication could be located. Zeng (Reference Zeng2003) also reported another attempt to compute the safe navigation path in open sea with genetic algorithm; it was claimed to have considered environmental conditions in computation as part of the description of the trial solutions, but did not explicitly explain the approach. Nevertheless, the proposed method was meant to determine the collision-free path that satisfied a predefined distance from TS and COLREGS was not explicitly considered.
6. DISCUSSION OF PAST WORKS
6.1. Discussion on the related studies
While motion planning is widely studied in robotic navigation research, and according to (Gupta Reference Gupta1998) has been theoretically solved, the practical implementation remains problematic as tradeoffs between efficiency and completeness remains as one of the many persisting bottlenecks. In spite of this and surprisingly, it is still very much an open problem for surface ships as indicated by the lack of publicly available literature. This is perhaps due to historical and financial reasons, where the master is the one responsible for any mishaps as long as the ship is unmoored, as mandated by regulations; besides, the insurance agencies might have a lot of issues (i.e. responsibility and witness) if the ship is being navigated without a ‘real’ person on-board in hazardous situations (May Reference May1999).
Studies in marine collision avoidance date back to the late 1950s, when simple avoidance manoeuvres were generally sufficient as precise positioning and powerful workstations were still absent; however, publications in such studies have declined toward the end of the 1990s as traffic conditions worsened and for other reasons already discussed in Section 2.
In general, most of the published methods adopted a safety spatial domain either on OS or TS as a mean of collision risk assessment by checking any infiltration; the construction of the spatial domain could be based on formulas or databases. There were different proposed geometries of spatial domain depending on the encounter type, but most have a generic elliptical shape centring at the ship.
Studies in conflict resolution could be generalised in two categories:
• Collision avoidance,
• Path planning.
Studies in collision avoidance were common pre-1990s; they could be considered as situation-specific optimal turns to avoid collision and usually only considered two colliding ships or the ship with highest collision risk in multi-ship scenarios. Reported studies under this category usually only aimed to avoid the most immediate danger while ignoring other TS of lower collision risk. Studies in path planning were further categorised based on the approaches (i.e. deterministic and heuristic). Considering studies in path planning, deterministic approaches appeared around late 1990s when computers became popular, and were typically applied to low dimension state space (typically up to two dimensions) with idealised ship models and open sea, as such algorithms were inefficient for complex state space. Conflict resolution was commonly performed by discretising the state space as a graph or tree, which then could be solved rather straightforwardly with graph search algorithms.
Publication of studies in path planning with heuristic approaches appeared recently in the early 2000s, when the computational power of workstations surged significantly, and researchers started to include more realistic ship models and higher degrees of freedom. Such studies typically employed approximation algorithms (i.e. generic algorithm).
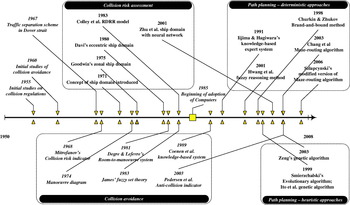
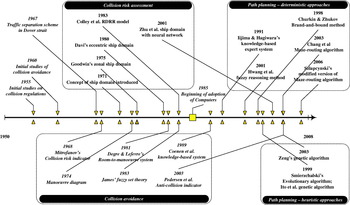
Figure 8 shows the selected studies of each category on a timeline; in general, it shows the early neglect in path planning for ships but this seems to have gained attention since early 1990s. Most of the pre-1980s studies dealt with collision risk assessment, shortest collision-free path or evasive manoeuvres between two colliding ships in open sea; whereas the majority of the post-1990s studies were dedicated to path planning, together with more computationally intense solutions due to the availability of personal workstations.
Timeline of development, only selected studies are indicated.
In addition to the development of ship collision avoidance and path planning, this review also underlines the limitations of the majority of the proposed algorithms, and is outlined as follows:
• No previous study has included environmental factors as well as mission profile related constraints into consideration when determining the navigation path,
• There are no studies that have reported path planning with true dynamic obstacles, all studies have only investigated semi-dynamic obstacles,
• Most of the dynamic models of the ships employed were usually highly idealised (i.e. limited or no change in speed, or momentum lost in turning).
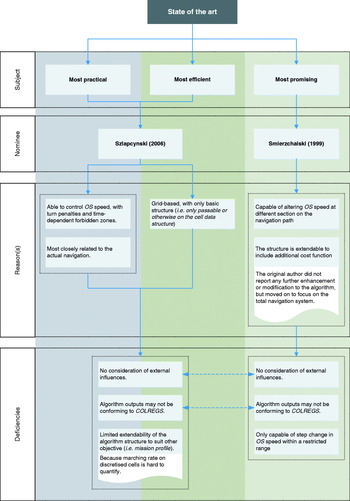
In conclusion, most of the reported studies are fairly limited in capability either due to unrealistic assumptions (i.e. open sea or only two ships encounter), disregarding the environmental conditions and/or ignoring COLREGS. However, some of the reported methods are quite capable such as Smierzchalski's (Reference Smierzchalski1999) and Szlapcynski's (Reference Szlapcynski2006a) handling both static (i.e. coastlines) and semi-dynamic obstacles. A more comprehensive comparison between these two methods has been made in Figure 9.
State of the art path planning algorithm for surface ship.

6.2. The necessity of path planning
Navigators always have to make quick decisions based on experience or instinct whenever a collision risk is detected. Upon detection of collision risk, there are a few typical procedures as listed below (Nathaniel Bowditch Reference Nathaniel1995):
• Collect relevant information,
• Assess the situation,
• Determine the ‘best’ manoeuvre in the interest of safety of both OS and the TS(s),
• Execute and monitor the manoeuvre, re-assess the situation if necessary.
In assessing and determining the best manoeuvre, the navigator usually relies on several factors, namely:
• The encounter situation,
• Traffic regulations in the region,
• Personal experience,
• Collected information from several sources (typically visual perception of the situation).
The soundness of the navigator's decision is also constrained by other factors, such as:
• Interpretation of the information,
• Unavailability of information, (i.e. blind spots),
• Disregarding other less dangerous obstacles (i.e. smaller or slower ships),
• Other unexpected events (i.e. delay in execution or previously undetected obstacles).
As such, it is clear that the navigator has to take in numerous data and simultaneously evaluate and assess the situation. The increase in traffic density and average cruise speed of ships has impeded the navigator in the sense that the decision has to be made in a reduced time, and hence the human perception and assessment of the situation is very likely to be affected. The necessity of a collision advising system has been investigated by (Jones Reference Jones1978) who concluded that such a system is indeed capable of improving the operational efficiency of navigation and enhancing situational awareness. However, the author also deduced that such devices (based on the radar system the author studied) may not improve the navigator's ability to use the information in order to achieve the optimum outcome from a complex situation. Such a conclusion also indicates the need of path planning tools that advise on optimal navigation path.
Modern bridge systems typically consist of some warning and prediction systems (May Reference May1999). The warning system's major role is to warn the navigator that a collision risk might exist and/or attention is required, once certain foreign objects are detected within the range specified by the navigator; whereas a prediction system attempts to predict future navigation based on present navigational conditions. Such systems are generally limited in scenario-based path planning functionality since most were designed to have only advisory rolesFootnote 16 in assisting the navigator, which predict the danger of a particular manoeuvre. As for devices with path or voyage planning, the aim was simply computing the navigation path to maximise the distance from obstacles. Some algorithms even disregarded the dynamic of the ship, whether such a navigation path is achievable when dynamic properties are included in practice is all down to the autopilot or secondary processes such as manual correction or override. As such, it would be an advantage to start planning with dynamic properties and environmental conditions from the start, not leaving it to the secondary processes to do the correction.
Furthermore, most modern numerical ocean models are able to provide casts and forecast of ocean variability, which typically consists of finite difference equations representing the momentum, heat and salt balance in a specific area. Such equations can be integrated with respect to time to determine the time evolution of fluid flow, based on the wind stresses and buoyancy. With these, the environmental conditions can be obtained, and such information could be used beneficially in path planning to determine the optimal path of minimum energy cost (Garau et al. Reference Garau, Alvarez and Oliver2005) with respect to the environmental conditions.
Finally, the recent interest in fully independent autonomous surface vehicles has created a need for an automatic navigation system that is capable of making practical decisions without human interaction. Such a system is essentially a fully evolved path planning system.
7. CONCLUSION
Close range collision avoidance for ships has a long history and still remains a complex issue. Numerous attempts have been reported in the past detailing different approaches to handling close range collision avoidance and the present trend is towards path planning where avoiding collision itself is not enough for the purpose. The common shortcoming among the majority of reported path planning algorithms is in disregarding the environmental conditions, which could be forecasted with reasonable accuracy by the availability of modern workstations and should be utilised by the path planning algorithm. In addition, the growing interest in autonomous vessels could also benefit from the development of path planning algorithms in which the navigation process could be fully automated without human intervention.
ACKNOWLEDGEMENTS
The authors would like to thank the ACCeSS group for the research studentship. The Altantic Center for the innovative design and control of small ships (ACCeSS) is an ONR-NNRNE programme with grant number N0014-03-0160, the group consists of universities and industry partners conducting small ship related researches.