


Introduction
A density profile of ice cores is one of the fundamental datasets in ice-core analysis. The densification process of polar ice cores has been intensely studied (Reference Herron and LangwayHerron and Langway, 1980; Reference WilkinsonWilkinson, 1988; Reference Langway, Shoji, Mitani and ClausenLangway and others, 1993). However, the bulk density of ice cores has generally been measured by the conventional volumetric method, whose resolution for the depth is at best several tens of mm. A detailed density profile will provide new and useful information to improve understanding of the densification process. Since the density of ice cores is closely related to the permeability (Reference Langway, Shoji, Mitani and ClausenLangway and others, 1993), density-profile data are necessary to estimate the age difference between polar ice and the air trapped in the bubbles (Reference Schwander and StaufferSchwander and Stauffer, 1984; Reference Schwander, Sowers, Barnola, Blunier, Fuchs and MalaizeSchwander and others, 1997).
Non-destructive high-resolution density measurements using gamma-ray attenuation have been carried out, and the correlation between the density and the electrical-conductivity measurement (EGM) profile is reported by Reference Gerland, Oerter, Kipfstuhl, Wilhelms, Miller and MinersGerland and others (1999). The timing of the density and the EGM suggests that the density variations in the ice cores reflect seasonal variations. Seasonal variations of the density have also been found for about 15 samples measured at intervals of about 10 m depth (Reference Tayuki, Hondoh and NaritaTayuki and others, 1997).
In the present paper, a detailed density profile of the Dome Fuji (Antarctica) shallow ice cores measured on more than 50 samples, corresponding to 25 m depth, is shown and analyzed by the discrete Fourier transform (DFT). The samples were chosen so that the depths could be almost continuous between the intervals 15-25, 55-65 and 95-100 m. X-ray radiographs taken on an imaging plate (IP) show the two-dimensional structure of the ice cores. The power spectra of the density variations were calculated for each sample.
Experimental Procedure
Thick sections of ice-core samples were prepared by band-sawing followed by microtome planing. The roughness of the surface of each sample was considered to be much less than 1% of the sample thickness. The samples were typically about 500 mm long, 30 mm thick and 40 mm high.
Figure 1 shows a schematic diagram of the X-ray transmission measurement system which is operated in a cold room at −20°C. In order to obtain highly sensitive density variations, the X-ray generator was operated at low voltage (30 kV). The width of the optical slit was limited to 0.05 mm for the divergence slit, 0.2 mm for the scattering slit and 0.2 mm for the receiving slit, as shown in Figure 1, to obtain high-resolution data for the depth. Under these optical-slit conditions, the intensities of transmitted X-rays were measured every 1mm. Accordingly, the spatial resolution of this method is 1 mm for the present measurements. The profile of transmitted X-ray intensities was converted to that of densities, using a calibration curve of transmitted intensities as a function of thickness of pure bulk ice. A transmitted X-ray intensity,/, is described as

where I0, Mice and teff are an incident X-ray intensity, the linear absorption coefficient of ice and the effective thickness of the sample, respectively. The density p is calculated according to the equation:

where ts is the thickness of the sample. Considering the statistical error of X-ray intensity measurement and fluctuations of the sample thickness along the sample axis, the error included in each data point of the density profile is estimated at about 1 %.
Schematic diagram of the X-ray transmission measurement system around the sample. The X-ray beam is transmitted through the sample, while the sample on the stage moves in the direction shown by an arrow. The transmitted X-ray intensity is counted every 1 mm using a scintillation counter, which provides a detailed density profile. Using an IP, a two-dimensional X-ray image can be obtained.
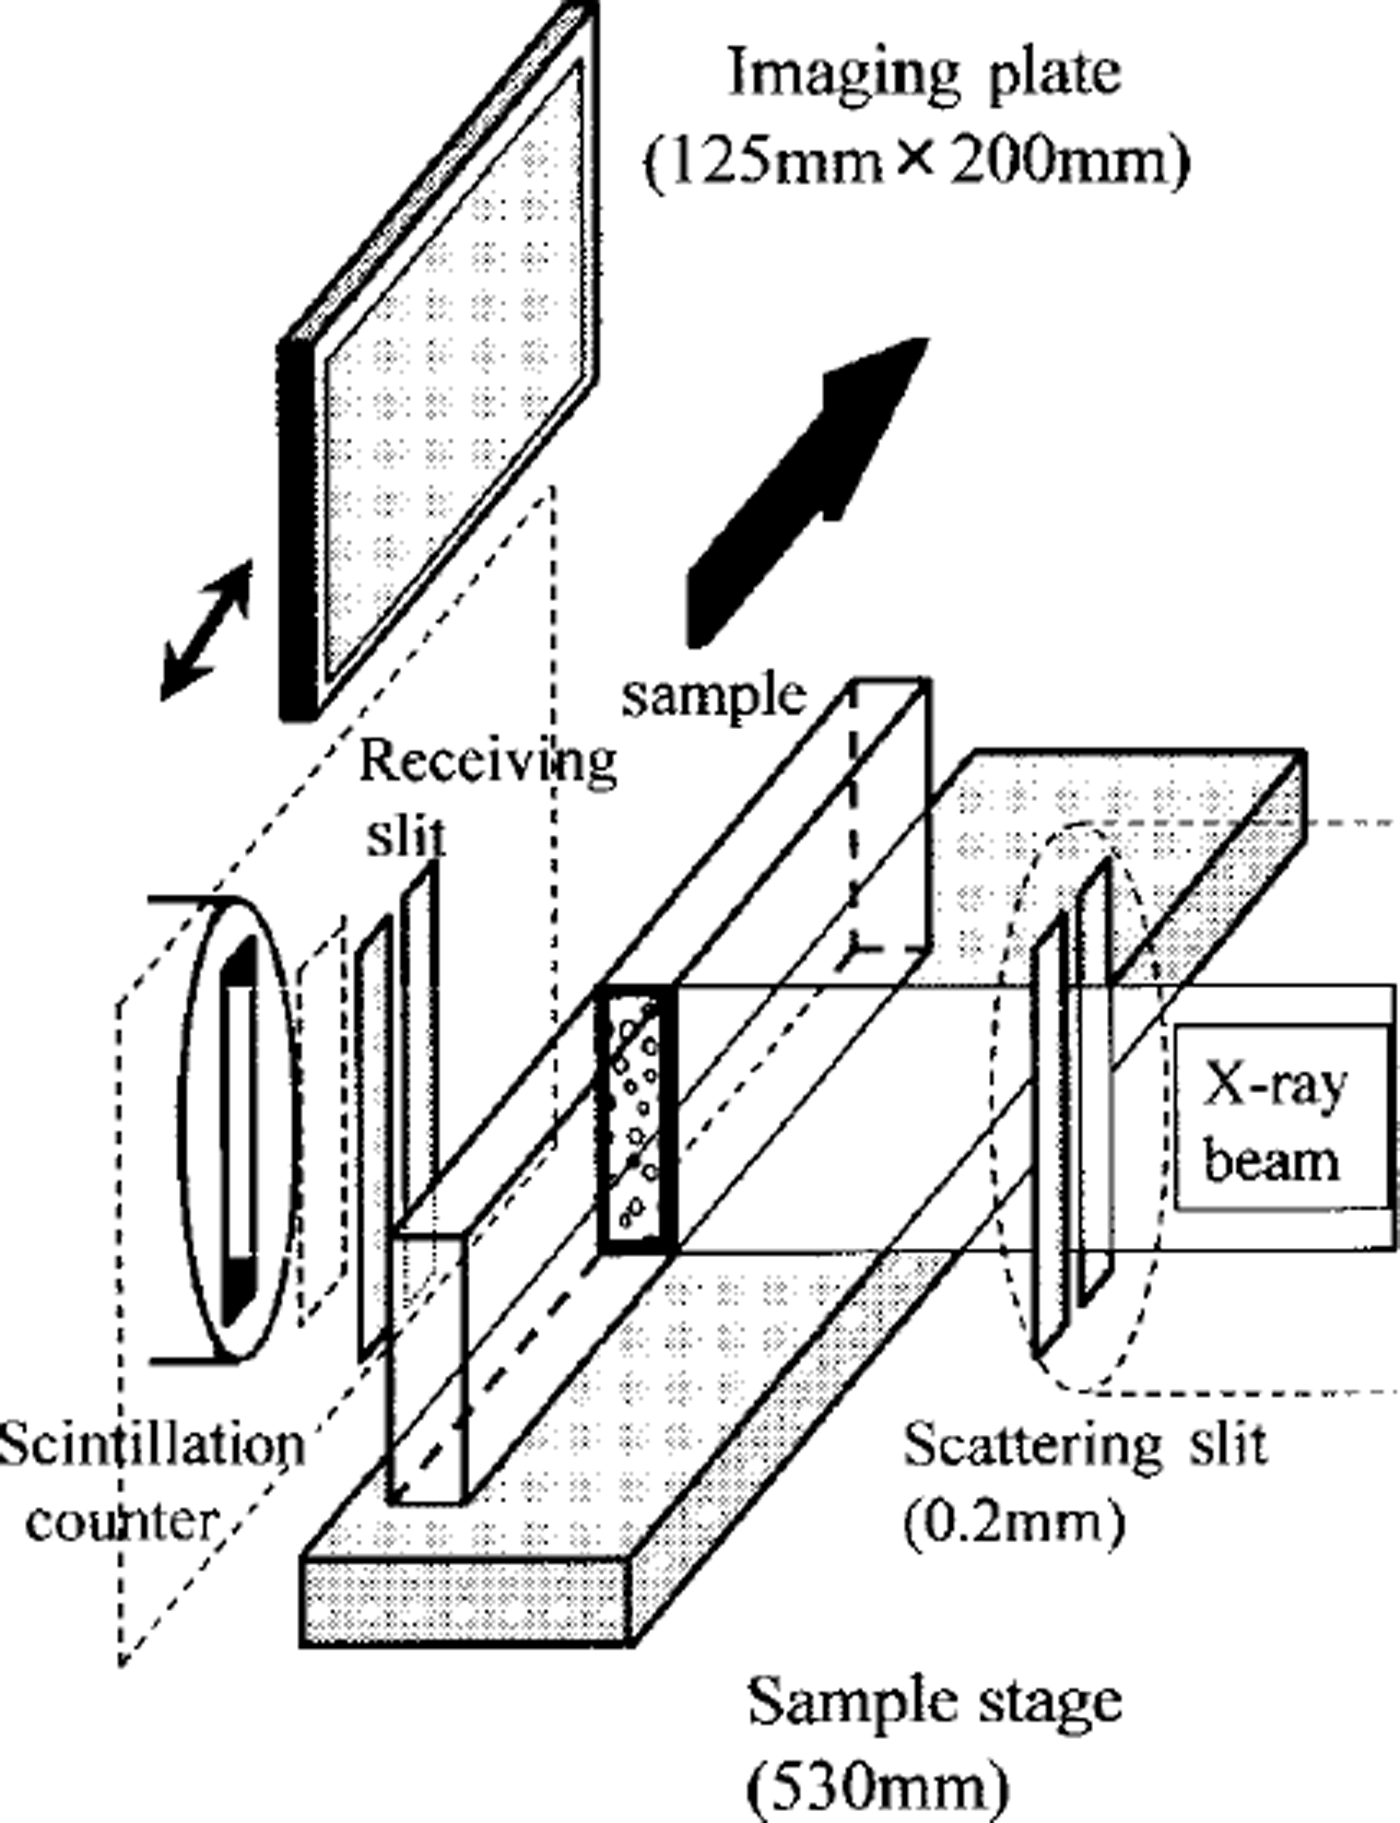
X-ray radiographs were taken on IPs. The length of an IP is about 20 cm, while that of the longest sample is about 50 cm. Thus the data were compressed into one-third of the length of the sample axis. The spatial resolution of IPs was originally 100 µm by 100 Mm. Accordingly, the spatial resolution of the data along the sample axis was considered to be about 300 µm in this measurement.
Results and Discussion
Density profile
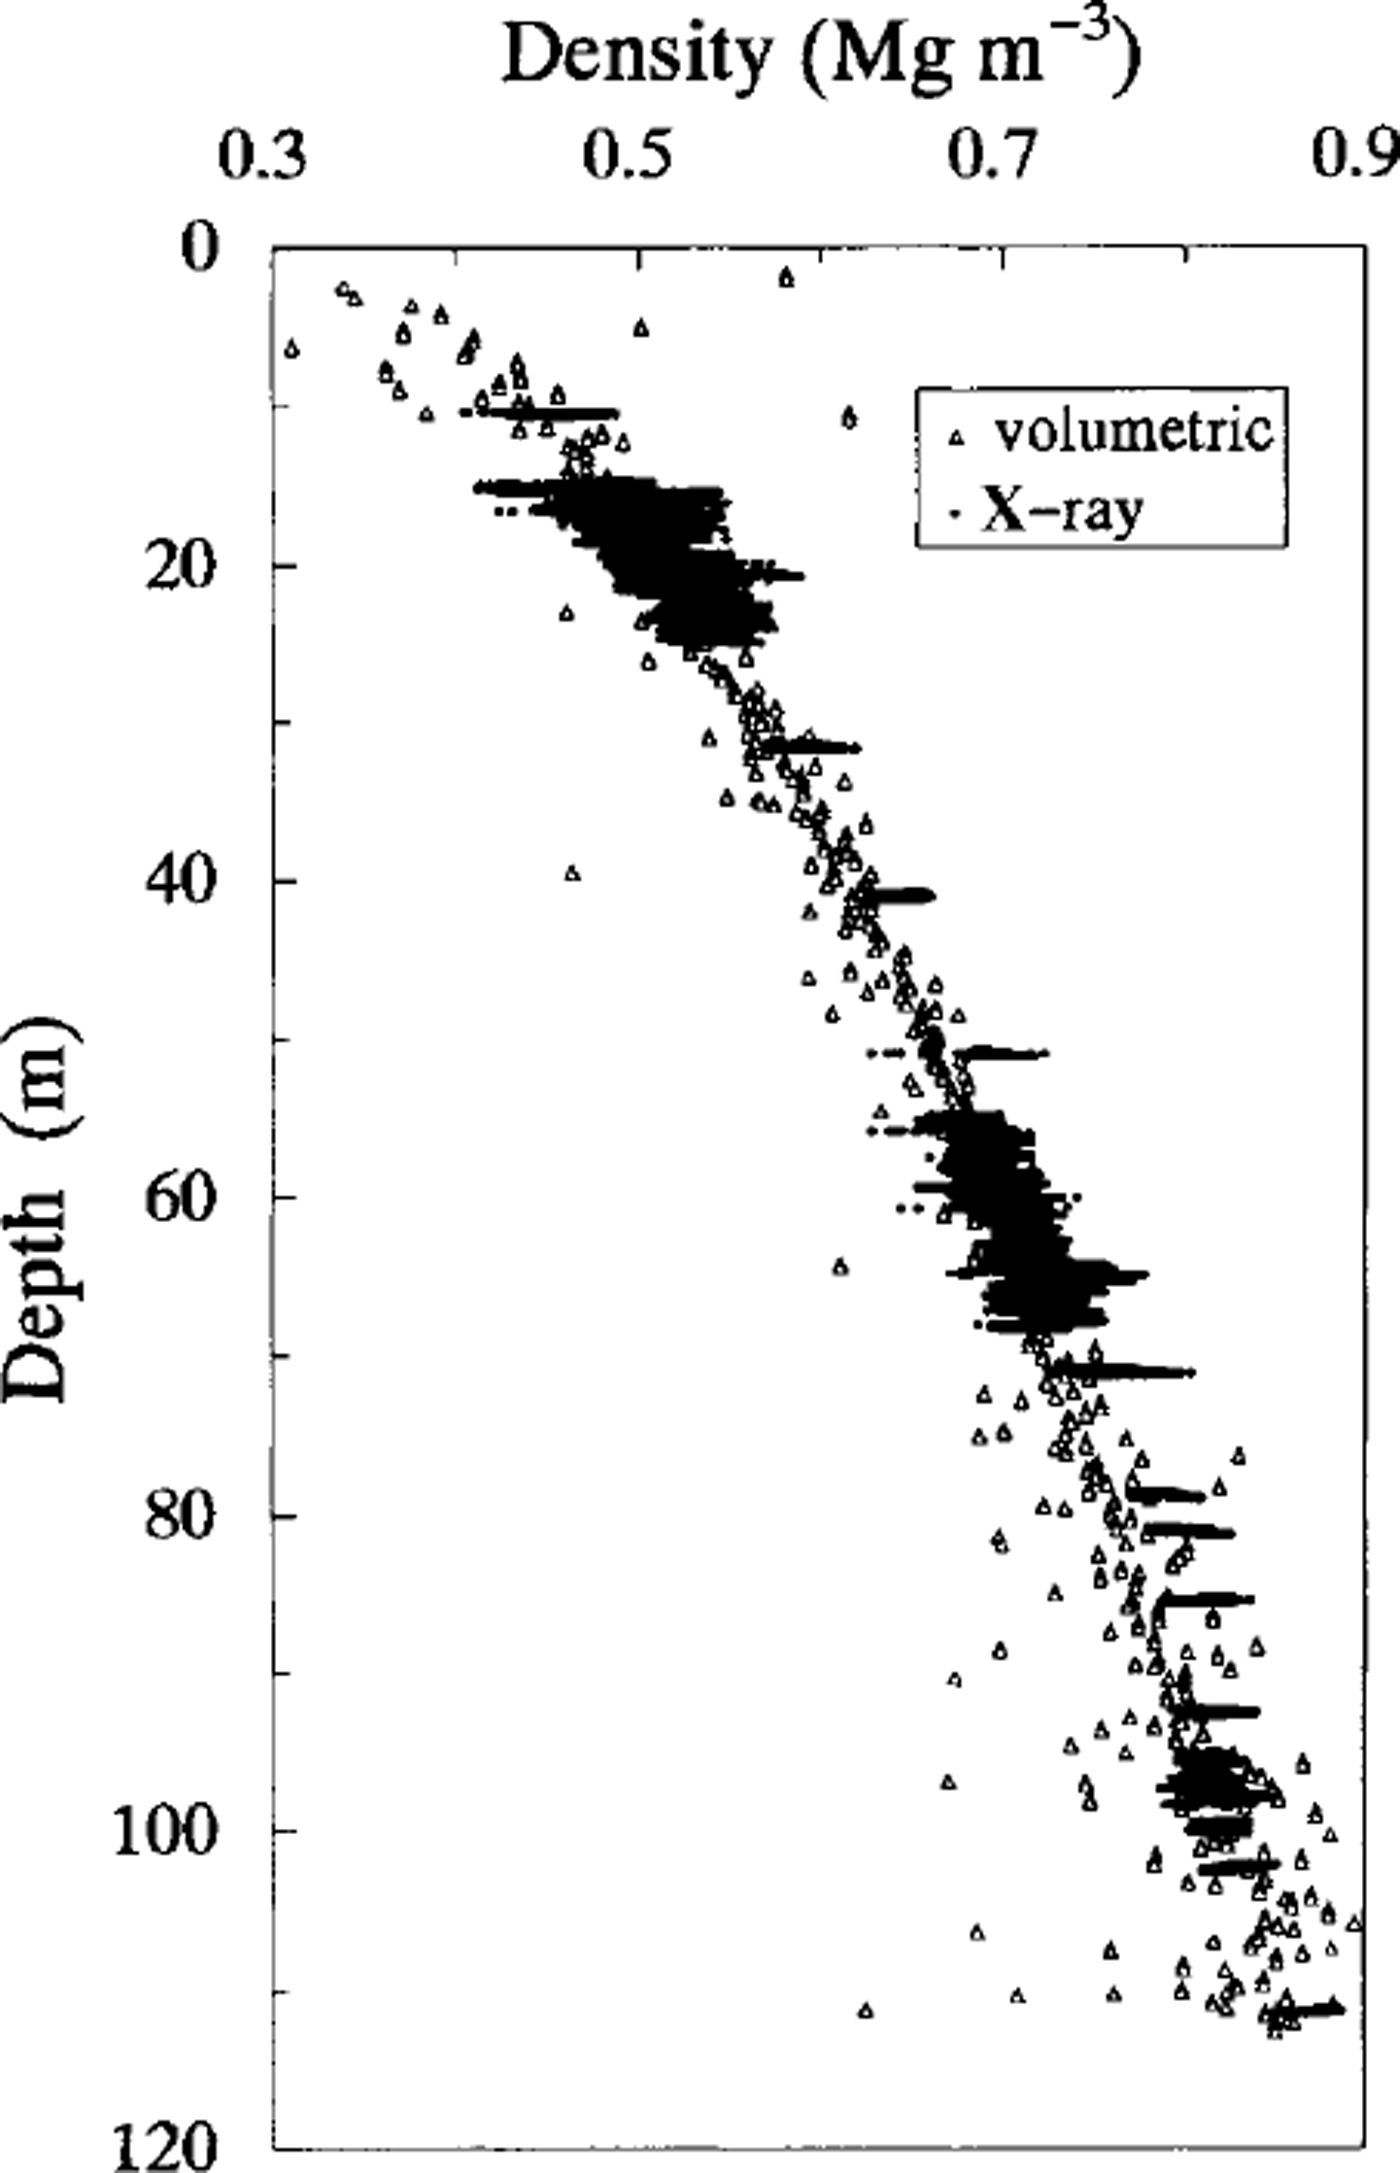
A detailed density profile of ice cores was calculated using Equations (1) and (2). Figure 2 shows the density profile obtained in the present work and that measured by the conventional volumetric method (Reference WatanabeWatanabe and others, 1997a). The average density of each sample was consistent with the density measured in the above-mentioned way. In Figure 2, the fluctuation of the density was found. Then the standard deviation of the density was calculated for several samples. Figure 3 shows that the standard deviation, a, rapidly decreases as depth increases to 25 m, where the average density is about 0.55 Mg m−3. After that, it seems to be almost constant.
The density profile of the Done Fuji shallow ice core measured by the X-ray transmission method (dots) and by the conventional volumetric method (open triangles). The latter measurement was made at the drilling site.
The standard deviation, σ, of the density measured by the X-ray transmission method. Mote the decreasing trend in standard deviation, which ceases at around 25 m depth where the density is 0.55Mgm3.
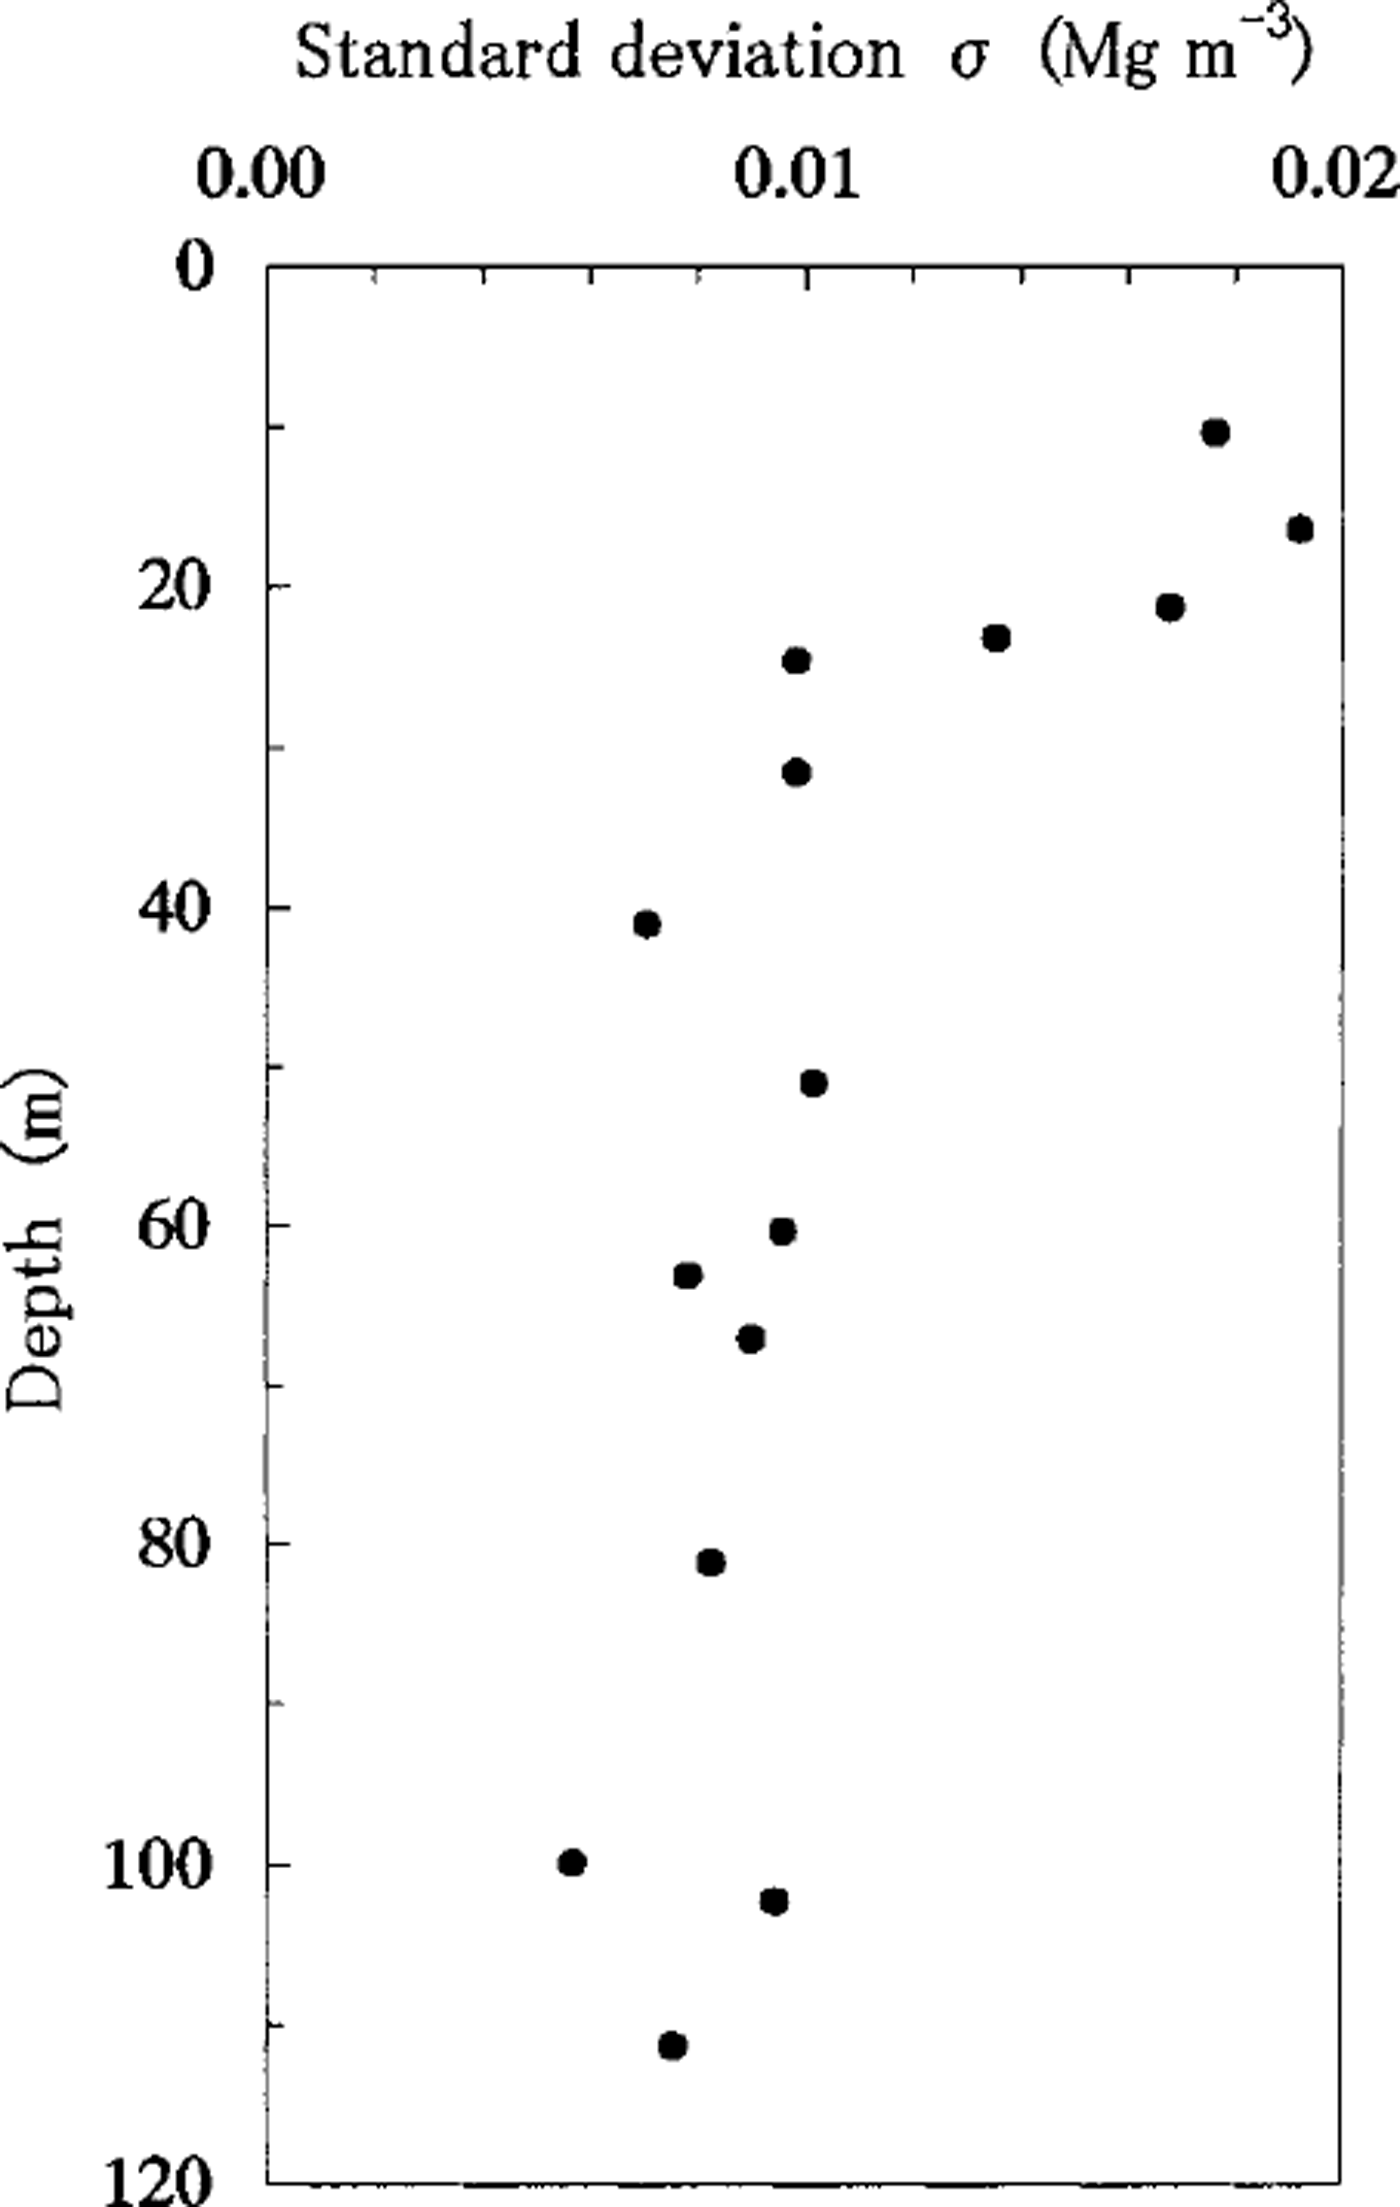
In general, three transitions exist in the densification process, around 0.55,0.73 and 0.83 Mg m−3, and the mechanism of densification changes from the packing of ice particles to their plastic deformation around a density of 0.55 Mg m−3 (Reference Narita, Maeno and NakawoNarita and others, 1978). The ice particles are not closely packed at densities of <0.55 Mg m−3.
In this measurement, the X-ray beamwidth (which is assumed to be the slit width, 0.2 mm) is smaller than the average grain-size, even in the shallow ice core (Reference WatanabeWatanabe and others, 1997a) where the grain-size is reported to be >0.5mm. This measurement is therefore considered to be sensitive to the spatial distribution of the grains. Hence, the fluctuation of the spatial distribution of the grains decreases with the increase of the density.
Although the density profile was compared with the ECM profile measured at the drill site, no definite correlation between them was found except for several short intervals.
Density profile of each sample and its radiograph
X-ray radiographs of ice-core samples of different depths are shown with the corresponding density profiles in Figure 4. Several dark layers with high density are seen in the radiographs. These layers are perpendicular to the sample axis. In these radiographs, the intensities of X-rays transmitted through the ice core are not converted to densities.
The density profile of ice-core samples from different depths and the corresponding radiographs. Diagrams below the radiographs show the two-dimensional layer structures seen in the radiographs.
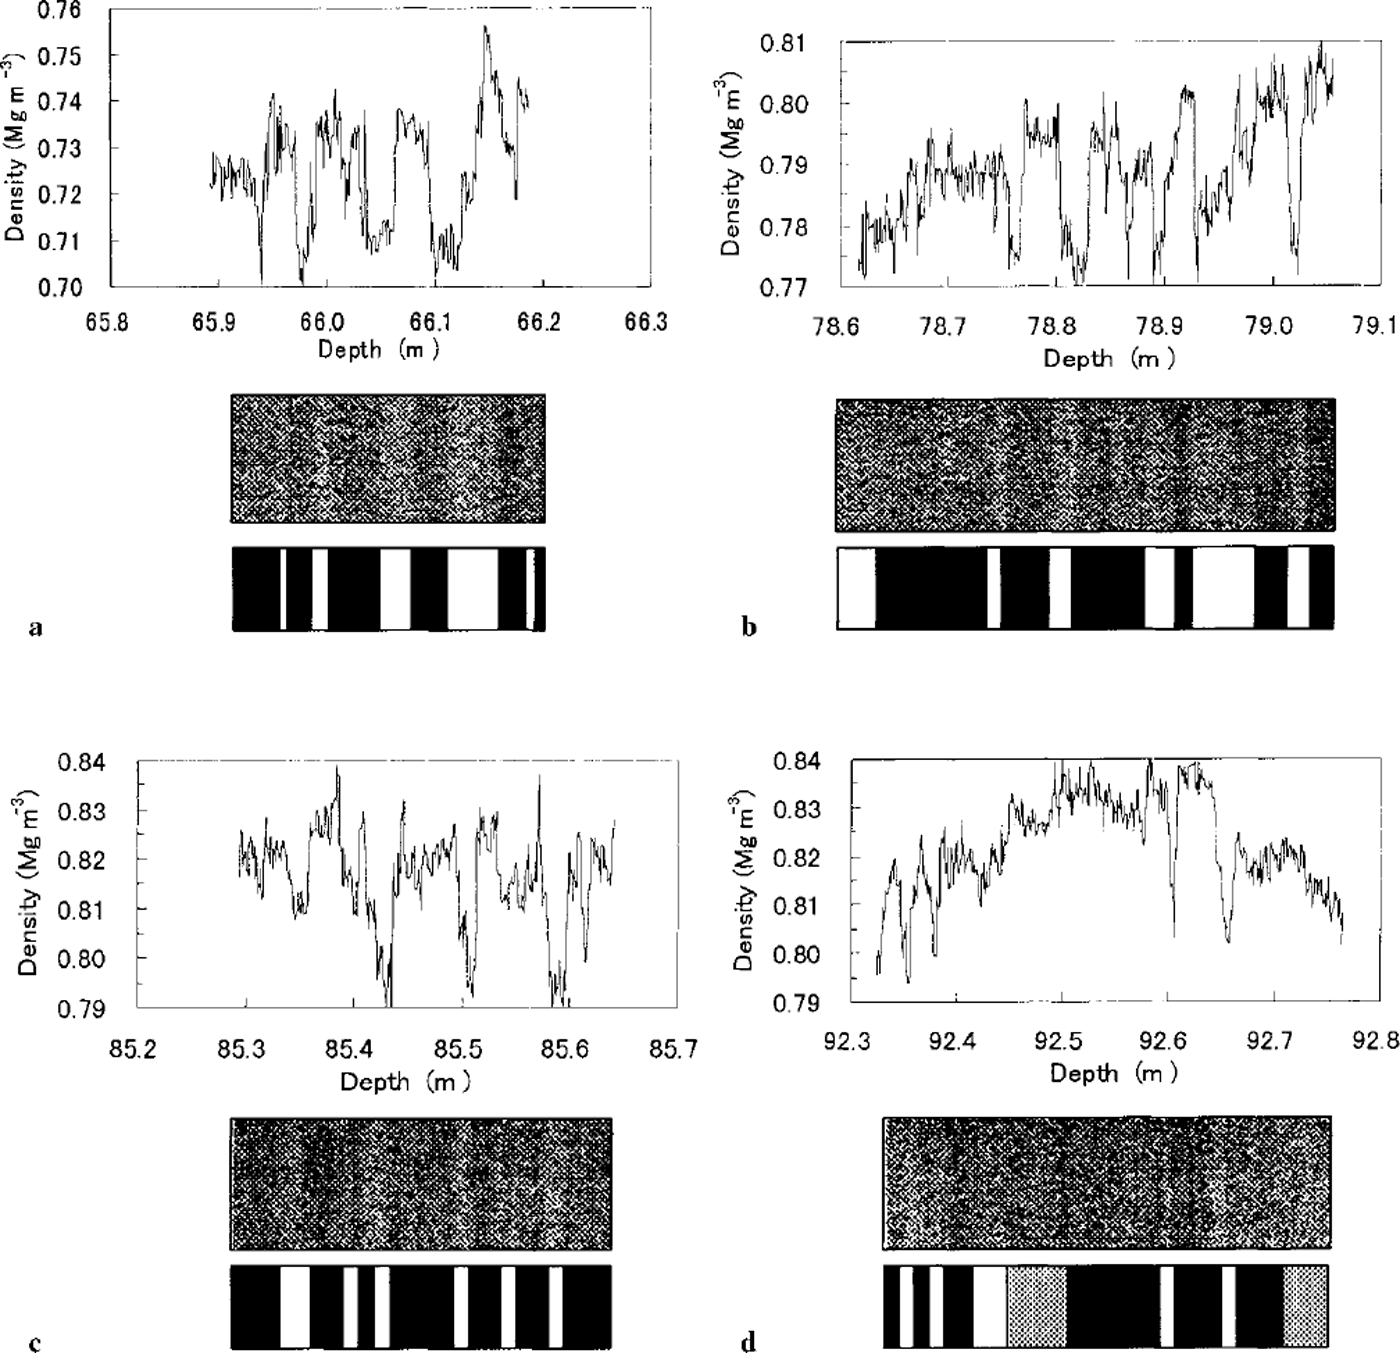
A correlation between density and permeability has been investigated in detail (Reference Langway, Shoji, Mitani and ClausenLangway and others, 1993), and the threshold density for the permeability was estimated at about 0.81 Mg m−3. The permeability of the Dome Fuji shallow ice cores was measured and reported to decrease rapidly from about 80m depth (Reference WatanabeWatanabe and others, 1997a). In Figure 4a, the density is much lower than the threshold value 0.81 Mg m−3, and the sample was permeable. In Figure 4c, the density of some of the dark layers is >0.81Mg m−3, while it does not reach 0.81 Mg m−3 in Figure 4b. In Figure 4d, in most parts of the sample, the density is >0.81 Mg m−3; the permeability of this sample was therefore low. Although the radiographs are used to view the two-dimensional layer structure in this study two-dimensional numerical data of density can be obtained from the radiographs.
Spectral analyses
The density profile is generally considered to reflect the seasonal variation, but this was not evident in our results. The power spectrum for each sample was calculated by the DFT. Before this calculation the individual data, di, were normalized by the average density of the sample, dav. They were then multiplied by the Hanning-type window function Wi which is described as
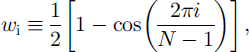
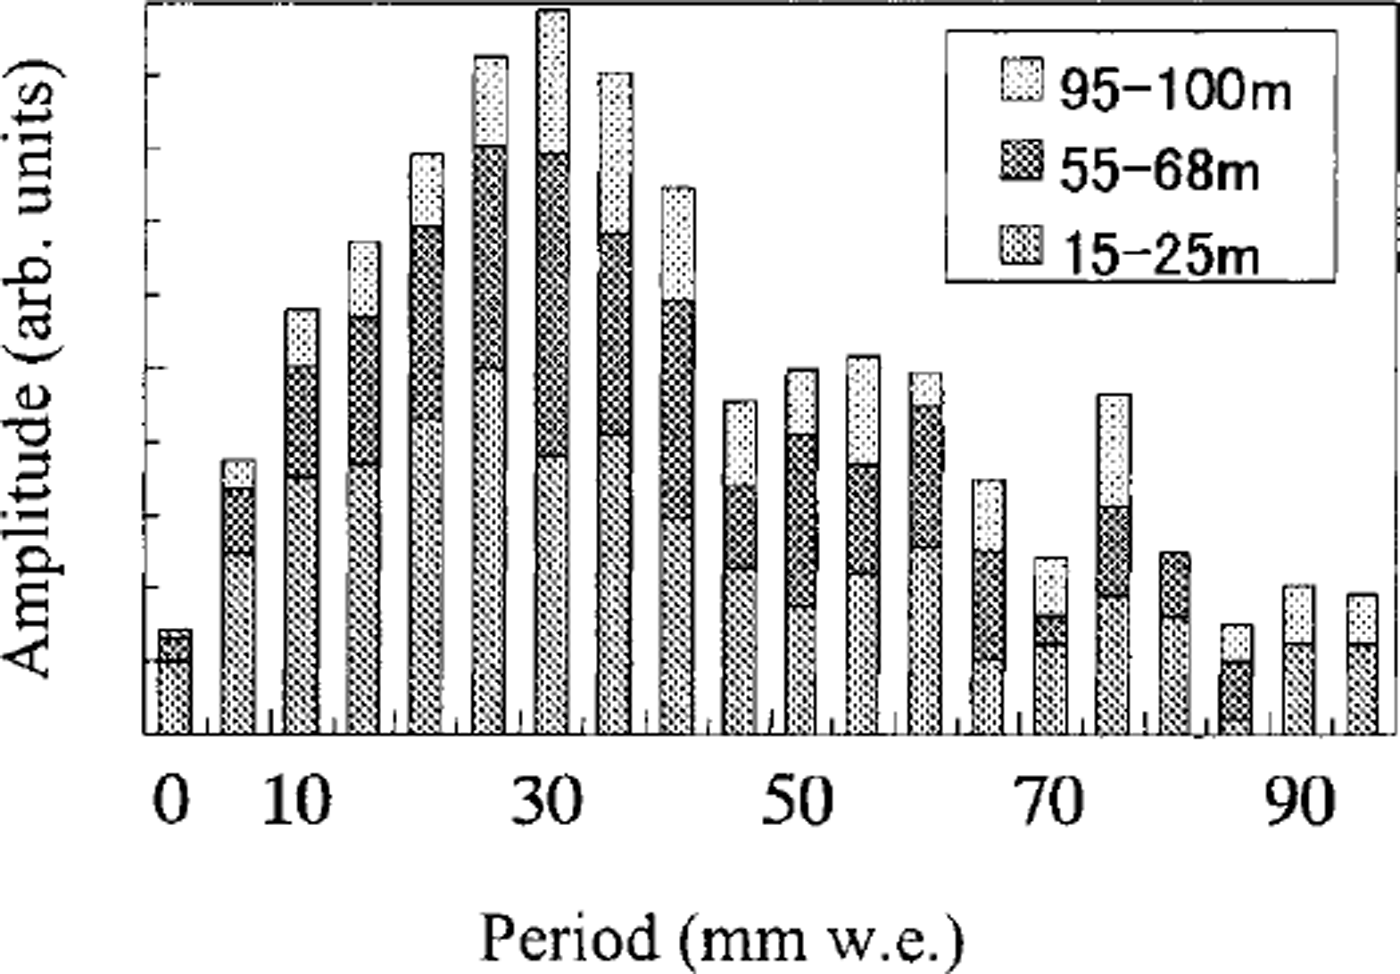
where N is the number of data. Then (di/dav)w, is transformed by DFT. Although the calculated peak positions were different for the different samples, the main peaks were located at 30-40 mm in many samples. For many samples longer than 30 cm, values of the amplitude in the spectra were summed at period intervals of 5 mm. The result is shown in Figure 5. There seems to be a broad peak around 30 mm, which is approximately equal to the annual accumulation at the drill site (Reference WatanabeWatanabe and others, 1997b). This was almost independent of the depth intervals of the samples.
The integrated spectrum for the Dome Fuji shallow ice cores.
Conclusion
A detailed density profile for the shallow Dome Fuji ice cores was obtained by a new method, i.e. the X-ray transmission method. Variations of density in the ice cores were found in this detailed profile. A decreasing trend in density standard deviation ceases at around 25 m depth where the density is 0.55 Mg m−3.
X-ray radiographs showed the existence of thin layers with a high density of >0.81 Mg m−3, although the average density was <0.81Mg m−3. This suggests that the ice may be impermeable. Thus, detailed density profiles and X-ray radiographs of ice cores are effective tools for studying the impermeability of ice cores.
From the density profile obtained, we calculated the power spectrum by DFTand obtained distributions of several peaks at different periods. The center of the distributions of the peaks was found at about 30-35 mm, which is approximately equal to the annual accumulation at the drill site.



