Does state coercion against anti-regime protests trigger more opposition to the regime, or does it decrease support for protest movements? Political scientists are increasingly interested in how mass demonstrations and state repression shape political attitudes but the findings are mixed. While there is evidence that the use of coercive measures can decrease support for protest movements by deterring risk-averse citizens (Young, Reference Young2019; Tertytchnaya and Lankina, Reference Tertytchnaya and Lankina2020), others disagree and argue that state coercion leads to stronger opposition by encouraging bystanders to challenge the regime (Aytaç et al., Reference Aytaç, Schiumerini and Stokes2018). Besides, a growing body of literature examines the heterogeneity in the effects of state coercion (Lupu and Peisakhin, Reference Lupu and Peisakhin2017; Sullivan and Davenport, Reference Sullivan and Davenport2017; Rozenas and Zhukov, Reference Rozenas and Zhukov2019).
While this literature enhances our understanding of state coercion in social movements, there are still some gaps to be filled. First, the mixed empirical findings on the effect of state coercion imply that we need a conditional theory that incorporates the moderating effect of economic, political, and social variables and an estimation strategy that allows us to fully uncover these moderators. Second, existing studies that explore the heterogeneous effects of state coercion have not yet fully accounted for the moderating effects of socioeconomic factors.
In this research note, we fill these gaps by making theoretical and methodological improvements to the scholarship. Theoretically, built on the argument of Wang and Wong (Reference Wang and Wong2021), we introduce citizens’ sense of economic insecurity caused by protest movements as an important moderating factor that helps shape their responses to state coercion. On average, citizens can be emotionally mobilized by state violence and become sympathetic toward anti-regime protests (Aytaç et al., Reference Aytaç, Schiumerini and Stokes2018). However, their disapproval of state-led repressions can be mitigated if their economic interests are negatively impacted by the protests. This heterogeneity in citizens’ responses to state violence arise for two reasons. First, well-off citizens are generally more satisfied with status-quo social inequalities and are concerned about possible redistribution of wealth as a result of regime change (Dorsch and Maarek, Reference Dorsch and Maarek2019). Hence, they are more tolerant of state repression that helps defend the regime. Second, nonpeaceful tactics taken by protesters, such as the occupation of important locations, road blocking, or physical assaults, can increase the anxiety of the residents in the neighborhood over their economic well-being (Wang and Wong, Reference Wang and Wong2021). This anxiety is particularly strong among residents whose professions are especially vulnerable to social unrest, such as transportation and manufacturing. In the face of economic insecurity resulting from anti-regime protests, some subsets of citizens are more likely to support the regime's rhetoric that stability and prosperity are of foremost importance and to accept the use of repressive measures to contain the ongoing social movement (Wong et al., Reference Wong, Ma and Lam2018; Wasow, Reference Wasow2020). Methodologically, we need an estimation strategy that allows us to fully uncover treatment effect heterogeneity when the number of potential moderators is large. As we will show in the following, causal forests, a data-driven machine learning method, are an appropriate approach.
In this research note, we examine the effect of state coercion on citizens’ political attitudes by focusing on how repressive measures affected the voting outcome in the 2019 District Council Election in Hong Kong. This particular election merits attention for several reasons. First, it was held in the midst of a mass-scale social movement, and thus was regarded as a de facto referendum on the ongoing anti-regime protests. Second, a large proportion of protesters in Hong Kong explicitly aimed to strengthen their leverage vis-à-vis the government by destabilizing the city and damaging the economy.Footnote 1 In other words, we see a direct confrontation between the call for economic security and the aspiration for democracy. Hence, this election is particularly suited to studying the role of citizens’ sense of economic insecurity in a social movement. Finally, among the police tactics to disperse crowds, the frequent use of tear gas became a focal point of controversy because of its effects on the health of protesters and local residents. Therefore, we have a clear proxy variable for state coercion that facilitates the estimation of its impact.
Using causal forests, we can estimate the heterogeneous effect of tear gas usage specific to each constituency. We find that on average, the use of tear gas in a constituency could increase the vote share for pro-democracy candidates but there is a heterogeneity in its effect. We then identify the sources of such heterogeneity by leveraging the measure of variable importance embedded in the causal forests algorithm. The results suggest that citizens’ income level and professions are indeed among the most important moderators in determining the treatment effect of tear gas deployment. These important moderators are all hidden by multiplicative interaction models but can be uncovered by using causal forests. Simply put, materialistic values and economic concerns still matter in the pro-democracy movement of Hong Kong: citizens whose economic interests are negatively impacted by the protests show less disapproval of police violence.
1. Background information
There are two major political factions in Hong Kong, the pro-democracy camp and the pro-establishment camp. The former has been demanding democratization, while the latter in general supports the policies of the Hong Kong Government and Beijing. Since June 2019, Hong Kong citizens took to streets to protest against a proposed extradition bill that would allow Hong Kong authorities to extradite its citizens to mainland China. The protests gradually evolved into a mass movement that demands the investigation of police violence and political reforms (Lee et al., Reference Lee, Yuen, Tang and Cheng2019). Among the police tactics to disperse the crowds, the extensive use of tear gas was heavily criticized by the pro-democracy activists because of its health effects on protesters and local residents. Hence, we use it as a proxy for state coercion.
To measure Hong Kong citizens’ political preferences, we focus on the voting outcome of the Hong Kong District Council Election held on 24 November 2019. Hong Kong is divided into 18 districts. Each district has one District Council that is mainly a consultative body with no substantial power. The number of seats for a District Council ranges from 13 to 45, depending on the population size of the district. Each seat represents one directly elected constituency and is returned by the plurality rule. For example, Kowloon City, one of the 18 districts in Hong Kong, is divided into 25 constituencies, each of which provides one councillor. These 25 councillors constitute the Kowloon City District Council. In the 2019 election, there were in total 452 District Council constituencies in Hong Kong all of which were up for elections. Prior to 2019, voters had little interest in the District Council elections, leaving most seats uncontested. However, in the wake of the anti-extradition bill protests, the District Council election had been widely viewed as a de facto referendum on the ongoing social movement as it was the only election held in 2019. The result was highly meaningful as it directly showed whether citizens supported the government's responses to the protests or not. The election witnessed a record turnout of 71.2 percent: approximately 2.94 out of 4.13 million registered voters cast their ballots in the election, including many first-time voters. The pro-democracy camp achieved a landslide victory over the pro-establishment camp, winning 389 out of 452 seats, and taking control of 17 of the 18 District Councils.
2. Data and methodology
In this research note, we examine the effects of tear gas usage on the vote share of pro-democracy candidates (ranging between 0 and 1) in the 2019 District Council Election of Hong Kong. The unit of analysis is constituencies. Our sample includes 435 constituencies that have not been redistricted or only slightly redistricted after the 2015 District Council Election. Excluding redistricted constituencies is unlikely to do a disservice to causal inference as redistricting does not affect the vote share of pro-democracy candidates (Wong, Reference Wong2019b). Between June 12 and November 23, the Hong Kong police fired tear gas in 159 of the 435 constituencies in our sample. Among these constituencies, 62 of them were exposed to tear gas in only one confrontation event, 27 were exposed in two events, and eight were exposed in over ten events. The treatment variable takes the value of one if tear gas was used in a constituency.Footnote 2 The data on tear gas usage are collected from the ANTIELAB (ANTI-Extradition Law Amendment Bill) Research Data Archive (ANTIELAB Research Data Archive, 2020). The exact location of tear gas deployment is presented in a map in the Appendix.
We are interested in how the effect of tear gas usage is moderated by the characteristics of the constituency. Conventionally, scholars apply multiplicative interaction models to study conditional treatment effects (Brambor et al., Reference Brambor, Clark and Golder2006). However, the linear interactive effect assumption inherent in these models may not necessarily hold (Hainmueller et al., Reference Hainmueller, Mummolo and Xu2019). Moreover, the common practice to simply include additive control variables into interaction models could be problematic for many data generating processes (Beiser-McGrath and Beiser-McGrath, Reference Beiser-McGrath and Beiser-McGrath2020). Hainmueller et al. (Reference Hainmueller, Mummolo and Xu2019) provide two alternatives to multiplicative interaction models, namely, the Binning and Kernel Estimators, both of which only allow for treatment effect heterogeneity along one moderator. Hence, these models may still fail to fully uncover the heterogeneity in treatment effects. Therefore, we use causal forests, a supervised machine learning algorithm that enables a fully nonparametric estimation of the treatment effect for each individual observation.Footnote 3 Causal forests also provide asymptotically valid confidence intervals for each estimated treatment effect, thus allowing for statistical inference in which we social scientists are more interested.
The causal forest (CF henceforth) algorithm is an application of random forests to causal inference. Using CF, we can estimate a specific conditional average treatment effect (CATE) for each individual observation. At a high level, in the execution of the CF, we use random forests to identify the most similar observations locally in covariate space and estimate the treatment effects by comparing the treated and untreated observations that are “grouped” together using random forests. Different from random forests, which focus on predictions, the CF allows us to estimate the effects of a treatment variable with asymptotically valid confidence intervals, thus allowing for hypothesis testing and causal inference. The calculation details of the application of random forests in the CF are provided in the Appendix.
A consistent estimation of CATEs using causal forest requires the unconfoundedness assumption, that is, the treatment (i.e., the use of tear gas) should be statistically independent of the outcome (i.e., the vote share) conditioned on the characteristics of the constituencies. Similar to conventional statistical analysis, no selection into treatment is allowed; we cannot omit any constituency characteristics that encourage the police to use tear gas and affect residents’ vote choice. We believe this identification assumption of the CF is met as the use of tear gas is as-if random conditioned on the characteristics we have controlled for. Among these characteristics, we include the frequency of confrontations between the protesters and the police in a constituency. Data on this variable are also collected from the ANTIELAB Research Data Archive. The number of confrontations may reflect latent factors that simultaneously trigger police repression and motivate local residents to vote for pro-democracy candidates. Following a similar logic, we also account for constituency-level partisanship by controlling for the party affiliation of the incumbents.Footnote 4 Qualitative evidence also supports the unconfoundedness assumption. Reports by the Independent Police Complaints Council of Hong Kong suggest that the police deployed tear gas mainly to buy time for retreat or to defend important business, government, or transportation spots under siege (Independent Police Complaints Council, 2020). The use of tear gas was a tactic used in response to the protesters’ immediate action, and thus it should be orthogonal to the political preferences of the voters after we control for the frequency of confrontations. Together, we can rule out the possibility of confoundedness introduced by voters’ pre-treatment attitudes towardthe state and the government. The definitions and summary statistics of the covariates are provided in the Appendix.
3. Estimation results
For comparison, we estimate OLS (ordinary least squares) regression models with and without interaction terms between the treatment variable and all covariates. The results are reported in the Appendix. These models assume a constant treatment effect or linear interactive effects, respectively, and have low statistical power because of the high-dimensional problem. In the model without interaction terms, the use of tear gas increases the vote share of pro-democracy candidates by 1.07 percentage points. The coefficient on tear gas usage in the interaction model is statistically indistinguishable from 0 at the 90 percent level. Besides, none of the interaction terms are significant either except for some of the age distribution variables. The result of the multiplicative interaction model suggests that the use of tear gas did not influence the voting outcome and that most socioeconomic covariates did not moderate the impact of tear gas deployment. We believe that the null findings result from the low statistical power of multiplicative interaction models, and thus we recommend an alternative estimation strategy of the CF.
We then estimate the CATEs using the CF. For each constituency, we obtain an individualized treatment effect with its 95 percent confidence interval estimated. The CATEs have a mean of 0.0131 and range from 0.0064 to 0.0250. In other words, using tear gas increases the vote share of pro-democracy candidates by approximately 0.6-2.5 percentage points. The effect is quite substantial, considering that the margin of victory for pro-democracy candidates is less than three percentage points in 45 constituencies. The CF also generates confidence intervals for the CATEs. Among all 435 estimates, 185 are statistically larger than 0 at the 95 percent confidence level. Hence, there is evidence that tear gas usage can motivate support for pro-democracy candidates in approximately 43 percent of all constituencies in our sample.
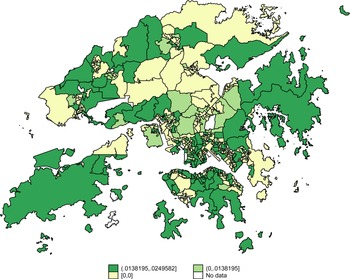
We can also obtain the average treatment effect (ATE) using the CATEs. Specifically, we employ the doubly robust Augmented Inverse Propensity Weighting (AIPW) estimator (Robins et al., Reference Robins, Rotnitzky and Zhao1994, Reference Robins, Rotnitzky and Zhao1995). The AIPW estimate is 0.0151, which is close to the mean of the CATEs, with a 95 percent confidence interval of [0.0057, 0.0245]. The distribution of the 435 estimated CATEs is presented in Figure 1 with the ATE highlighted in red. Heuristically, the spread of CATEs suggests that the treatment effects are heterogeneous. Figure 2 shows the heterogeneous effects of tear gas usage across the constituencies in the sample. All insignificant CATEs are replaced with a zero in the map. Generally, using tear gas is likely to trigger more oppositions in constituencies located on the Hong Kong Island and Kowloon than in the New Territory (the northern part of Hong Kong adjacent to mainland China).
Distribution for the CATEs of tear gas usage.

CATEs of tear gas usage in Hong Kong's constituencies.

4. Exploring the sources of heterogeneity
We proceed to explore the sources of the treatment effect heterogeneity. To identify important moderators, we leverage the variable importance measure used in random forests that is also available for the CF. This measure reflects the frequency of each covariate being split in the forests. The five most important covariates are listed in Table 1.Footnote 5 The percentage of non-first-time voters below 35 contributes the most to treatment effect heterogeneity, followed by the percentage of employees in the transportation and trade sector, median household income, and the percentages of manufacturing workers. Four out of the five most important covariates are socioeconomic variables, implying that the effect of tear gas deployment is influenced by the socioeconomic characteristics of the constituency. This pattern is not revealed by using OLS regression even with multiplicative interaction terms.
Variable importance

We present the variation of the treatment effect in these important moderators by using marginal effect plots. Specifically, we fix all covariates other than the moderator of interest at their median level, predict the CATEs and their 95 percent confidence intervals, and plot the predicted CATEs along the moderator. The marginal effect plots are represented in Figure 3.
Treatment effect along important moderators. The figures report marginal treatment effects with 95 percent confidence interval. The horizontal axis measures the level of moderators. The solid line represents the treatment effect and the dashed line represents the data distribution along the moderator.

Age and voting experience. The plots show that the effect of tear gas usage decreases in the percentage of non-first-time voters below 35. Although there is the impression that young people in Hong Kong strongly oppose police violence, the results suggest that tear gas has an even stronger effect in constituencies with a higher percentage of aged voters who used to support pro-establishment candidates in previous elections. The outcome implies that many former pro-establishment supporters defected and voted punitively against the entire pro-establishment camp, causing the unprecedented victory of the pro-democracy faction.
Occupation. The treatment effect decreases in the percentage of employees in the transport and manufacturing sectors. Employees in these sectors may suffer from economic losses due to the road blocking tactics of the protesters, and thus are relatively more tolerant of police violence. On the other hand, the use of tear gas triggers more support to pro-democracy candidates where there is a higher share of trade sector employees. International traders are more concerned about the damage to Hong Kong's reputation caused by the government's repressive measures and the loss of institutional comparative advantage that follows, and thus are more cautious about the use of tear gas (Feenstra and Hanson, Reference Feenstra and Hanson2004).
Income. The treatment effect also decreases in income when the median monthly household income is lower than 45,000 HKD, but this trend no longer exists where median household income is higher than 45,000 HKD. We still interpret this as evidence that supports our argument because 88 percent of the constituencies in our sample have an income level lower than 45,000 HKD. Thus, the negative association between income and treatment effects applies to most constituencies except those who are especially wealthy.
5. Conclusion
In this research note, we estimate the heterogeneous effects of tear gas usage on the vote share of pro-democracy candidates in the 2019 Hong Kong District Council Election. We apply the causal forest algorithm to obtain the treatment effect for each constituency and uncover important patterns hidden by OLS regressions. The results suggest that socioeconomic variables are important moderators of the impact of tear gas deployment. Specifically, using tear gas tends to trigger more support for pro-democracy candidates in constituencies with lower shares of transportation and manufacturing workers and with lower income for most constituencies. Simply put, economic factors, particularly those that can cause a sense of economic insecurity among residents still matter in influencing how citizens respond to state coercion in the context of a democratization movement.
Supplementary material
The supplementary material for this article can be found at https://doi.org/10.1017/psrm.2021.70. To obtain replication material for this article, please visit https://doi.org/10.7910/DVN/CX1OGZ.
Acknowledgments
We would like to thank Li Zheng at the Institute for Economic and Social Research, Jinan University for his guidance. We would also like to thank the two anonymous reviewers for their helpful comments. Jiemin Wu provided excellent research assistance.