Hurricane Katrina
On Monday, August 29, 2005, the Gulf Coast of the United States was hit by the sixth most destructive Atlantic hurricane on record, Hurricane Katrina. Katrina formed in the Bahamas on August 23 and entered the Gulf of Mexico two days later, on the twenty-fifth (Knabb Reference Knabb2005). Twelve hours after entering the gulf, Katrina grew from a Category 3 to a Category 5 storm on the Saffir-Simpson scale, with winds up to 160 miles per hour. Katrina made landfall on the twenty-ninth as a powerful Category 3 storm with winds up to 145 miles per hour. However, once Katrina made landfall she maintained a storm surge equivalent to a Category 5 storm. For the city of New Orleans, the greatest threat without question was to be from the storm surge. Lake Pontchartrain—which normally sits at one foot above sea level—was elevated to eight and a half feet above sea level. On Tuesday, August 30, the city's levees broke in three places—along the Industrial Canal, the 17th Street Canal, and the London Street Canal (Mihelich Reference Mihelich2005). As a result, 80% of the city was flooded, in some places with water as high as 20 feet above sea level (Knabb Reference Knabb2005).
A run-in with the forces of nature is nothing new to the city of New Orleans. Historically, New Orleans has been subjected to a multitude of hurricanes. Collectively these have tested the city's levee system, forced population migration, resulted in human suffering and death, and produced substantial financial costs. The Great Hurricane of 1722, for example, produced an 8-to-10-foot tidal surge that caused people living near the Mississippi River to migrate further inland. During the Mexican-American War in 1849, a levee collapsed and sent floodwater to saturate 200 city blocks for six weeks. In 1893 a hurricane killed more than 2,000 residents, and the Great Storm of 1909—equivalent to a Category 4—killed hundreds. As a result of the Great Mississippi Flood of 1927, city leaders opted to protect the French Quarter from future flooding by the detonation of 30 tons of dynamite at the Caernarvon Levee to help reroute water away. The result was the drowning of the poorer areas of the city's Lower 9th Ward (see Brinkley Reference Brinkley2006 for a thorough discussion of these disasters). In 1965, New Orleans was hit by Hurricane Betsy that claimed the life of 81 city residents. Levees located along the Mississippi River Gulf Coast Outlet along Florida Avenue in the Lower 9th Ward, as well as on both sides of the Industrial Canal, were overtopped. Much of the Lower 9th was destroyed and many buildings and businesses would not be rebuilt due to lack of city loans and grants. Because of Betsy, the Army Corps of Engineer's Hurricane Protection Program was created—the corps built new levees that were taller and made of stronger material to handle a Category 3 hurricane such as Betsy (Dyson Reference Dyson2006). Only four years later, in 1969, Hurricane Camille devastated the city. This powerful storm killed over 250 people and caused over 1.4 billion dollars in damage, making it the most expensive hurricane in history to that time (Blake et al. Reference Blake, Jarrell, Mayfield and Rappaport2005).
As with these prior large-scale natural disasters, the ramifications of Katrina for New Orleans are numerous. Undoubtedly, there are consequences that we can only glimpse dimly if at all from our current vantage point. There will continue to be political as well as social and economic ramifications, at the aggregate and at the individual level. One dramatic consequence of Katrina has been a change in the racial composition of New Orleans. The focus of our present research is the influence of this racial change on the 2006 New Orleans mayoral election.
Demographic Change and Political Ramifications
Demographic Change in the City of New Orleans
Katrina's impact on the city's population has been pronounced. Although a precise count of the number of people in New Orleans has been difficult—citizens fled and returned at various times, and people continue to return—there is general agreement that the population is substantially reduced from its pre-Katrina level. One report indicates that the city of New Orleans lost over 60% of its population as a result of the storm—the population falling from 443,430 (2000 census figures) to 158,353 (U.S. Census Bureau 2006).
For politics in New Orleans, the crucial consideration is not population per se. Rather, the crucial consideration is the racial composition of that population. New Orleans is a city in which race matters—a city with a long history of racial politics. Any change in the racial makeup of the population potentially has profound electoral consequences (an essential point that we will elaborate on later in this paper). It is generally believed that New Orleans underwent a racial change, perhaps a pronounced racial change, as a result of Katrina. The city was 68.1% black in 2000, according to the census. After the storm there was speculation that racial change was so pronounced that the city was now majority white.
Recent census data show that the racial makeup of the New Orleans Metropolitan Area became less black/more white after Katrina. The metro area's racial makeup changed from 37% black (prior to the storm) to 22% black (following Katrina), with an accompanying shift in the white population from 59% to 73% (U.S. Census Bureau 2006). Although these figures are for the New Orleans Metropolitan Area, they strongly suggest the likelihood of a racial change within the city itself. In fact, projections by Jeffrey Sadow, Louisiana State University-Shreveport, indicate that two months after Katrina whites comprised a slightly larger share of the New Orleans population than did blacks—46.4% black, 46.9% white, and 6.7% other. A full year after Katrina, the percentage of the city's population that was black was estimated to still be well below the 68.1% level established by the census at the decade's start—53.7% black, 39.6% white, and 6.7% other (Sadow Reference Sadow2006).
The reverse side of the issue about who resides in the city is of course who resides outside of the city and where. A study by GCR and Associates, which tracked registered voters' change of address forms, concluded that the majority of those who left the city remained relatively close by—if not within the metro area then certainly within the state. The electoral implication of this report, within the context of looming city elections, was that candidates should concentrate on local voters, and not consider to any extent (the small percentage of) voters who were out of the region. GCR's findings were vigorously challenged by lawyers for the NAACP Legal Defense Fund who asserted that the GCR study was methodologically flawed, that a much larger percentage of voters were out of the area, and that the report amounted to a rationale to ignore the large number of African American voters spread across 42 states (Thevenot Reference Thevenot2006a). As much as 73% of Hurricane Katrina evacuees were estimated to be black (Sadow Reference Sadow2006).
Political Ramifications: The Setting for the 2006 Mayoral Election
The focus of our study is electoral politics in the immediate aftermath of Hurricane Katrina. Specifically, our investigation pivots around the 2006 New Orleans mayoral election that took place in the shadow of a devastating natural disaster. A mayoral election that was normally viewed as essentially another local election became as salient as a national election. The mayoral debates were broadcast nationwide and appealed to voters across the country in large measure because of the billions of taxpayer dollars that would be used to rebuild the city. Who would govern New Orleans became a national concern (Roberts Reference Roberts2006).
Criticism of government response to Hurricane Katrina and finger-pointing among government leaders abounded. State and local government were criticized for a poor evacuation plan, for lack of a timely evacuation notice, insufficient food and water in the Super Dome, and lack of sufficient police protection. The federal government was criticized on the grounds that race and class biased government response, for organizational incompetence on the part of FEMA and the Department of Homeland Security, and for lack of resources for domestic needs resulting from the U.S. military commitments in the Middle East. FEMA head Michael Brown attacked New Orleans mayor Ray Nagin in particular for the latter's alleged failure to inform FEMA that the Super Dome would be used as a shelter. Mayor Nagin in turn criticized Brown for playing politics by trying to shift the blame for inadequate government response from Washington to the city, and asserted that FEMA was in fact made aware that the Super Dome was to be used as a shelter of last resort (Nagin, as we know, was at times quite blunt in his assessment of the Bush Administration's handling of the emergency).
Into this immediate post-Katrina setting stepped 21 candidates to challenge Ray Nagin for the New Orleans mayoralty. Although the city's changed racial makeup may not have been the sole motivation driving candidates—attacks on Nagin would make him appear to be a vulnerable incumbent—the relative gain in the proportion of the white population immediately after Katrina undoubtedly provided a strategic rationale for white mayoral hopefuls, of which there were many. In New Orleans, the long-standing connection between racial composition and the election of blacks to city office certainly was apparent to any observer. For example, prior to 1977 no black had been elected mayor of New Orleans and prior to 1976 no black had held a position on the city council. By the time of Katrina, African Americans had occupied the mayoralty since 1978 and the city council had been a majority black since 1986. During this time period, the African American percentage of the New Orleans population increased substantially, from 45% to 68% between 1970 and 2000, according to census figures. Mayoral candidates in the 2006 election, therefore, had to assume that a substantial racial change had taken place (Roberts Reference Roberts2006), and some candidates, former city council representative Peggy Wilson being perhaps the most visible example, would seek to take electoral advantage of racial change (Varney Reference Varney2006).
As a result of Katrina, the decades-long process of growth in the black population and voting pool in New Orleans stopped, at least for a time. To the extent that the black population declined relative to the white population, we can say that the above-referenced process of racial transition reversed. The fundamental question for us is what does this above-referenced reversal mean for electoral politics? Will we witness a change in voting patterns? Will the electoral success of African Americans be diminished? We argue that the results of the 2006 New Orleans mayoral election reveal the persistence of race as a crucial factor in the political life of that city.
Racial Conflict and Accommodation
A fundamental reality of politics is conflict. The issue of conflict and the conditions under which conflict develops certainly spurs interest in the study of political phenomena and guides much political inquiry. In the United States, substantial conflict has revolved around race. Race and conflict have been bound together historically and up through the present day. We investigate political conflict in an urban system—the city of New Orleans—that experienced a catastrophic natural disaster, Hurricane Katrina, which influenced the racial balance of power. Race has played a pronounced historic role in this urban system. Based on this reality, we posit the following racial conflict and accommodation thesis: Race is an enduring influence in electoral politics, and its influence is reflected in a process of racial conflict and accommodation—a process that is dependent upon the racial makeup of the voting pool, i.e., the electorate.
Conflict is based on a historic racial division, which is manifest in the electoral arena through racially polarized voting patterns in elections. The level of conflict, however, varies with the racial composition of the population because the relative proportion of racial groups in the population is linked with group-based political status and power. Inspired by Key's (Reference Key1949) conflict-based interpretation of racial politics, we view group-based political behavior as a reflection of a group's relative political “status.” In a setting where race has played a historic social, economic, and political role, coming to hold public office has a substantial “symbolic” meaning for members of the traditionally excluded group (i.e., blacks). Political office-holding confers a certain status on group members, as a cohort that has obtained a level of political prominence. Political office-holding reduces feelings of political alienation and increases feelings of political efficacy among group members (see, e.g., Bledsoe Reference Bledsoe1986 as well as Bobo and Gilliam Reference Bobo and Gilliam1990). The same logic, with reverse consequences, is expected to apply to members of the traditionally dominant group (i.e., whites). The loss of political office translates into a decline in political influence, reflected in a loss of status and accompanying lower levels of electoral participation.
Measured as racially polarized voting, conflict will be most extreme in the context where one group is on the threshold of losing, and the competing group is on the threshold of gaining political office—i.e., in a setting where both racial groups are a sizable share of the population. The influence of race in electoral politics may be considered omnipresent, but is reflected as conflict in this particular racial context. In a different racial setting, the influence of race may manifest as accommodation.
Accommodation is manifest when one racial group is the decided majority, and is reflected in the strategic willingness of voters to cross racial lines when they are in the minority. This strategic accommodation is different from what we might think of as cooperation, however. We use the term accommodation to signify a group behavior that is less permanent than that suggested by cooperation (i.e., accommodation refers to an electoral behavior that is sensitive to changes in the population's racial distribution). Accordingly, accommodation does not signify long-term commitment to any status-quo (put another way, accommodation does not reflect a permanent shift in behavior, for instance in white voters supporting black candidates). In the setting of a large black majority, for example, white-voter support for black candidates will be a strategic necessity because white candidates will be unlikely to win election or because strong white candidates may simply be unavailable. However, if for some reason the racial makeup of the voting population changes to provide for a relatively larger white voting cohort, white candidates become viable and white-voter support for black candidates (that had previously been apparent) will evaporate. Analyses by Vanderleeuw (Reference Vanderleeuw1990) and by Liu (Reference Liu2003) have revealed the presence of accommodative voting strategies by black voters in the context of a white majority as well as by white voters in the context of a black majority, respectively.
In sum, strategic considerations enter into decisions to cross-racial vote when one racial group is in the clear majority. Such decisions reflect neither a long-term commitment to support other-race candidates nor acceptance of governance by other-race members (the racial divide is not “resolved”), and will essentially reverse with a reverse in the racial setting. Therefore with strategic accommodation what looked to be stable biracial coalitions in the setting of a decided black majority (or might have even appeared to be cooperation) will revert to polarized politics when the demographic trend in racial composition (from white to black) reverses.
We turn now to our discussion and analysis of the 2006 New Orleans mayoral election. Racial voting patterns in the 2006 New Orleans mayoral contest will tell us a good deal about the enduring influence of race in this urban political system and therefore about the process of conflict and accommodation.
Findings
If we use the 2002 mayoral runoff, which elected Ray Nagin to the mayoralty for the first time, as the baseline to study racial voting, we can analyze the strategic voting of both white and black voters in the context of a new racial transition caused by Katrina. Katrina reversed the direction of racial change in New Orleans and increased the relative political power of whites as a voting group.
The 2006 Mayoral Primary Election
The electoral context of the 2006 New Orleans mayoral primary was an increase in the potential for white political power based upon a now enlarged white electorate, a potentially weakened incumbent, a large candidate field, and voter mobilization efforts by black leaders. The primary would not produce a winner.Footnote 1 White voters would scatter their vote, and by comparison the black vote would be relatively concentrated. Nagin would survive into the runoff along with a member of a famous Louisiana political family.
As a result of Katrina, both racial groups lost registered voters.Footnote 2 The decline in black voter registration was most pronounced, however. The number of black registered voters decreased from 184,798 in the 2002 mayoral runoff (i.e., in the last mayoral election prior to 2006) to 155,681 in the 2006 primary, a decrease of 15.8%. In comparison, the number of white registered voters declined more modestly, from 94,087 in the 2002 runoff to 89,274, in the 2006 primary, a decrease of only 5.1%. Combining these two facts, we observe an increase in the relative political power of whites in the 2006 mayoral primary. Indeed, whites, who cast 35.0% of the mayoral vote in the 2002 runoff, cast 41.9% of the total 2006 primary vote. In contrast, the black share of the vote cast decreased from 61.6% in 2002 mayoral runoff to 53.2% in the 2006 primary. Because of the racial transition after Katrina, whites clearly were in a better position than they had been to challenge black domination in New Orleans politics.Footnote 3
As noted, the 2006 mayoral primary featured 22 candidates. Of these, we identified 10 as black candidates. Any concern that the black vote would fracture among black candidates was ultimately unfounded, however. Aside from Nagin, no black mayoral candidate would garner more than 1% of the primary vote. In fact, despite the large number of mayoral candidates, there was really a “top-tier” of only three or four candidates, and all top-tier challengers to Mayor Nagin were white. The strongest of these was lieutenant governor and former member of the Louisiana legislature, Mitch Landrieu. The Landrieu name is well known in Louisiana politics. Mitch Landrieu's sister, Mary Landrieu, is a U.S. senator from that state. Their father, Moon Landrieu, was two-term mayor of New Orleans from 1970 to 1978. The last white mayor of the city, Moon Landrieu was considered a liberal and had substantial support among African Americans. In fact, Moon's share of the black vote exceeded 90% in both his 1969 and 1973 mayoral elections. Two other white candidates were also considered to have a good chance at election. One of these was Ron Forman, the chief executive director of the Audubon Nature Institute, who spent lavishly in the primary and was endorsed by the city's major newspaper, The Times-Picayune. Another white candidate considered a potentially strong contender was Rob Coughig. A Republican in a traditionally Democratic city, Coughig was a lawyer and owner of the New Orleans minor league baseball team, the Sephyrs. Coughig's Republican credentials might have been something of a plus for him, given a change in racial composition in favor of whites.
Alarmed at the prospect of an election that might effectively disenfranchise African American voters who now resided outside of the city, the National Association for the Advancement of Colored People, the Association of Community Organizations for Reform Now, and the Grassroots Legal Network filed a federal lawsuit to allow physical polling places in cities such as Houston—with nearly 200,000 evacuees—and Atlanta—then home to about 42,000 New Orleans families (Brown Reference Brown2006; Morano Reference Morano2006; O'Brien Reference O'Brien2005). A U.S. District Court judge rejected the request for satellite voting outside of Louisiana, and this decision was upheld on appeal. In response, Jesse Jackson and the Rainbow/PUSH Coalition organized a protest on April 1, where thousands of civil rights demonstrators marched across New Orleans (Donze and Filosa Reference Donze and Filosa2006) and African American leaders such as Marc Morial and Al Sharpton, along with Jesse Jackson, engaged in a vigorous effort to convince evacuees to vote. ACORN, in fact, organized a bus system to offer transportation to polling stations to evacuees residing in Houston and San Antonio (Krupa, Russell, and Donze Reference Krupa, Russell and Donze2006). Although leaders such as Charles Jackson and Marc Morial expressed a sense of voter distrust for absentee ballots, as of April 9, 2006, more than 13,000 voters requested absentee ballots (600 requests on the day before), which amounts to six times the normal amount of requests for a mayoral election (Thevenot Reference Thevenot2006c). About 70% of these requests came from African American voters (Thevenot Reference Thevenot2006b).
With the primary vote tallied, no candidate received the vote majority necessary to attain victory and avoid a runoff. Of the 22 candidates, four accounted for 94% of the vote—Ray Nagin with 38.4%, Mitch Landrieu with 27.6%, Ron Forman with 17.5%, and Robert Couhig with 10.9%. Nagin's vote plurality provided him an opportunity for election victory in the subsequent runoff, as did Landrieu's second-place finish.
Nagin had won election to the mayoralty in the 2002 runoff largely due to the 86% of the white vote cast in his favor. By contrast, in the 2006 primary he received 72.9% of the vote cast by black voters but only 5.7% of the vote cast by whites. Seemingly the racial coalition that Nagin built in 2002 collapsed—white-voter support that Nagin obtained in 2002 simply evaporated in the 2006 mayoral primary. The racial makeup of Landrieu's primary vote was more racially balanced than was Nagin's. Landrieu garnered 32.9% of the votes cast by whites and 21.9% of the vote cast by blacks, which seemed to suggest that Landrieu was indeed successful in building a new biracial coalition that he promised to accomplish at a lively MSNBC-broadcasted mayoral debate on April 17, 2006. The black primary vote was more unified than was the white vote, with Nagin receiving nearly three-quarters of the black vote. By contrast, white voters apparently could not agree on which white mayoral candidate to support. Whites split their vote among the top-tier candidates—in addition to Landrieu's 32.9%, Forman received 33.1%, and Couhig obtained 21.1% of the white vote.
The 2006 Mayoral Runoff Election
Potential black political power, in the form of an increase in the relative share of the black electorate, would provide the electoral context for the 2006 New Orleans mayoral runoff. While both Nagin and Landrieu emphasized the value of cooperation across racial lines, the election ultimately would be a showcase of racial group voting power. The outcome would be the result of voting that was highly racially polarized, even by New Orleans' standards. The runoff victor, however, would benefit by relatively greater voting unity among core supporters and greater racial crossover voting.
A significant development that occurred after the primary was the extensive effort and success in registering black voters. In less than two months, the number of black registered voters increased from 155,681 to 188,485, a jump of 21.1%. The number of white registered voters increased only slightly, from 89,274 to 91,157, a movement of only 2.1%. It is important to note that the level of black registration for the 2006 runoff was in fact larger than it was for the 2002 mayoral runoff (185,798). This boost in the relative power of black voters increased Nagin's chances to secure a runoff victory, provided that he could hold onto or increase his share of the black vote relative to what he received in the primary. Nagin's runoff opponent, however, was a member of prominent political family that had traditionally received substantial support from African Americans, and in the primary Landrieu did receive almost a quarter of the vote cast by blacks. Landrieu's chances of winning election in the runoff depended upon making good on his claim that he could unite both racial groups. From an electoral perspective this meant winning the white vote along with a sizable share of the black vote.
Nagin won reelection to the mayoralty with 52.9% of the runoff vote. He received 83.3% of the black vote and 20.5% of the white vote. Although Landrieu received almost 80% of the white vote, he attracted only 17% of the black vote, a smaller share of the black vote than he generated in the primary and a share that clearly was insufficient. In addition to the failure to attract a sufficient share of the black vote, Landrieu was hurt in that blacks cast 55.6% of the total runoff vote, while the number of votes cast by whites now fell to below 40% of the total vote cast.
Characterized by voting that was racially divided, the results of the 2006 New Orleans mayoral runoff election show that black voters voted as a bloc at even a greater level than did white voters. The end result was that the 2006 mayoral runoff was one of the more racially divided elections in that city's history.
The 2002 and 2006 Mayoral Runoff Elections Compared
In 2002 Ray Nagin was the clear choice of white voters. In the 2002 mayoral runoff against a black opponent, former New Orleans chief of police Richard Pennington, Nagin garnered an impressive 86% of the vote cast by whites. By contrast, Pennington received over 60% of the black vote. Given no racial alternative among runoff candidates in 2002, Ray Nagin was the preferred candidate of white voters. Four years later he became the preferred candidate of black voters. Given a racial choice among candidates in 2006, whites abandoned Nagin; given a racial choice among candidates in 2006, blacks now overwhelmingly supported Nagin's reelection. In the following analysis we investigate changes in both racial group voting and voter turnout between the 2002 and 2006 New Orleans mayoral runoffs.
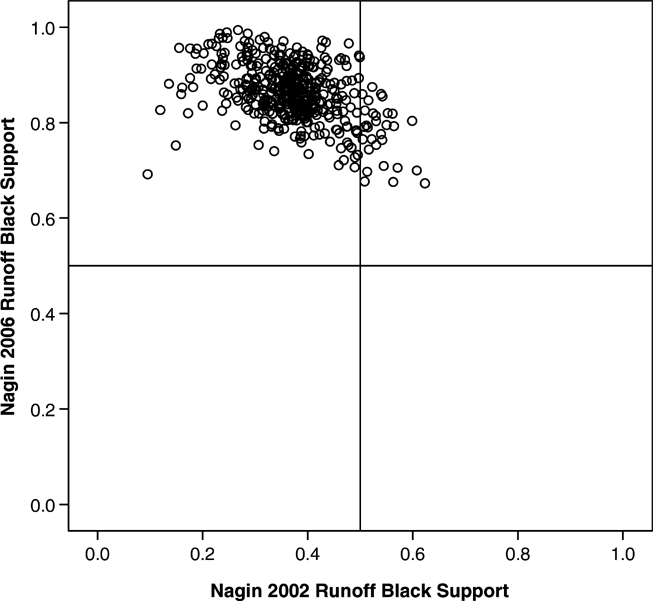
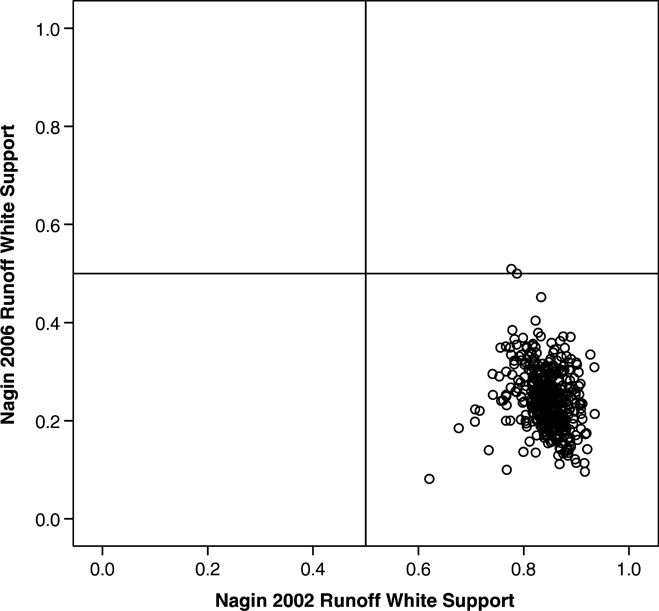
The following two figures display the level of racial vote polarization in Nagin's 2002 runoff vote and in his 2006 runoff vote.Footnote 4 Nagin's level of black-voter support is in the top left of Figure 1, which indicates that he became blacks' preferred candidate in the 2006 runoff, rather than in 2002 runoff. Moreover, the variation in his level of black support declined from 2002 to 2006—this decline is a strong indication of greater black-voter unity in 2006. Figure 2 displays just the opposite pattern regarding white-voter support for Nagin. Nagin's white support is in the bottom right of the figure, which indicates that whites clearly embraced him in the 2002 runoff, but voted against him in the 2006 runoff. This change was “universal” because there is very little variation across precincts. In other words, no matter where they lived, whites as a group overwhelmingly supported Nagin in 2002 but provided little support in 2006.Footnote 5
Black Voter Support for Ray Nagin in the 2002 and 2006 Mayoral Runoffs
Note: Nagin's black support is estimated through King's (Reference King1997) EI method (see Liu Reference Liu2006, 74, for a discussion of the method). The unit of analysis in this chart is the voting precinct. Each data point represents how blacks in a precinct voted in the 2002 runoff versus how they voted in the 2006 runoff in the same precinct. This chart reveals that blacks in most precincts provided less than 50% voting support for Nagin in the 2002 runoff (the horizontal axis). However, all the precincts provided more than 60% of the black vote for Nagin in the 2006 runoff (the vertical axis).

White Voter Support for Ray Nagin in the 2002 and 2006 Mayoral Runoffs
Note: Nagin's white support is estimated through King's (Reference King1997) EI method. The unit of analysis in this chart is the voting precinct. Each data point represents how whites in a precinct voted in the 2002 runoff versus how they voted in the 2006 runoff in the same precinct. This chart reveals that whites in most precincts provided more than 60% voting support for Nagin in the 2002 runoff (the horizontal axis). However, all the precincts provided less than 60% of the white vote for Nagin in the 2006 runoff (the vertical axis).

An analysis of voter turnout also reveals some important findings. The 2006 mayoral runoff had a city-wide turnout rate of 38.5%, which was only slightly greater than the turnout rate in the 2006 primary of 36.8%.Footnote 6 This indicates that the runoff election did not generate much more voter interest than did the primary—the increase in turnout was only 2%. The lack of substantially greater voter turnout in the runoff than in the primary may be due to the difficulty in mobilizing voters who had been relocated by Katrina, or simply that voters were not confident or interested in the city's elections in 2006.
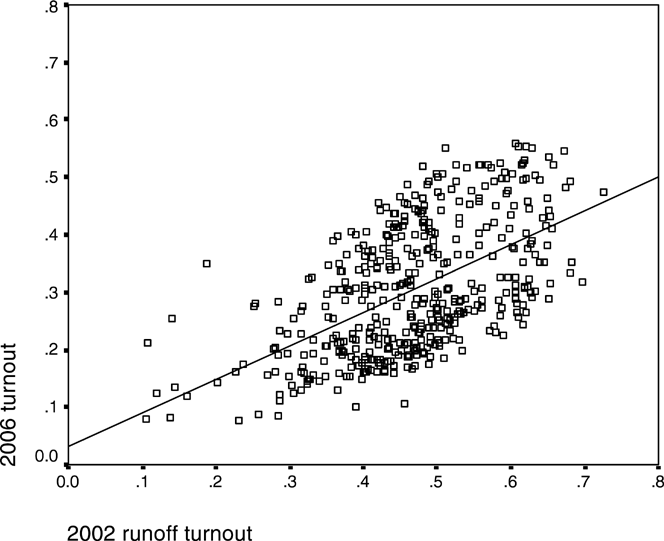
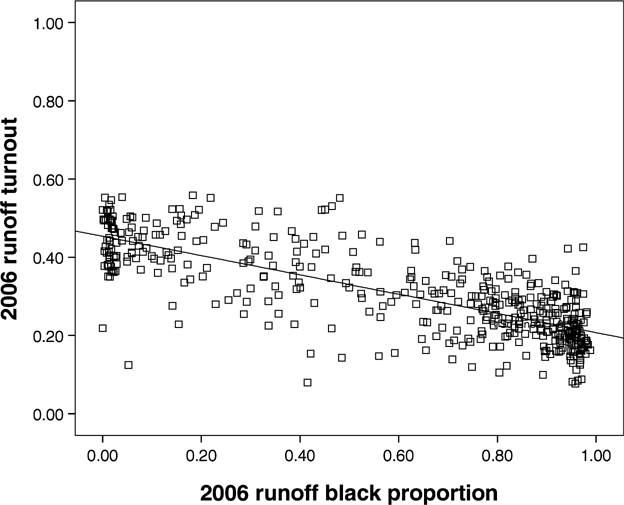
Figure 3 compares the actual (rather than estimated) voter turnout rates between the 2002 and 2006 mayoral runoff elections at the precinct level. Overall, voters cast fewer votes in 2006 than they did in 2002 across precincts (38.5% in 2006 versus 45.8% in 2002 at the city level). Figure 4 shows that the turnout rate in the 2006 mayoral runoff was lower in precincts where the proportions of black registered voters was greater: a sign that despite black mobilization and registration efforts, barriers to black participation in predominantly black areas of the city remained.
2002 vs. 2006 Mayoral Runoffs—Turnout at the Precinct Level
Note: Each data point in this chart represents a precinct's turnout rate in the 2002 runoff versus the same precinct's turnout rate in the 2006 runoff. Turnout is calculated by dividing the total number of votes cast in a precinct by the total number of registered voters in that precinct. Most data points (precincts) show a greater turnout rate in the 2002 runoff (the horizontal axis) than in the 2006 runoff (the vertical axis).

2006 Mayoral Runoff Turnout in Precincts
Note: The unit of analysis is precinct. The horizontal dimension reveals precincts' black proportion of registered voters (calculated by the total number of black registered voters divided by the total number of registered voters). The vertical dimension provides the true turnout rates in these precincts (calculated by the total number of votes cast divided by the total number of registered voters). This chart shows that as precincts' black proportion increases, the turnout rates tend to go down in the 2006 runoff.

Discussion and Conclusion
Race structures elections and election outcomes in New Orleans. It has done so historically; it continues to do so. Given the influence of race, the relative growth in white political strength—the result of population movement caused by Hurricane Katrina—facilitated a vigorous white challenge to the black mayoral incumbent in 2006. In the absence of Hurricane Katrina would Nagin have confronted the same vigorous challenge from white candidates? Our conflict and accommodation thesis predicts that there would have been less of a white challenge. In the absence of Katrina, we might have witnessed a black-on-black contest in 2006, one that reflected a division among black leaders much as was the case in 2002 with Nagin as the pro-business candidate and Pennington widely regarded as a stand-in for Marc Morial (mayor 1995–2003; there is a two-term limit for city officeholders). Alternately, as the incumbent, Nagin may have faced only relatively marginal competition, as did Marc Morial in his 1998 mayoral reelection.
If one takes a historical view about racial relations in New Orleans mayoral elections, one sees that race is an enduring social cleavage. One the one hand, overt racial appeals and the use of code words do not necessarily work, as exemplified by Peggy Wilson's 2006 candidacy and her repeated remarks about the city not needing “welfare queens” to return (Wilson, a white member of the city council first elected in 1986 from the majority white District A, obtained under 1% of the vote). On the other hand, the pronounced impact of race on New Orleans politics reveals itself through a pattern of conflict and accommodation. The past eight mayoral elections in New Orleans have produced African American mayors (in 1977, 1982, 1986, 1990, 1994, 1998, 2002, and 2006). To put the 2006 New Orleans mayoral election in perspective—the dramatic shift in racial group voter support for Nagin, from 2002 to 2006, is not the first such occurrence in the history of New Orleans mayoral elections. The mayoral elections of Sidney Barthelemy in 1986 and 1990 reveal the same pattern. Like Nagin, Barthelemy was viewed as a moderate. Barthelemy, as would Nagin, emphasized city economic growth and racial cooperation—essentially a “big tent” idea. Barthelemy, like Nagin, reflected a perspective quite different from the more obviously civil rights and conflict oriented Ernest Morial, the city's first black mayor (see Perry's Reference Perry, Browning, Marshall and Tabb2003 description of the combative governing style of Ernest Morial).
Sidney Barthelemy, the city's second black mayor, obtained substantial support from whites in his initial mayoral election bid in 1986. In the 1986 mayoral runoff Barthelemy faced African American William Jefferson. Jefferson, who was later elected to the U.S. House of Representatives, was a businessman well liked by many African Americans. Barthelemy's victory in this election with 57.7% of the vote depended on the heavy white support that he received; he garnered 88% of the white vote but only 29% of the black vote. Four years later, in the 1990 mayoral contest, Barthelemy faced strenuous opposition from white opponent Donald Mintz. As did Nagin in 2006, Barthelemy's white-voter support declined, to 22% in the primary, while his black-voter support increased, to 86% (Barthelemy won reelection in the 1990 runoff with 53.6% of the vote). Ernest Morial in 1977 and 1982 as well as his son Marc Morial in 1994 faced “strong” white opponents, and won election with the support of a unified black vote in elections that were highly polarized racially. In 1994, for example, Marc Morial won election with almost 90% of the black vote but only 7% of the white vote in a runoff against Donald Mintz.
Both Barthemy in 1990 and Nagin in 2006 faced serious white challengers and won reelection with the support of a unified black vote in racially polarized elections. The instances where the majority of white voters supported the winning black mayoral candidate have been in black-on-black mayoral contests—the 1986 and 2002 mayoral runoffs.
In the electoral arena, racial conflict can be seen in the form of racially polarized election outcomes. Accommodation can be seen in the form of high levels of racial crossover voting. Given the racial transition from white to black majority and accompanying change in elected leadership from white to black that New Orleans has experienced, our focus has been on white crossover voting for black mayoral candidates. Black mayoral candidates in New Orleans have been hard-pressed to build electoral coalitions that include a large segment of white voters. When they have been able to build such a coalition, they have been unable to maintain it. White-voter support for black mayoral candidates has been strategic—support for the more moderate candidate when there is no viable white alternative.
In sum, it is apparent that race continues to play a substantial role in New Orleans electoral politics, and the influence of race becomes manifest in mass electoral behavior as conflict or accommodation, depending upon the electoral circumstances. A key circumstance is the racial composition of the candidate field, which conditions the available choices that voters can eventually made on Election Day. Furthermore, Katrina altered another very important circumstance—the electorate's racial composition. This in turn paved the way for a vigorous white challenge to black governance.