I. INTRODUCTION
Er3+-doped LiNbO3 (Er:LN) is a promising host material for integrated optics as it combines laser property of Er3+ with excellent electro-optic, acousto-optic, and nonlinear optical properties of LN. Such an effective combination, together with the possibility of producing a high-quality waveguide of low loss, enables the broadband amplification and lasing in the telecommunication wavelength region around 1.5 μm. Since the first continuous-wave waveguide laser was reported in 1991,Reference Brinkmann, Sohler and Suche1 a family of Ti (vapor Zn)-diffused Er:LN waveguide lasers (amplifiers) and integrated devices operated in infrared regime have been demonstrated over the past years.Reference Becker, Oesselke, Pandavenes, Ricken, Rochhausen, Schreiberg, Sohler, Suche, Wessel, Balsamo, Montrosset and Sciancalepore2–Reference Schreiber, Hofmann, Grundkotter, Lee, Suche, Quiring, Ricken and Sohler10 For any practical Ti:Er:LN waveguide device, selective Er3+ doping is a prerequisite for the monolithic integration of active (optically pumped, Er3+-doped) and passive (unpumped) devices on a same substrate, to avoid reabsorption in unpumped Er-doped waveguide. This is the reason why the active ions in almost all the Ti:Er:LN devices demonstrated so far were incorporated by the local Er3+ doping, instead of the homogeneously bulk doping method.Reference Brinkmann, Sohler and Suche1–Reference Huang and McCaughan6, Reference Das, Ricken and Sohler8–Reference Schreiber, Hofmann, Grundkotter, Lee, Suche, Quiring, Ricken and Sohler10 Local Er3+ doping in an LN crystal is usually realized via thermal diffusion of Er metal or its oxide at a temperature close to the Curie point of the crystal (1142.3 ± 0.7 °C at the congruent point). The diffusion of Er3+ into a congruent (Li2O content ≈ 48.5 mol%) LN (CLN) crystal in an O2 or argon atmosphere has been studied by Caccavale et al.Reference Caccavale, Segato, Mansour, Almeida and Leite11 and Baumann et al.Reference Baumann, Brinkmann, Dinand, Sohler, Beckers, Buchal, Fleuster, Holzbrecher, Paulus, Muller, Gog, Materlik, Witte, Stolz and von der Osten12 The results show that the solubility of Er3+ ion in the crystal is limited. In a CLN crystal, the solubility is only ∼1.43 mol% at the Curie point 1142 °C.Reference Baumann, Brinkmann, Dinand, Sohler, Beckers, Buchal, Fleuster, Holzbrecher, Paulus, Muller, Gog, Materlik, Witte, Stolz and von der Osten12 Since the optical gain of a laser or an amplifier depends on the active ion concentration, the relatively low solubility of Er3+ ions in a CLN limits further demonstration of more efficient devices. The Er3+ solubility depends on not only the diffusion temperature but also the Li2O content in the crystal. Under the same diffusion temperature, the lower the Li2O content in the crystal is, the more the intrinsic defects present in the crystal are, the more the Er ions that can be accepted are, and hence the higher the Er3+ solubility would be. Indeed, the experimental results have revealed that the Er3+ solubility would be exalted by as much as 80% if the diffusion was carried out under a Li-poor atmosphere [i.e., the simultaneous work of Er3+ diffusion and Li-poor vapor transport equilibration (VTE) treatment on an initially congruent substrate],Reference Zhang, Chen and Pun13 and by at least 30% as the diffusion was performed in an initially noncongruent, Li-deficient LN.Reference Zhang, Chen, Hua, Yu and Pun14 Therefore, a locally Er-doped noncongruent, Li-deficient Ti:Er:LN waveguide is desired for the development of more efficient active devices. As an alternative, such a waveguide may be fabricated starting from a pure CLN crystal with a technological process following the sequence of (i) preparation of noncongruent, Li-deficient LN substrate by Li-poor VTE, (ii) local Er, and (iii) Ti in-diffusion in a wet O2 atmosphere. To fabricate a device with optimum performance, it is crucial to have the knowledge of the profile characteristics and diffusion properties of Er and Ti diffusers. In this work, we have attempted and succeeded in the fabrication of such waveguides. The Li2O content change after the VTE and subsequent Er doping procedures was evaluated from the measured birefringence. Secondary ion mass spectrometry (SIMS) was used to analyze the profile and diffusion characteristics of Er and Ti diffusers in the waveguide having a 8-μm-wide initial Ti-strip width. From measured profiles, the characteristic diffusion parameters such as 1/e diffusion width (for Ti only) and depth, diffusivity, and surface concentration of the Er and Ti ions are determined. The results are compared with the previously reported results on the diffusion into a congruent and a Li-deficient LN crystal.
II. EXPERIMENTAL DESCRIPTION
The fabrication of locally Er-doped noncongruent, Li-deficient Ti:Er:LN strip waveguides started from a pure CLN crystal with a technological process following the sequence of preparation of noncongruent, Li-deficient LN substrate by Li-poor VTE, local Er doping, and Ti in-diffusion in a bubbled O2 atmosphere.
A. Preparation of Li-deficient substrate by Li-poor VTE
One 1-mm-thick X-cut CLN plate with optical grade surface was used as the starting material. The plate was subjected to a Li-poor VTE treatment at 1130 °C for 140 h. After the VTE procedure, the Li2O content at the surface of the VTE-treated plate was evaluated from the birefringence measured at the crystal surface.
B. Local Er doping
Pure Er metal (99.99%) film, with a thickness of 24 ± 2 nm, was coated onto local part of one optically polished surface of the Li-poor VTE-treated plate followed by a thermal diffusion at 1130 °C for 120 h in an environment of flowing O2,bubbled through room temperature water at a rate of ∼1.5 × 10⁻³ m3/min. After the Er diffusion procedure, the surface Li2O content was characterized again.
C. Ti-diffusion
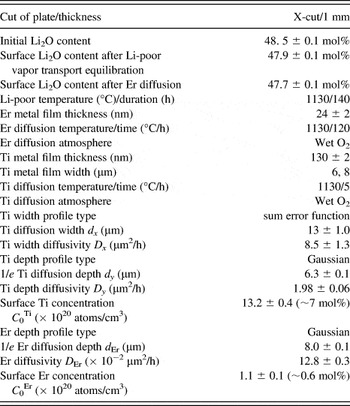
A number of Ti strips with initial widths of 6 and 8 μm were photolithographically delineated on the Er-diffused surface along the direction parallel to the optical axis of crystal. The initial Ti-strip thickness was 130 ± 2 nm. Subsequently, the Ti in-diffusion was also carried out in a wet atmosphere. The diffusion temperature was 1130 °C, and the diffusion time was 5 h. Table I brings together the preparation parameters and the surface Li2O content of the sample studied. After the Ti diffusion procedure, the profile and diffusion characteristics of Er and Ti ions were studied by SIMS.
A summary of preparation parameter and diffusion property of Er and Ti ions in locally Er-doped X-cut noncongruent, Li-deficient Ti:Er:LiNbO3 strip waveguide.

1. Li-poor VTE
The Li-poor VTE was carried out in a Li-poor atmosphere created by a closed Nb-rich two-phase (LiNbO3 + LiNb3O8) crucible at elevated temperature. The two-phase crucible was prepared by sintering homogeneous Nb-rich mixture of Li2CO3 and Nb2O5 powder, which has the same purity of 99.99%. The molar ratio was 40 mol% (Li2CO3):60 mol% (Nb2O5). The mixture was pressurized and molded into a crucible model of 6 cm in inner diameter and 4 cm in height. A precalcination at 1000 °C for 10 h and an additional calcination at 1100 °C for 1 h produced an Nb-rich two-phase crucible. The solid phase reaction involved is 40 mol% Li2CO3 + 60 mol% Nb2O5 = 40 mol% CO2↑ + 60 mol% LiNbO3 + 20 mol% LiNb3O8. The detailed Li-poor VTE procedure is described as follows. At first, the plate to be treated was wrapped with Pt wires and placed on a Pt foil, which was placed in the crucible prior to the crystal to be treated. Then, the crucible was sealed by a lid made of the same Nb-rich two-phase powder and heated up to the target temperature and dwelled for the scheduled duration. Due to the Li concentration gradient inside and outside the crystal, the Li ions inside the crystal diffused away from the crystal surface at the elevated temperature and the crystal evaporated the Li2O gas, which sunk in the two-phase powder due to the solid phase reaction Li2O↑ + LiNb3O8 = 3LiNbO3. As a result, the crystal became Li deficient more and more due to the continuous Li2O evaporation.
2. Birefringence measurement
The birefringence (i.e., the difference of ordinary and extraordinary refractive indices) of the Li-poor VTE-treated crystal was measured at the wavelengths of 632.8 and 1553 nm using a Metricon 2010 prism coupler (Metricon Corp., Pennington, NJ), which has a working principle of measurement on the critical angle of the total reflection. Note that the refractive index measured by this method should be the value at the crystal surface because the total reflection phenomenon takes place there. It is convenient to choose a transverse-magnetic polarization scheme to measure the ordinary index and a transverse-electric polarization scheme to measure the extraordinary index. The measurement was carried out at room temperature (24.5 ± 0.1 °C).
3. SIMS analysis
A time-of-flight secondary ion mass spectrometer (ToF SIMS V; ION-TOF GmbH, Münster, Germany) was used to map the surface profile of Ti ions and analyze the depth profiles of all of the substrate ions 6Li, 93Nb, 16O, and the diffused ions 166Er and 48Ti in the 8-μm-wide waveguide defined on the studied sample. The surface profile was obtained by doing surface mapping with a raster size of 178 × 178 μm2. For the depth analysis, a Cs+ beam (∼45 μm in diameter) of 42 nA at 3 keV was used to sputter a crater of 120 × 120 μm2, and a pulsed bismuth ion beam with an energy of 25 keV was used to analyze the secondary ions of 6Li, 93Nb, 16O, 166Er, and 48Ti as a function of time. Positive secondary ions were detected. Ions from a central area of 23.4 × 23.4 μm2 inside the erosion crater were detected. A low-energy pulsed electron gun was used to degrade the surface charge accumulation during the analysis. For the same purpose, before the SIMS analysis a 30-nm-thick Au film was coated onto the sample surface to be analyzed. The trace and the depth of erosion crater were measured by a Tencor Alpha Step 200 profilometer (KLA-Tencor Corp., Milpitas, CA). The depth resolution was mainly determined by the roughness of the crater under analysis and was better than 5 nm in our case.
III. RESULTS AND DISCUSSION
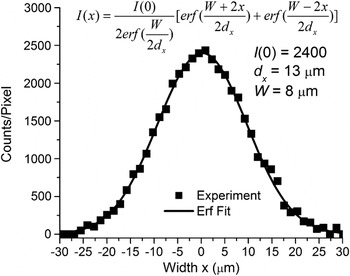
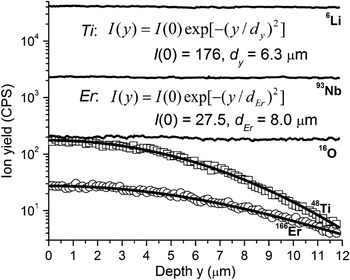
Figure 1 shows the Ti concentration profile (full squares) mapped from the 8-μm-wide waveguide surface. Figure 2 shows, in a semilogarithmic scale, the depth profiles of 6Li (solid line), 93Nb (solid line), 16O (solid line), 48Ti (open square), and 166Er (open circle) SIMS signals detected from the same waveguide as that used for the surface mapping. Note that the Ti and Er profiles given in Fig. 2 have been normalized to the Nb signal, so that the possible influence arising from the fluctuation of primary Cs+ beam can be degraded somewhat. For convenience, we consider an x–y Cartesian reference frame fixed at the center of the waveguide surface with the x-axis along the width direction and the y-axis pointing to the depth direction of the studied waveguide.
Surface 48Ti profile (full squares) of the 8-μm-wide noncongruent, Li-deficient Ti:Er:LN strip waveguide. The solid line represents the fitting result. The fitted expression and parameter values are indicated.

Depth profiles, in a semilogarithmic scale, of 6Li (solid line), 93Nb (solid line), 16O (solid line), 48Ti (open square), and 166Er (open circle) secondary ion mass spectrometry (SIMS) signals detected from the 8-μm-wide noncongruent, Li-deficient Ti:Er:LN strip waveguide. The solid line overlapped on the measured Ti or Er profile represents the fitting result. The fitted expression and parameter values are indicated.

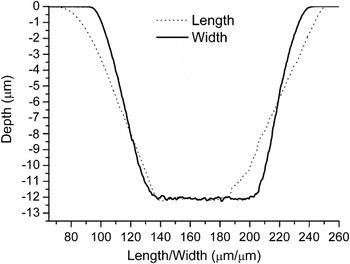
Since the concentration profiles of the substrate constituents 6Li, 93Nb, and 16O are homogeneous inside the crystals, their SIMS signals should be depth independent. Indeed, one can see from Fig. 2 that all these substrate signals show constancy with the depth during the analysis, implying that the charge compensation by the electron gun is effective. Nevertheless, the profiles need to be further justified by checking if the detecting area (23.4 × 23.4 μm2) is affirmatively smaller than the flat area at the bottom of the rastered crater. Figure 3 shows the traces profiled along the length (dotted) and the width (solid line) direction of the crater rastered on the studied strip waveguide surface. Due to the effects of size and inclining incidence of the primary Cs+ beam, the opening window of the crater extends to about 180 (length) × 150 (width) μm2. The crater along the length direction has a larger opening size than along the width direction. As the crater is rastered deeper, its size becomes smaller and smaller due to incompletely eliminated charge shielding effect. Nevertheless, the area of flat bottom is still considerably larger than the detecting area. One can see from Fig. 3 that the crater has a flat bottom area of at least 45 × 60 μm2, which is considerably larger than the detecting area of 23.4 × 23.4 μm2. Thus, the experimental data shown in Fig. 2 reflect the practical scenario of the diffusion profiles and all results inferred are sound. In the following, we discuss the profile and diffusion characteristics of Ti and Er diffusers separately.
Profilometer traces along the length (dotted) and the width (solid line) direction of the crater sputtered on the strip waveguide surface of the sample studied.

A. Ti diffusion
First of all, let us focus on the Ti concentration profile in the waveguide studied. It is well known that for a usual congruent Ti:LN strip waveguide fabricated under the standard Ti diffusion condition (∼100 nm thick Ti strip/1030–1060 °C/∼9 h), the Ti concentration profile in the width direction of waveguide follows a sum of two error functions, given by

where C Ti(x,y) represents the two-dimensional (2D) profile of Ti concentration; W and dx represent the initial Ti-strip width and diffusion width, respectively; and C 0 [= C Ti(x=0,y=0)] denotes the Ti concentration at the waveguide surface. Equation (1) has been used to fit the measured surface Ti concentration profile in Fig. 1. The solid line represents the fitting result. The fitted expression and parameter values are indicated. One can see that the fitted curve covers well the experimental data, indicating that the traditional surface profile of Ti concentration described by Eq. (1) is still valid for the waveguide studied here. The fitted parameter value indicates that the Ti diffusion width dx has a value similar to 13 ± 1.0 μm, which yields a surface Ti diffusivity value of 8.5 ± 1.3 μm2/h.
In the depth direction of a usual congruent Ti:LN waveguide, the Ti concentration profile follows two possible trial functions (This is also the case for other diffusers including the Er studied here.). When the diffusion time is shorter than the moment of time when the diffusion reservoir is exhausted, the Ti concentration along the depth direction of waveguide obeys to an error function complement. As the diffusion time is increased, the Ti ions penetrate deeper and the surface Ti concentration decreases. In this case, the Ti concentration along the depth direction follows a Gaussian trial function. It is found that the measured Ti depth profile shown in Fig. 2 can be well fitted by a Gaussian trial function:

where I(y) represents the yield of secondary Ti ions and dy denotes the 1/e diffusion depth. The good Gaussian fit indicates that the Ti diffusion reservoir was exhausted. The fitted result is plotted by the solid line in Fig. 2. The fitted expression and parameter values are indicated. Based upon Eq. (2), the Ti concentration profile along the diffusion depth direction can be expressed as

The diffusion depth dy is similar to 6.3 ± 0.1, yielding a depth diffusivity of 1.98 ± 0.06 μm2/h.
On the basis of the area under the measured Ti depth profile, the surface Ti concentration can be determined by the aid of the law of mass conservation. Since the measured Ti depth profile is well fitted by a Gaussian function, it is more convenient to determine the surface Ti concentration C 0 by utilizing the fitted expression given by Eq. (3). By applying the law of mass conservation to Eq. (3), we have

The surface Ti concentration C 0 is then given by

where τ, ρ, N A, and M represent the initial Ti film thickness (130 nm), mass density of Ti metal (4.52 g/cm3), Avogadro’s number (6.02 × 10²³ atoms/mol), and molecular weight of Ti (47.9 g/mol), respectively. With the known 1/e Ti diffusion depth dy, one can find that the surface Ti concentration C 0 is similar to (13.2 ± 0.4) × 1020 atoms/cm3, which is equivalent to ∼7 mol% (The concentration of Nb5+ in an LN crystal is similar to 1.85 × 10²² atoms /cm3.). Table I collects all of the characteristic Ti diffusion parameters.
By combining Eqs. (1) and (3), a 2D Ti concentration profile in the strip waveguide studied can be constructed as

It is essential to correlate present Ti diffusivity data with the previously reported composition effect.Reference Holmes and Smyth15 Before the correlation, it is necessary to pay attention to the surface Li2O content change of the studied sample after the VTE and Er diffusion procedures. Here, the optical method of birefringence measurementReference Wöhlecke, Corradi and Betzler16, Reference Schlarb and Betzler17 was used to evaluate the Li2O content at the studied crystal surface. The results are collected in Table I. The measurement error of refractive index (within ± 10−3) yields a Li2O content uncertainty of 0.1 mol%. One can see that the starting congruent crystal plate, as expected, has a Li2O content of 48.5 ± 0.1 mol%. After the Li-poor VTE procedure, the surface Li2O content decreases to 47.9 ± 0.1 mol%. Although measure has been taken for suppressing Li2O out-diffusion, the subsequent Er diffusion procedure still results in further Li2O content decrease to 47.7 ± 0.1 mol% due to the Li2O out-diffusion. This means that our Ti diffusion was carried out on a Li-deficient substrate having a Li2O content of ∼0.8 mol% lower than the congruent point.
Next, we discuss the composition effect on Ti diffusivity. For an X- or Y-cut CLN, the bulk Ti diffusivity at 1130 °C ranges from 1.2 to 1.6 μm2/h.Reference Holmes and Smyth15, Reference Sugii, Fukuma and Iwasaki18–Reference Noda and Fukuma20 Obviously, the bulk Ti diffusivity in the Li-deficient substrate studied here, ∼1.98 μm2/h, is definitely larger than that in a congruent material and shows definite crystal composition effect. In the previous work, Holmes and SmythReference Holmes and Smyth15 have studied the diffusion characteristics of Ti-diffused planar waveguide fabricated on substrates having different initial compositions and reported the crystal composition effect on the Ti diffusivity. It can be evaluated from their activation energy and diffusion constant data that the value of diffusivity at 1130 °C is around 2.0 μm2/h for an X-cut substrate having a Li2O content around 48 mol%. Such a diffusivity value is in reasonable agreement with the 1.98 μm2/h bulk diffusivity data of this work.
Earlier study revealed that Ti diffusion along the surface of an X-propagating strip waveguide on a Y-cut congruent substrate is nearly one order of magnitude faster than the corresponding diffusion into the bulk.Reference Noda and Fukuma20, Reference Sjöberg, Arvidsson and Lipovskii21 The diffusion here reveals a similar feature. We note that the surface Ti diffusivity, ∼8.5 μm2/h, is at least four times larger than the bulk diffusivity.
B. Er diffusion
It is found that the measured Er profile can be well fitted also by a Gaussian trial function. The fitted result is plotted by the solid line in Fig. 2. The fitted expression and parameter values are indicated. One can see from the fitted expression that the Er concentration profile can be described by an expression similar to Eq. (3). Since the measured Er depth profile follows a Gaussian function, the diffusion time adopted (125 h in total = Er diffusion time + Ti diffusion time) is thus longer than the depletion time. Like the Ti diffusion case, the Er diffusion reservoir was exhausted also. This is clearly shown in Fig. 2, where the fitted Er plot covers well the corresponding measured one near the waveguide surface. (If the diffusion reservoir was unexhausted, the resultant profile follows a complementary error function instead of the Gaussian function, the fitted and the measured plots show definite misfit near the crystal surface and the measured ion yield is larger than the predicted there due to unexhausted reservoir.) The 1/e diffusion depth d Er is similar to 8.0 ± 0.1 μm, yielding an Er diffusivity of (12.8 ± 0.3) × 10−2 μm2/h. Since the Er diffusion consists of two stages (i.e., the initial Er diffusion procedure and the subsequent Ti diffusion procedure), the Er diffusivity value here should be considered as the averaged result of the two diffusion procedures. Earlier studies on Er diffusion into a CLN crystal have shown that at 1130 °C the Er diffusivity in an X-cut substrate falls into the value range of 0.03–0.04 μm2/h reported by Caccavale et al.,Reference Caccavale, Segato, Mansour, Almeida and Leite11 which is similar to ∼0.07 μm2/h reported by Sohler research group.Reference Baumann, Brinkmann, Dinand, Sohler, Beckers, Buchal, Fleuster, Holzbrecher, Paulus, Muller, Gog, Materlik, Witte, Stolz and von der Osten12 One can see that the value of Er diffusivity here is considerably larger than the value of the diffusion in the congruent material.
The surface Er concentration was further determined. On the basis of law of mass conservation and the fitted Gaussian expression, an equation similar to Eq. (5) can be obtained again. With the known 1/e Er diffusion depth (8.0 ± 0.1 μm), initial Er film thickness (24 ± 2 nm), mass density of erbium metal (9.06 g/cm3), and molecular weight of Er metal (166 g/mol), one can obtain a surface concentration similar to (1.1 ± 0.1) × 1020 atoms/cm3, which corresponds to ∼0.6 mol% and is nearly equal to that of the usual Ti:Er:LN waveguide devices fabricated on a congruent material, ∼1 × 10²⁰ atoms/cm3.Reference Baumann, Bosso, Brinkmann, Corsini, Dinand, Greiner, Schäfer, Söchtig, Sohler, Suche and Wessel22 Table I collects all of the characteristic Er diffusion parameters.
It is no doubt that the diffusivity increase (relative to the diffusion in the congruent material) of both Ti and Er in the substrate studied in this work is due to the reduction of Li2O content in the crystal arising from both the initial Li-poor VTE process and the subsequent Er3+ diffusion procedure, during which period the Li2O out-diffusion phenomenon has taken place. As the Li2O content in the crystal lowers, more intrinsic defects, like the antisite (NbLi)4+ (Nb5+ on Li+ site) and the Li vacancy (VLi) required by charge equilibrium, are generated in the crystal. It has been suggested that the diffusion takes place through the easiest path via vacant cation sites and the structural octahedral vacancies.Reference Baumann, Brinkmann, Dinand, Sohler, Beckers, Buchal, Fleuster, Holzbrecher, Paulus, Muller, Gog, Materlik, Witte, Stolz and von der Osten12 It is thus comprehensive that both Ti and Er diffusivities in the substrate studied in this work increase as compared to the diffusion in the congruent material.
Regarding the Li-deficient waveguide studied in this work, there are two issues to be clarified. The first issue involves the surface Er concentration of the waveguide. As demonstrated above, the Er concentration on the surface of the waveguide studied here, ∼0.6 mol%, does not promote much in comparison with that of the usual Ti:Er:LN waveguide devices fabricated on a congruent material, ∼0.5 mol%. This is not contradictory to our research objective of promoting the surface Er concentration. For the usual Ti:Er:LN waveguide device, the Er diffusion depth is usually ∼5 μm.Reference Becker, Oesselke, Pandavenes, Ricken, Rochhausen, Schreiberg, Sohler, Suche, Wessel, Balsamo, Montrosset and Sciancalepore2, Reference Baumann, Bosso, Brinkmann, Corsini, Dinand, Greiner, Schäfer, Söchtig, Sohler, Suche and Wessel22 For the waveguide studied here, however, the Er diffusion depth reaches 8 μm. It is no doubt that the Er depth can be readily reduced to the usual ∼5 μm by adjusting the Er diffusion parameters such as simply shortening the diffusion duration to 80 h. In this case, according to the law of mass conservation, the surface concentration can be promoted to ∼1 mol%, which is nearly doubled the value of the usual Ti:Er:LN waveguide device fabricated on a congruent material. With strengthened Li-poor VTE condition and/or increased initial Er metal thickness, higher surface Er concentration is expected.
The second issue involves the crystal composition effect on both the conformity of ferroelectric domain and the electro-optic coefficient. It is well known that the Curie temperature (T c) of the LN crystal (1142.3 ± 0.7 °C at the congruent point) is closely related to the Li2O content inside the crystal ([Li2O]), and both follow the linear relation T c = 39.064 [Li2O]–746.73.Reference Bordui, Norwood, Jundt and Fejer23 From this expression, one can judge that the crystal studied in this work has a T c below the diffusion temperature we adopted, 1130 °C. This implies that the ferroelectric domain in the crystal orients no longer conformably but randomly. Moreover, as the crystal composition decreases, the electro-optic effect of crystal degrades. These two problems would be solved by carrying out further Li compensation (via Li-rich VTE process) and then the uniform ferroelectric poling treatment on the whole plate.
IV. CONCLUSION
We have demonstrated by SIMS analysis the diffusion properties of Ti and Er ions in locally Er-diffused, noncongruent, Li-deficient Ti:Er:LN strip waveguide fabricated on an X-cut initially congruent undoped substrate in sequence by preparation of noncongruent, Li-deficient LN substrate by Li-poor VTE treatment on a congruent substrate, local Er doping and Ti in-diffusion all in wet O2 atmosphere. The results show that the Li-poor VTE procedure resulted in ∼0.6 mol% reduction and the subsequent Er diffusion procedure resulted in further ∼0.2 mol% reduction of Li2O content. Both the Ti and Er diffusion reservoirs were exhausted under the diffusion condition adopted. As expected, the Ti profile follows a sum of two error functions in the width direction and a Gaussian function in the depth direction of waveguide. The surface and depth Ti diffusivities are similar to 8.5 ± 1.3 and 1.98 ± 0.06 μm2/h, respectively. The value of depth diffusivity is definitely larger than that in a congruent material due to Li2O content reduction in crystal and is in good agreement with the previously reported crystal composition effect. The surface diffusion is at least four times faster than the depth diffusion, which is in qualitative agreement with the case of diffusion in a congruent material.
Er profile follows also a Gaussian function with a larger 1/e depth of 8.0 ± 0.1 μm. The Er diffusivity is similar to (12.8 ± 0.3) × 10−2 μm2/h, which is considerably larger than that of the diffusion in the congruent material. Although the surface Er concentration, ∼0.6 mol%, does not exalt much in comparison with that of a usual Ti:Er:LN waveguide device fabricated on a congruent material, it will be doubled by simply shortening the diffusion duration to 80 h. And with strengthened Li-poor VTE condition and/or increased initial Er metal thickness, higher surface Er concentration is expected.
ACKNOWLEDGMENTS
This work was supported by the National Natural Science Foundation of China under Project Nos. 50872089, 61077039 and 61107056, by the Key Program for Research on Fundamental to Application and Leading Technology, Tianjin Science and Technology Commission of China under Project no. 11JCZDJC15500, and by Specialized Research Fund for the Doctoral Program of Higher Education of China under Project no. 20100032110052.