Implications
A dietary deficiency of Fe in humans and young animals would clearly be expected to affect the formation of haemoglobin. Anaemia is connected with various diseases, subnormal growth and production and higher mortality. Fe deprivation can be treated by intramuscular injection as a dextran complex or gleptoferron. Alternatively, oral Fe supplements are available. However, many inorganic supplements contain Fe in poorly available forms. Fe-enriched yeast biomass, containing Fe in an organic form, when used as feed or food supplement could provide a more efficient alternative to inorganic supplements because of its higher Fe bioavailability.
Introduction
The essentiality of Fe has been known since ancient times and its beneficial effect on blood formation was recognised early in the 17th century (Underwood, Reference Underwood1956). Fe deficiency is the most prevalent and severe nutritional disorder worldwide, affecting more than two billion people. The most widely recognised symptom is anaemia, in which the production of red blood cells is reduced, and the body is deprived of oxygen needed for energy metabolism. Fe plays an essential role in many biochemical reactions, and its ability to accept or donate electrons is central to redox reactions of oxidative phosphorylation in the respiratory chain.
There is extensive literature on factors influencing the absorption of Fe. This is influenced by total body Fe stores, when the functional Fe compartment is replenished and mobilisable Fe is accumulated in ferritin stores. The quantity of Fe absorbed drops to a level just sufficient to cover basal losses in order to avoid excessive deposition of Fe (Hallberg et al., Reference Hallberg, Hulten and Gramatkovski1997). Fe balance is maintained through changes in the efficiency of absorption, whereby absorption is regulated to redress Fe deficit. Also important is the interaction of Fe with other components of the diet and bacteria in the gastrointestinal tract, as well as physiological alterations of intestinal mucosal cells, because dietary Fe is absorbed in the mucosal cells of the duodenum and jejunum, after ferric Fe is reduced to the ferrous form (Miret et al., Reference Miret, Simpson and McKie2003). The bioavailability of Fe from the same feed can vary for different species (Henry and Miller, Reference Henry and Miller1995). Fe absorption decreases with increasing age of the animal and changes rapidly when animals are changed from one diet to another (Rogers, Reference Rogers1979).
Although the availability of Fe is influenced by many factors such as ascorbic acid, phytate, protein source, pectin, other minerals and feed processing, the form in which Fe is present has the greatest influence on bioavailability (Rogers, Reference Rogers1979). Fe in nature may be present in the organic or inorganic form. The inorganic form is the one that is most frequently used as a supplement to animal feeds. Relatively high bioavailability of Fe from different forms of ferrous sulphate, ferric chloride, ferric citrate and ferric ammonium citrate has been reported; however, bioavailability of Fe from ferrous carbonate was quite variable and from ferric oxide it was unavailable (McDowell, Reference McDowell1992). Fe chelates (ferrous bis-glycineate) have the greatest promise for fortifying food supplies, because some of them are less susceptible to Fe absorption inhibitors than Fe salts (Miller, Reference Miller2002). One possible organic Fe supplement could be Fe-enriched yeast biomass, where yeast cells have accumulated Fe from Fe (III) citrate (inorganic salt) in their biomass to about 34 mg of Fe per g of dry matter (Paš et al., Reference Paš, Piškur, Šuštarič and Raspor2007).
Studies on Fe absorption and retention can be carried out in animals deficient in Fe or in animals given a large amount of Fe to saturate Fe body stores (Hallberg et al., Reference Hallberg, Hulten and Gramatkovski1997). The present study was designed to investigate the effects of different levels of Fe from yeast biomass on the bioavailability and liver storage of Fe in laboratory rats.
Material and methods
Diets
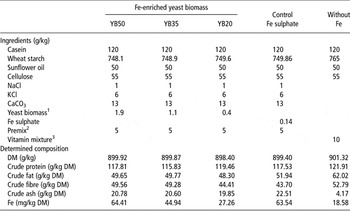
Diets (Table 1) were prepared in order to meet the nutritional requirements of growing rats (NRC, 1995), except the Fe content in one diet, which has to be in accordance with NRC (1995), that is, 35 mg/kg of diet. Diets were prepared with different levels of Fe-enriched yeast biomass: a calculated amount of 20 mg of Fe per kg of diet (YB20), 35 mg of Fe per kg of diet (YB35) and 50 mg of Fe per kg of diet (YB50). The inorganic level of Fe was 50 mg per kg of diet in the form of Fe sulphate (Fe-sulphate), which is the level recommended by NRC (1995).
Composition (g/kg) of experimental diets and chemical composition (g/kg DM) of the diets

DM = dry matter; YB50 = yeast biomass with calculated amount of 50 mg of Fe; YB35 = yeast biomass with calculated amount of 35 mg of Fe; YB20 = yeast biomass with calculated amount of 20 mg of Fe; Fe sulphate = Fe sulphate, inorganic Fe, with calculated amount of 50 mg of Fe; Without Fe = without addition of any mineral component.
1Fe enriched yeast biomass (26.8 g Fe/kg dry matter, 890 g DM).
2Specially prepared mineral–vitamin mixture for laboratory rats without Fe (Lek veterina) – vitamins (IU/kg or mg/kg): 467 000 IU A, 200 000 IU D3, 3600 mg E, 200 mg K3, 800 mg B1, 600 mg B2, 3000 mg B3, 2000 mg Ca-pantothenat, 1200 mg B6, 10 mg B12, 200 mg folic acid, 40 mg biotin, 150 000 mg choline; minerals (mg/kg): 30 mg I, 2000 mg Mn, 2400 mg Zn, 30 mg Mo, 1000 mg Cu, 30 mg Se).
3Vitamin mixture for laboratory rats – vitamins (g/0.5 kg): 1 g A, 0.22 g D3, 12 g E, 0.48 g K3, 1.1 g B1, 1.38 g B2, 5.01 g niacin, 3.3 g Ca-panthotenat, 1.1 g B6, 1.5 g B12, 1.0 g folic acid, 1.1 g biotin, 297.67 g choline.
Animals, experimental procedure and sampling
All the procedures were performed according to the current legislation on animal experimentation in Slovenia. Permission for the experiment was granted by the Veterinary Administration of the Republic of Slovenia under number 323-02-239/2005/2. Sixteen male Wistar rats (104.4 g ± 10.0 g BW) were individually housed in metabolic cages placed in a room maintained approximately at 21°C and 60% humidity (checked and recorded each day), with light automatically regulated on a 12-h light/dark cycle starting at 0700 h. Rats were randomly allocated into four equal groups (n = 4): control and three groups with different addition of Fe-enriched yeast biomass. Animals had continuous free access to drinking water. Metabolic cages permitted the collection of urine and faeces separately during the experiment. They received ad libitum control or enriched yeast biomass diets during a 10-day period, of which the first 5 days were a pre-experimental period and then 5 days of experimental (balance) period. Each day, the animals received a new weighed daily meal and the residue from the day before was weighed. BW of the rats were recorded on the first day of the balance experiment, on the third day and on the last day. Urine was collected in a bottle after filtration. The bottle contained 10 ml of 6 M HCl to stop all reactions in the urine and to prevent loss of nitrogen. The faeces samples were collected in a different vessel. On the last day (5th) of the balance study, the urine was transferred to a prepared plastic bottle, weighed and stored at −20°C until analyses were performed. Faeces samples were also stored in prepared plastic bottles, weighed and frozen.
On the last day of the experiment, the rats were asleep in a CO2 chamber, the abdominal wall cut and the whole liver dissected, wiped in paper, weighed and stored at −20°C until analyses were performed.
Second experiment
The second experiment was performed in order to calculate the endogenous and metabolic losses of Fe. A total of 12 growing male Wistar rats (98.9 g ± 2.4 g BW) were also housed in individual metabolic cages, with free continual access to water and food. The conditions in the room and cages and all the procedures with the animals were the same as in the first experiment, except the fact that the experiment lasted for 19 days, with 13 days of pre-experimental period in order to ensure that the animals use stored Fe. The diet was prepared in order to meet total nutritional requirements for laboratory rats (NRC, 1995), except for minerals (Table 1). The vitamin mixture was prepared in the laboratory according to the recommendation of NRC (1995).
Chemical analyses
Crude protein (Kjeldahl nitrogen × 6.25), crude fibre, crude fat and crude ash were determined in the diet samples by procedures described in Methodenbuch (1976, 1988 and 1993). Before taking an aliquot of the sample of faeces for analysis, it was homogenised in a ceramic holder; urine was homogenised by shaking to prevent stratification. In faeces and urine, nitrogen content was also determined by the Kjeldahl method. Fe was determined in the diets and faeces after ashing and preparation of an acid extract by atomic absorption spectrometry. In urine, Fe was determined after microwave digestion (Milestone microwave laboratory systems, Sorisole (BG), Italy). A measure of 2.5 g of homogenised urine sample was placed in a vessel and 8 ml of 65% HNO3 was added. The plate with vessels was placed in the microwave cavity, the temperature sensor was connected and the programme was run. After completion of the programme, the solution was cooled to room temperature and transferred to a marked flask. The Fe concentration in the clear solution was determined by atomic absorption spectrometry (Parkin Elmer, 1100 B atomic absorption spectrophotometer at the following parameters: λ = 248.7, slite 0.2, technical acetylene φ1.9 l/min and air φ6.8 l/min).
The Fe content was also determined in samples of liver. An aliquot of approximately 0.25 g of liver was placed in a microwave vessel (Milestone microwave laboratory systems), 6 ml of 65% HNO3 and 2 ml of 30% H2O2 were added and the microwave programme was run. After cooling to room temperature, the solution from the vessel was transferred to a marked flask and the Fe concentration was determined by atomic absorption spectrometry.
On the basis of the Fe intake, Fe in faeces and in urine, the following indices of Fe utilisation were calculated: Fe balance = Fe intake – (Fe in faeces + Fe in urine); apparent Fe digestibility = (Fe intake – Fe in faeces)/Fe intake and apparent Fe bioavailability = (Fe intake – (Fe in faeces + Fe in urine))/Fe intake.
Data analysis
Data were analysed by the General Linear Models (GLM) procedure (SAS Institute Inc., Cary, NC, USA), taking into consideration the diet as the main effect. Data were expressed as least square means ± s.d. If not stated otherwise, significance was considered established at P < 0.05.
Results
Differences in the chemical composition of the diets were obtained for the Fe content, which was to be expected, because the addition of the Fe-enriched component was different (Table 1). The amount of addition was not totally in accordance with the calculated values; however, the differences were sufficient to compare the effect of Fe form and concentration in the diet on digestion and metabolism. The level of Fe-sulphate and the highest level of Fe from yeast biomass (YB50) were comparable (Table 1).
In the last column of all the tables, the values from the second experiment are presented, in which no minerals were added to the diet in order to find the base level of Fe in the diet without any addition. According to the laboratory analysis, a level of 18.58 ± 5.28 mg of Fe was already present in the diet without any mineral addition (Table 1).
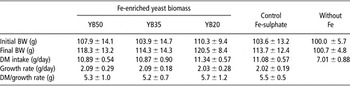
Table 2 shows that the origin of Fe and the amount of Fe in the diet had no effect on growth performance (growth rate, dry matter intake and dry matter intake per g of growth rate). When no minerals were added to the diet, rats had almost the same body mass at the end of experiment as at the beginning.
BW, DM intake and growth rate (mean ± s.d.) in 5 days balance measurement

DM = dry matter; YB50 = yeast biomass with calculated amount of 50 mg of Fe; YB35 = yeast biomass with calculated amount of 35 mg of Fe; YB20 = yeast biomass with calculated amount of 20 mg of Fe; Fe sulphate = Fe sulphate, inorganic Fe, with calculated amount of 50 mg of Fe; Without Fe = without addition of any mineral component.
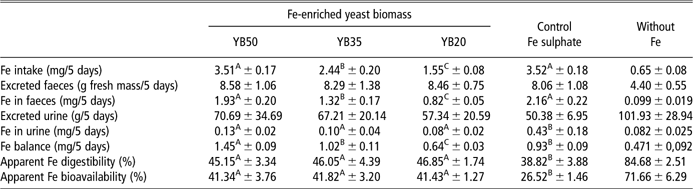
Rats on each treatment consumed significantly different (P < 0.01) amounts of Fe (Table 3), because there were different levels of Fe present in the diets; however, the animals consumed similar amounts of diet. The masses of excreted faeces and urine in different groups were not different; however, the Fe excreted through faeces was in the same order as the concentration of Fe in the diets. The largest amount of Fe was excreted in the group with inorganic Fe (Fe-sulphate) and in the group with the highest level of Fe from yeast biomass (YB50). A significantly lower amount of excreted Fe was found in the group with medium levels (YB35) of Fe in the diet, and the lowest amount of excreted Fe through faeces was found in the group with the lowest level (YB20) of Fe in the diet (Table 3). All three groups with Fe added from yeast biomass excreted similar amount of Fe in urine; however, rats in the control group (Fe-sulphate) excreted a highly significantly (P < 0.01) larger amount of Fe. The conclusion from these results was a better apparent Fe digestibility and better apparent Fe bioavailability in all three groups with addition of Fe from yeast biomass compared with the control inorganic Fe group. In the last group with no addition of Fe (mineral) in the diet, the apparent Fe digestibility and apparent Fe bioavailability were much better than in the groups of the first experiment. This result is the consequence of the very low amount of Fe excreted in the faeces and in the urine, and the low Fe intake with diet. The amount of faeces excreted was approximately half of the other groups; however, the excretion of urine was greater.
Balance experiment, Fe digestibility and Fe bioavailability (mean ± s.d.)
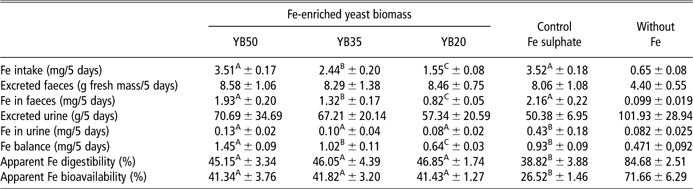
YB50 = yeast biomass with calculated amount of 50 mg of Fe; YB35 = yeast biomass with calculated amount of 35 mg of Fe; YB20 = yeast biomass with calculated amount of 20 mg of Fe; Fe sulphate = Fe sulphate, inorganic Fe, with calculated amount of 50 mg of Fe; Without Fe = without addition of any mineral component.
A,B,CMeans with different superscripts are significantly different at P < 0.01.
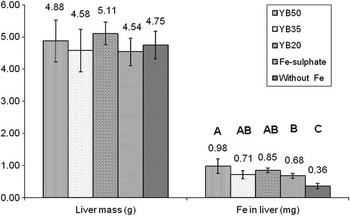
Similar to body mass at the end of experiment, the mass of the liver also was not different among the groups; however, the level of Fe in the diet made some differences to the level of Fe in the liver. The significantly largest (P < 0.01) amount of Fe in the liver was found in the group with the largest amount of Fe-enriched biomass in the diet (Figure 1). The concentration of Fe in the liver represented approximately 0.02% of the liver in the group with the highest amount of Fe-enriched biomass in the diet, whereas in the other three groups it was between 0.015% (Fe-sulphate), 0.016% (YB35) and 0.017% (YB20). In the group without any addition of minerals, the level of Fe was decreased to the level of 0.0076%.
Mass of liver and concentration of Fe in the liver (YB50 = yeast biomass with calculated amount of 50 mg of Fe; YB35 = yeast biomass with calculated amount of 35 mg of Fe; YB20 = yeast biomass with calculated amount of 20 mg of Fe; Fe-sulphate = Fe sulphate, inorganic Fe, with calculated amount of 50 mg of Fe; Without Fe = without addition of any mineral component). A,B,CMeans with different letters are significantly different at P < 0.01.

Discussion
The premix containing minerals and vitamins for the diets was prepared without the addition of any Fe. When we determined the base level of Fe in the diets before the addition of Fe-enriched yeast biomass or Fe-sulphate, the concentration of Fe in the diets from the ingredients was found to be between 11.37 and 18.85 mg/kg of diet. Small amounts of Fe were present in casein (14.50 mg/kg), wheat starch (5.86 mg/kg) and cellulose (14.26 mg/kg), a higher amount in limestone (CaCO3 – 110.65 mg/kg) and in the prepared premix with no addition of any Fe component (602.75 mg/kg). Thus, Fe is present in the feed ingredients and it is impossible to prepare diets without any Fe. Therefore, the addition of Fe from Fe-enriched yeast biomass did not represent the total Fe in the diet, but only the addition that was needed to reach the calculated level for the experiment. Nevertheless, the results clearly showed that the Fe from enriched yeast biomass was better available than inorganic Fe in the form of Fe-sulphate, because the digestibility and bioavailability of Fe in all groups of Fe-enriched biomass were better as compared with the inorganic Fe. In a review by Josephs (Reference Josephs1958), it was stated that inorganic Fe supplementation is a more effective way of increasing Fe retention than Fe in the form of vegetables (organic Fe). On the other hand, Fe of plant origin is more readily absorbed than non-haeme Fe of animal origin, because this protein-bound compound must be released before absorption (Morris, Reference Morris1987).
The animal or human body normally regulates Fe absorption to replace the unavoidable Fe losses. The absorption or bioavailability of dietary Fe (largely non-haeme Fe) may vary from less than 1% to almost 100% (Hurrell, Reference Hurrell1997). The term bioavailability has not always carried the same meaning. There were many attempts in the past to formulate an adequate definition. In our study, Fe bioavailability is taken as the proportion of the total Fe in the diet that is digested, absorbed and metabolised by normal pathways (Fairweather-Tait, Reference Fairweather-Tait1987), and it is defined as the fraction of ingested Fe that is absorbed and utilised for normal metabolic functions and to saturate body Fe stores (Hurrell, Reference Hurrell1997). In nature, some inhibitors of Fe absorption are known, such as phytic acid, polyphenolic compounds, calcium and, to a lesser extent, certain peptides. Ascorbic acid and digested muscle proteins enhance Fe absorption. In the diets of our study, those compounds were at the same level, if present, because the diets were different only by the addition of Fe compounds. In the second experiment, there was no mineral addition, and accordingly the animals did not grow during the study. For those animals, the dietary mineral deficiency may have altered metabolism overall, which may have affected the uptake of Fe. Animals were obviously Fe deficient, because the pre-experimental period with no Fe addition in the diet lasted for 13 days before the balance measurements were recorded. The level of Fe in the liver (0.36 mg) was less than half of the Fe level in the liver of the rats in the first experiment (in average 0.85 mg ± 0.14 mg).
The apparent Fe digestibility and apparent Fe bioavailability were significantly lower when inorganic Fe (Fe-sulphate) was added to the diet (38.82% and 26.52%, respectively) as compared with the Fe from enriched yeast biomass, where the values were similar (46.05% to 46.85% and 41.34% to 41.82% for apparent digestibility and apparent bioavailability), irrespective of the level of Fe in the diet. The differences in Fe balance appeared already in digestion; however, the greatest differences were found in the level of metabolism, because rats used a greater percentage of absorbed Fe from Fe-enriched yeast biomass compared with the Fe-sulphate group. In the Fe-enriched yeast biomass groups, the amount of Fe excreted through urine was low and, comparable with the second experiment (without Fe addition), at almost the same level (Table 3), which shows that almost all absorbed Fe (from Fe-enriched yeast biomass) was used in metabolic processes. In the control group (Fe-sulphate), the excretion of Fe through urine was almost four times greater.
Liver Fe storage depends on the level and nature of Fe in the diet. The greatest concentration in the liver was found in the group with the highest level of Fe-enriched yeast biomass in the diet, 200.4 μg/g liver ±26.5 μg. When animals received the same amount of Fe from Fe-sulphate, the level of Fe in the liver was only 70% of the mentioned group, 147.9 μg/g liver ±23.6 μg. The concentration of Fe in the liver in the Fe-sulphate group was even lower than in the other two Fe-enriched yeast biomass groups with lower Fe concentrations in the diet, 154.6 μg/g liver ±19.0 μg and 167.1 μg/g liver ±9.8 μg in YB35 and YB20, respectively, but still significantly (P < 0.05) higher than in the group of rats receiving a diet without Fe addition (77.3 μg/g liver ±13.3 μg). Hegsted et al. (Reference Hegsted, Finch and Kinney1949) found different levels of Fe in the liver (31 to 172 mg/100 g liver) depending on the absolute levels of Fe and phosphorus in the diet, as well as the Fe/phosphorus ratio. Their values were rather high, because one of the more recent publications quoted lower values as adequate liver Fe values (between 30 and 300 mg/kg wet liver) in different animal species (Puls, Reference Puls1994). For pigs, which have similar digestion and metabolism as laboratory rats, the values are between 100 and 200 mg/kg wet weight liver, which is in accordance with our results of between 150 mg/kg liver in the Fe-sulphate group and 200 mg/kg liver in YB50 group. Souci et al. (Reference Souci, Fachmann and Kraut2008), in their nutritional tables, cite values for Fe in the liver of different domestic animals between 69 mg/kg for ox and 170 mg/kg for pigs.
In summary, from our data it is clear that at normal rates of Fe dosage in the diet, and for rats with similar body Fe contents, absorption is dependent on the nature of the Fe in the diet. Apparent Fe digestibility and apparent Fe bioavailability were not dependent on the level of organic Fe in the diet; however, liver Fe storage was higher at the highest level of organic Fe in the diet. At very low Fe intake, the apparent Fe bioavailability increased, which probably means that only metabolic losses were excreted.
Acknowledgements
The present study was supported by a grant from the Ministry of Education, Science and Sport and the Ministry of Agriculture, Forestry and Food of the Republic of Slovenia (Project no. V4-0756-0481-02). The authors are grateful to Marko Kodra for performing all the chemical analysis in the Laboratory of the Chair of Nutrition.