Introduction
Intensity-modulated radiotherapy (IMRT) is one of the most useable and reliable technique in prostate radiotherapy.Reference Tanaka, Yamaguchi and Hachiya 1 The aims of high-quality IMRT are to give a prescribed and conformal dose to the defined planning target volume (PTV) and minimise the organs at risk (OARs) doses as low as possible.Reference Halperin, Brady and Perez 2 Achieving these aims is difficult, particularly in cases wherein the OARs and PTV are in close proximity, for example to be considered in prostate cancer radiotherapy.Reference Nelms, Robinson and Markham 3 OAR sparing is influenced by the PTV dose coverage and homogeneity level.Reference Sun, Smith, Ghose and Kirkby 4 , Reference Craft, Khan, Young and Bortfeld 5 Significant variations exist in protocols for acceptable PTV dose coverage and homogeneity along with the OARs sparing.Reference Matzinger, Poortmans and Giraud 6 – Reference Pollack, Hanlon and Horwitz 8 Based on older reports of the international commission on radiation units and measurements (ICRU 50 and 62), the PTV inhomogeneity (IH) must be in −5% and +7% range of the prescribed dose. 9 , 10 Although regarding a more recent report produced by this organisation (ICRU 83), 11 it is possible to break or violate the PTV dose constraints for more OAR sparing in the cases where there is no technical solution to improve the dose distribution. Nevertheless, it is not clear when or for what kind of patients it would be beneficial to change PTV dose constraints. Understanding the PTV-OARs dose trade-offs with regards to patients’ specifications is therefore important to be able to generate optimal radiotherapy plans with maximum OARs sparing and a suitable dose for tumour control. In a prospective IMRT optimisation procedure, removing or reducing the priority of PTV dose constraints eliminates or reduces some of the optimisation problems, increasing the near optimal solution space and resulting in overall improvements of treatment goals.
In a recent article reported by Craft et al.,Reference Craft, Khan, Young and Bortfeld 5 the strict enforcement of PTV dose homogeneity was questioned in comparison with OAR sparing. In general, they suggested that in IMRT or volumetric-modulated arc therapy (VMAT) plans, allowing for higher dose IH in target volume would result in better sparing for OARs positioned around the target. In a more recent study by Sun et al.,Reference Sun, Smith, Ghose and Kirkby 4 removing the PTV upper-dose constraints led to acceptable localised prostate VMAT plans and a reduction in rectal dose and improvement in tumour control probability (TCP). There are also a number of studiesReference Tol, Dahele and Doornaert 12 , Reference Craft, McQuaid, Wala, Chen, Salari and Bortfeld 13 reporting the trade-off between the OAR sparing and PTV homogeneity. However, as comes to our knowledge from the literature review, the patients’ dosimetric and anatomical parameters and their effects on the trade-off have rarely been investigated in previous relevant studies. Therefore, the aim of this study was to determine the trade-off between the OARs sparing and PTV dose homogeneity with regard to patients’ dosimetric and anatomical parameters to achieve high-quality radiotherapy plans for treating prostate cancer using IMRT.
Materials and Methods
Patient selection, imaging and treatment planning
A single-centre, retrospective study was done following National Research Ethics Board approval. CT and MRI T2-weighted (T2w) scans of 15 prostate cancer patients with stages ranged from T2a to T3a were considered. The patients were selected randomly from those referred by specialised clinical oncologists for IMRT procedure. However, the patients’ selection was made in a way to cover a wide range of anatomical parameters among them to enable us to evaluate the effect of such parameters on the trade-off between OARs sparing and PTV homogeneities by using non-parametric statistical tests.
MRI-T2w axial images [spin-echo sequence, echo time (TE)=100 ms, repetition time (TR)=3,000 ms using a 1·5 T Siemens Avanto scanner; Siemens Healthcare GmbH, Erlangen, Germany] were matched with CT scans which were acquired with a spiral 16-slice Siemens Emotion System (Siemens Healthcare GmbH). All the patients were scanned in the supine position with a comfortably full urinary bladder and an empty rectum without any contrast medium.
Prostate for low-to-intermediate risk patients and prostate with seminal vesicles for high-risk patients were defined as clinical tumour volumes (CTVs). The patients’ PTV was generated by adding an 8 mm margin posteriorly and 10 mm margin in other directions, including anterior, left, right, up and down.
All the patients were planned with nine fields IMRT technique (0, 30, 60, 100, 150, 210, 270, 300 and 330°) delivering 70·2 Gy in 26 fractions )hypofractionation regime( using the Eclipse treatment planning system (TPS), version 11 with simulated 6 MV photon beam performed on a Clinac 600C Varian linac equipped with an 80 L multi-leaf collimator (Varian Medical Systems, Palo Alto, USA). Final dose calculations of the IMRT plans were performed using anisotropic analytical algorithm with a 2·5 mm dose grids. All the plans were interactively optimised following our institutional planning protocol based on a trial study reported by Pollak et al.Reference Pollack, Walker and Horwitz 7 in which more than or equal to 98% of PTV volume received 70·2 Gy and no more than 2% of the PTV received 75 Gy or higher doses. Furthermore, the volumes of bladder and rectum that received 50 Gy or lower were chosen in such a way to be <25 and 17%, respectively. In addition, the volumes of bladder and rectum that received 31 Gy or lower were <50 and 35%, respectively, and the maximum dose of 40 Gy was considered for femur heads.
The dose constraint priority is a concept used to indicate the importance of user-defined dose constraints in IMRT optimisation procedure. Priority values must be specified after determining the dose constraints for every structure. In the Eclipse software, the relative importance of dose constraints is determined by such values. For each patient, nine IMRT plans were created, using different target dose constraint priorities. The OARs’ priorities were kept constant (equal to 200) in all the IMRT plans, whereas the PTV and CTV priorities were started from a value of 100 and increased by a step of 50 for every plan compared to the previous one, resulting in a priority range of 100–500. As the OARs priorities were kept constant in all the IMRT plans, the trade-off between the PTV dose homogeneity and OARs sparing was investigated. The plans were not made in a way to meet the PTV prescribed dose limits to enable us evaluating the level of the OARs sparing with changing the PTV dose constraint priorities.
Parameters
The parameters measured and calculated for evaluating the PTV dose distribution included the homogeneity index (HI), as described in ICRU report 83, 11 and conformity index (CI), as proposed by Paddick.Reference Paddick 14 In addition, the doses delivered to 98, 50 and 2% of the PTV volume (D 98%, D 50% and D 2%) were calculated.
The dosimetric parameters included the mean dose and the volume of bladder and rectum that received 60 Gy (V 60) and 50 Gy (V 50) doses. V 60 and V 50 are the tolerance doses chosen based on previous studies.Reference Emami, Lyman and Brown 15 , Reference Milano, Constine and Okunieff 16 Furthermore, the volume of femur head that received 40 Gy (V 40) and its near-maximum dose (D 2%) were evaluated. The CTV, bladder and rectum dose–volume histograms (DVHs) were also translated to TCP and normal tissue complication probability (NTCP), using Niemierko’s equivalent uniform dose (EUD)-based model.Reference Niemierko and Goitein 17 , Reference Gay and Niemierko 18
The patients’ anatomical parameters were measured to assess the relationship between them and the effectiveness of increasing the dose constraint priority. These parameters included the volumes of PTV, CTV, OARs and joint volumes of OARs with PTV. In addition, the distances between the centre of the OARs from the centre of PTV and prostate were measured. The patients’ anterior–posterior (AP) and lateral thickness in the central transverse slice of the prostate along with the femur head distances were also measured.
Analysis
All of the parameters were averaged for all the patients’ data. The Kolmogorov–Smirnov test was used for testing the normal distribution of the parameters. The relationship between the priority with OARs dosimetric parameters and PTV homogeneity was assessed using fitting techniques. The correlation between the anatomical parameters with the OARs mean doses and NTCPs was calculated using the Spearman test. HIs were plotted against the OARs doses for each patient for better dosimetric comparison among various priorities and evaluated their effects on PTV and OARs.
Results
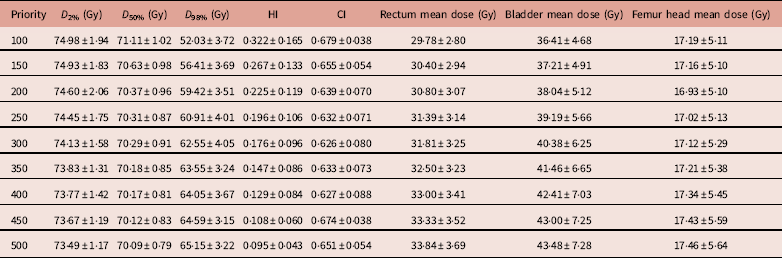
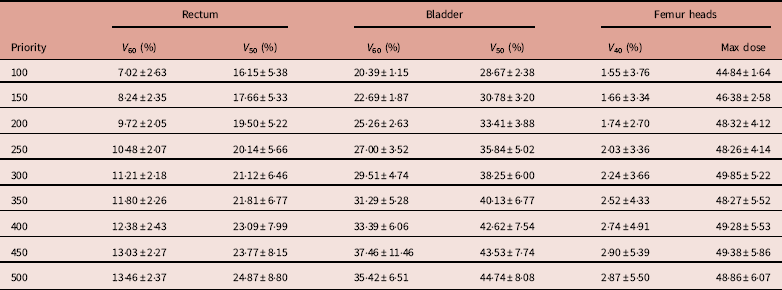
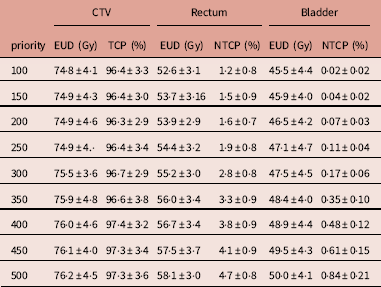
Table 1 shows the OARs and PTV dosimetric parameters averaged over all the patients for various dose constraint priorities. The table demonstrates that with increasing the priority of PTV dose constraint, rectum and bladder mean doses are increased, but femur head mean doses do not change significantly. Increasing the priority leads to better HIs of PTV (from 0·286 to 0·095). In addition, other parameters related to dose homogeneity, that is, doses to 2, 50 and 98% of PTV volume show better values on increasing the priority. Other OARs dosimetric parameters including V 60 and V 50 for rectum and bladder behaved like their mean doses (Table 2). V 60 increased about 91·7 and 73·7% for rectum and bladder, respectively, on increasing the priority. Similarly, V 50 increased about 54·0 and 56·1% for rectum and bladder, respectively. Femoral head dosimetric parameters have just a slight growth with increasing the priority, including V 40 (1·55±3·76 to 2·87±5·50) and maximum dose (44·84±1·64 to 48·86±6·07). The EUD and TCP values of CTV along with the EUD and NTCP values of OARs are presented in Table 3.
The OARs and PTV dosimetric parameters averaged over all the patients for various dose constraint priorities

Abbreviations: OARs, organs at risk; PTV, planning target volume.
The OAR additional dosimetric parameters means and standard deviation values averaged over all the patients for various dose constraint priorities

Abbreviations: OARs, organs at risk.
The EUD, TCP of CTV and NTCP of bladder and rectum means and standard deviations averaged over all the patients

Abbreviations: EUD, equivalent uniform dose; TCP, tumor control probability; CTV, clinical tumor volume; NTCP, normal tissue complication probability.
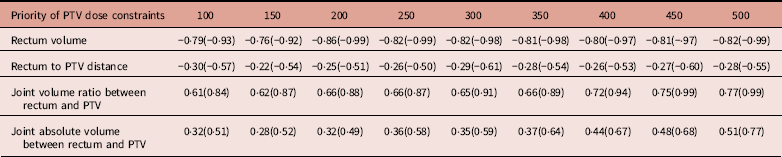
In Tables 4 and 5, the results of Spearman’s correlation between the OAR sparing (mean dose and NTCP) with the anatomical parameters are shown for each dose constraint priorities. The bladder volume and bladder to PTV distance have higher inverse correlation values for bladder. Rectum volume and joint volume ratio between the rectum and PTV have higher inverse correlation values for rectum. There is no significant correlation between the OAR sparing and other anatomical parameters of the patients (such as patient lateral thickness, patient AP thickness, femurs head distances and femur distances to the target tissue) that are not mentioned in the tables. As the distances between the OARs and prostate were similar with that of the OARs to PTV distance and these are clinically more useable, we just reported the correlation values for these parameters with OARs mean doses and NTCPs.
Spearman’s correlation values between the bladder anatomical parameters with its mean doses and NTCPs (in parentheses) for various dose constraint priorities

Abbreviations: PTV, planning target volume.
Spearman’s correlation values between the rectum anatomical parameters with its mean doses and NTCPs (in parentheses) for various dose constraint priorities

Abbreviations: NTCP, normal tissue complication probability; PTV, planning target volume.
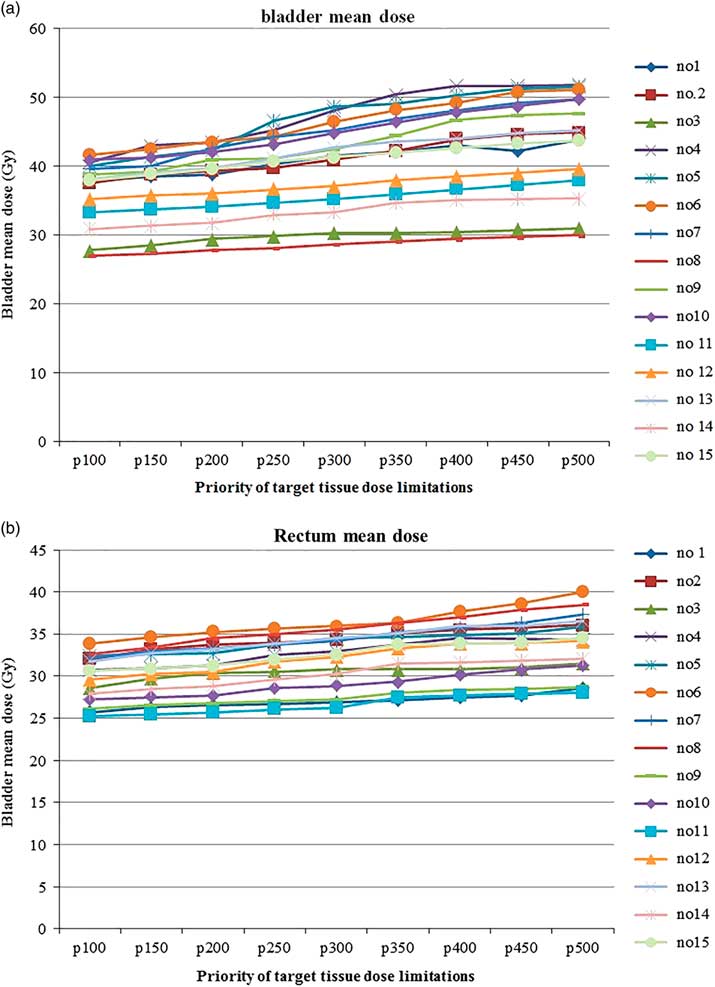
Figure 1 illustrates the bladder and rectum mean doses against various priorities for each patient. For the patients whose bladder mean doses were higher, enforcing the PTV dose constraints (increasing priorities) led to more increases in the mean doses of bladder. Similar trend was also noted for the rectum.
The OARs mean doses against the priority for all the patients (a: bladder; b: rectum) (no. x=patient x). Abbreviation: OARs, organs at risk.

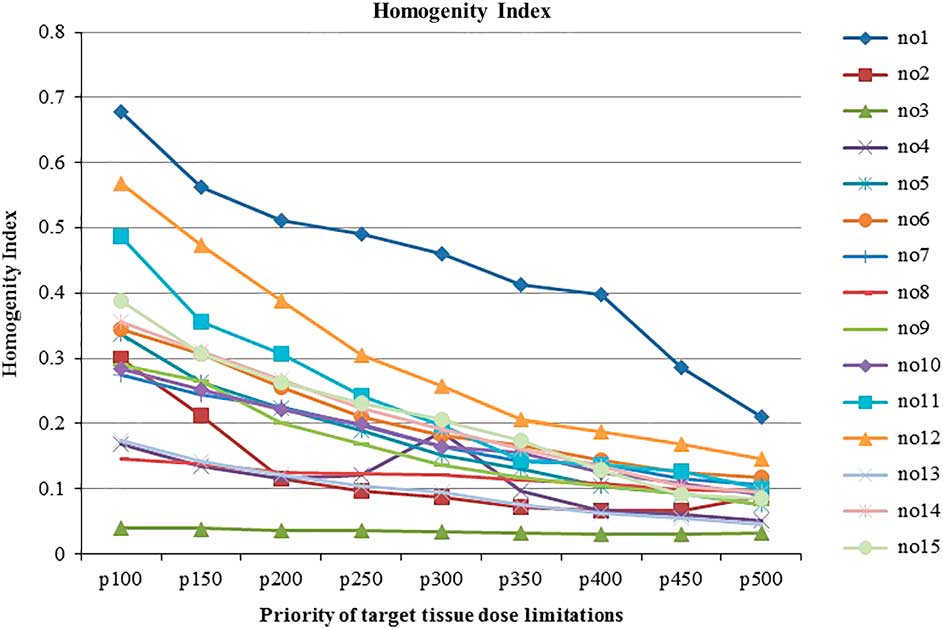
The improvement of HI with increasing the PTV priority is represented in Figure 2 for each patient. As could be seen, increasing the priority results in significant improvement in the HIs.
The PTV homogeneity indexes against the priority for all the patients. Abbreviation: PTV, planning target volume.

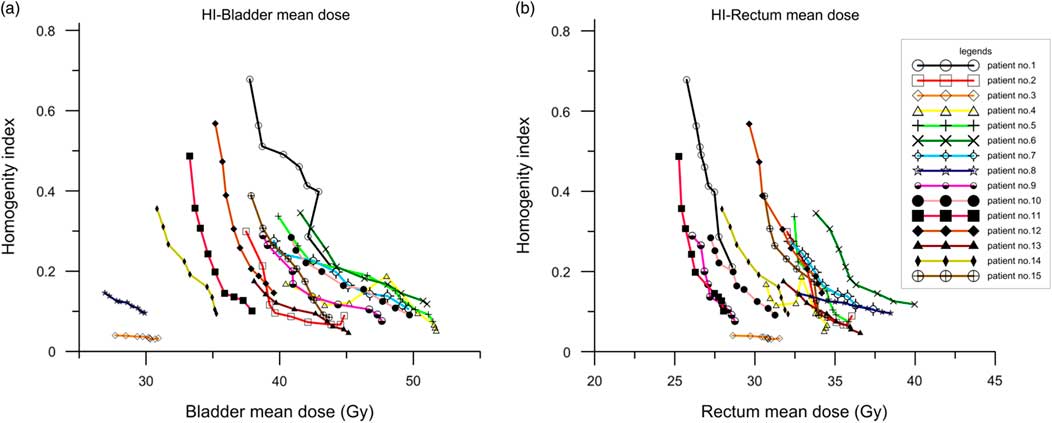
In Figure 3, the HIs are plotted against the bladder and rectum mean doses of all the patients for various priorities. As could be noted, the OARs (bladder and rectum) mean doses increased and the HIs decreased with increasing the priority of PTV dose constraints.
The HI versus bladder (a) and rectum (b) mean doses for all the patients. Abbreviation: HI, homogeneity index.

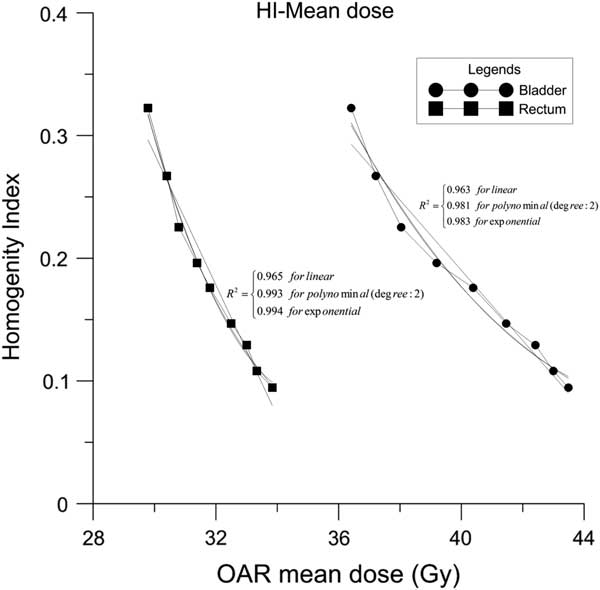
Exponential fitting curves were applied to HI–OAR mean dose values. The mean R 2 of these fitting curves for all the patients were equal to 0·892±0·125 and 0·904±0·121 for bladder and rectum, respectively. The HIs averaged over all the patients are plotted in Figure 4, against the OARs mean doses, and several fitting curves (linear, square polynomial and exponential) are applied on them. The best fitting curve was exponential. The equations resulted from the exponential curves for bladder and rectum were as follows:
 $${\rm Bladder}\,\colon\,{\rm ln}\left( {{\rm HI}} \right){\equals}\left( {{\minus}0.157{\asterisk}{\rm BMD}} \right){\plus}4.552$$
 $${\rm Rectum}\,\colon\,{\rm ln}\left( {{\rm HI}} \right){\equals}\left( {{\minus}0.294{\asterisk}{\rm RMD}} \right){\plus}7.622$$
where BMD and RMD indicate the bladder and rectum mean doses, respectively.
The HI versus OAR mean doses averaged over all the patients and their fitting curves. Abbreviation: HI, homogeneity index; OAR, organ at risk.

Discussion
Obviously, demanding higher homogeneous PTV dose distribution (lower HIs) can increase OARs doses significantly, whereas reducing the PTV dose homogeneity (on average) by an small amount gives significant OARs sparing as reported in several previous studies.Reference Sun, Smith, Ghose and Kirkby 4 , Reference Craft, Khan, Young and Bortfeld 5 , Reference Tol, Dahele and Doornaert 12 , Reference Craft, McQuaid, Wala, Chen, Salari and Bortfeld 13 In our study, the effect of changing the target dose homogeneity, using the target dose constraint priorities, on the OAR sparing was evaluated based on patients’ dosimetric and anatomical parameters. For the patients with high HIs (especially more than 0·2) at low priorities, enforcing the dose constraints resulted in significant improvement in HIs and OARs sparing. But, for the patients with low initial HIs, such enforcement lead to the increase of OARs mean doses with no significant effect on the improvement of HI (Figures 1 and 3). In other words, for the patients with higher OAR doses than the prescribed dose limitations (Figure 2), it will be a good idea to decrease the priority of target dose constraints to achieve better OARs sparing.
As seen in Table 1, changing the dose constraints priorities was more effective for the low dose levels (D 98%) compared to the median (D 50%) and high dose levels (D 2%) of the PTV DVH. Therefore, tighter dose constraints at low dose; and weaker constraints at median/high dose levels could produce better OARs sparing. Craft et al.Reference Craft, Khan, Young and Bortfeld 5 noted that higher dose regions in the PTV allow generating steepest dose profile around the PTV, lowering the dose outside the target compared with homogeneous dose distributions. They also mentioned that using upper dose constraints in joint volumes of PTV and OARs accompanied by more heterogeneity in the PTV, leads to the reduction of the PTV hot points/regions.
We found strong inverse correlations between the OAR doses (and NTCP) and their volumes, and also between the bladder to PTV distance with bladder dose, while there were direct correlations between the joint volume ratios of rectum and PTV with rectum doses. The target dose constraint priority value had no effect on the correlations between the OARs sparing with their volumes and also their distances to PTV. However, increment of priority value led to higher correlation coefficients between the joint volumes with OARs dose and their complication probability. The application of higher constraints to obtain higher doses in the PTV joint volumes with OARs inevitably results in higher doses in the OARs. For example, patients 1 and 9, who had larger rectum volumes (86·7 and 86·8 cc) and lower PTV and rectum joint volumes (2·54 and 15·67%), had lower rectum doses for the same HI compared to other patients (Figure 3b). In contrast, for the patient 8, who had the smallest rectum volume and relatively high ratio of rectum joint volume with the PTV, increasing the priority was not an effective tool for improving the PTV dose homogeneity, as it also increased severely the rectum mean dose. A similar pattern can also be seen for the bladder sparing (Figure 3a).
The distance between the OARs and PTV was one of the anatomical parameters affecting OARs sparing. As seen in Figure 1a, patients 4, 5 and 6 show higher bladder mean doses (especially at higher priorities) due to the lower distances between their bladder and PTV (3·06, 3·03 and 2·96 cm), while patients 3 and 8 show lower bladder mean doses due to the higher distances between their bladder and PTV (4·89 and 5·09 cm). It must be noted that patients 3 and 8 also had bigger bladder volumes (209·3 and 247·4 cc). The bladder distance from PTV had stronger effect on the OARs sparing compared to that of the rectum, as it has a larger volume subjected to the radiation. In addition, usually tighter constraints are considered for the rectum to spare it from irradiation.
In a study done by Wall et al.Reference Wall, Carver and Fontenot 19 about the potential influencing factors and OARs doses (but, not about the trade-off between the PTV homogeneity and OARs sparing), strong correlations were reported between the OARs dose with joint volumes between OARs (bladder and rectum) and PTV. Tol et al.Reference Tol, Dahele and Doornaert 12 characterised the trade-off between PTV dose IH and OAR sparing in complex head and neck VMAT. They reported that the distance between the PTV and OARs or joint volumes of PTV and OARs was strongly correlated with the OAR sparing. Unlike our study, they did not evaluate other parameters like the OARs volume and complication probabilities and made it for the head and neck VMAT. However, their overall results are in good agreement with our findings.
Landoni et al.Reference Landoni, Fiorino, Cozzarini, Sanguineti, Valdagni and Rancati 20 showed that changing the fractionation irradiation regime to deliver higher doses per fraction, like hypofractionated scheme (our clinical protocol), has potentially higher bladder toxicities. Our findings indicated that lower bladder doses and toxicities can be obtained with lower target dose constraint priorities. Reducing the target dose constraints may also give more flexibility to define higher bladder dose constraints and priorities in the optimisation process that will be helpful in such irradiation scheme.
Increasing CTV maximum dose has resulted in higher EUDs and TCPs.Reference Goitein 21 , Reference Nielsen, Hansen, Schytte and Brink 22 Balderson et al.Reference Balderson and Kirkby 23 have also showed that large amount of target volume IHs is clinically acceptable. Considering our findings, the TCP values of target volume had just slightly lower values at lower priorities, but the NTCP values of bladder and rectum had lower values due to decreasing doses delivered to them. Sun et al.Reference Sun, Smith, Ghose and Kirkby 4 reported that removing the upper dose constraint of PTV, increased the TCP of CTV and decreased the NTCP of rectum. In general, TCP and NTCP values depend on dose distributions of the target volume and OARs, respectively. Hence in the patients that changing priority of target dose constraint has higher effects on dose distributions, it will have a greater impact on TCP or NTCP values in the same way.
In this study we just applied the dose constraints recommended by Pollak et al.Reference Pollack, Walker and Horwitz 7 for IMRT procedures. We used such constraints because they are stricter and lead to better dosimetric and radiobiological results as claimed by Mavroidis et al.Reference Mavroidis, Komisopoulos and Buckey 24 However, some centres may use lighter dose constraints recommended by other professional organisations/institutions and other radiotherapy proceduresReference Matzinger, Poortmans and Giraud 6 , Reference Pollack, Hanlon and Horwitz 8 for which similar investigations are required to be carried out to ascertain/confirm our findings.
Conclusion
Generally, our findings indicated that PTV dose homogeneity was highly dependent on PTV dose constraint priority in prostate IMRT optimisation procedures. Improving the PTV dose homogeneity with increasing the priority resulted in the increase of OARs (rectum and bladder) doses with an exponential correlation (R 2=0·983 for bladder and R 2=0·994 for rectum). Hence, the enforcement of target dose constraints is likely more effective on HIs improvement in the patients with initial high HIs at low priorities. Reducing the priority had more effects on OARs sparing compared to the HI, especially in the patients with high OARs doses in high priority plans which can be attributed to smaller distances or greater joint volumes between the OARs and PTV. The results of this study can be used for future automated treatment planning strategies, comparing different clinical planning protocols and routine practices in prostate IMRT.
Acknowledgments
This research was carried out by the first author under the supervision of the second author and with the help and advice of other authors as the advisors of a project at Tarbiat Modares University. The patients’ imaging and radiotherapy planning procedures were carried out at the Radiotherapy and Oncology Department of Shohaday-e-Tajrish Hospital, Tehran, Iran. Therefore, the authors express their sincere appreciation to the above institutes for their financial help and technical assistance.
Financial support
This research received no specific grant from any funding agency, commercial, or not-for-profit sectors.
Conflicts of interest
The authors have no conflicts of interest to disclose.