





Adolescence is a crucial developmental turning point, characterized by increases in psychological disorders, including generalized anxiety, social anxiety, eating, trauma-related, and depressive disorders (Solmi et al., Reference Solmi, Radua, Olivola, Croce, Soardo, Salazar de Pablo and Fusar-Poli2022). This increased severity and onset of psychopathology coincides with dramatic psychological and neurological maturation. Nevertheless, the same developmental sensitivity that amplifies the harmful effects of risk factors also creates a window of opportunity to foster resilience and positive wellbeing that persist into adulthood. One major challenge is identifying youth at high-risk before they reach adolescence to facilitate the timeliness of preventive interventions. Prior research indicates that one of the earliest antecedents of psychopathology is elevated irritability characterized by frequent temper outbursts and chronic angry mood (Sorcher et al., Reference Sorcher, Goldstein, Finsaas, Carlson, Klein and Dougherty2022; Wakschlag et al., Reference Wakschlag, MacNeill, Pool, Smith, Adam, Barch and Allen2024). Indeed, irritability is one of the most common reasons that youth are referred for psychiatric evaluation (e.g., Evans et al., Reference Evans, Corteselli, Edelman, Scott and Weisz2023). Irritability is most common in early childhood and typically declines; however, adolescence is associated with an increase in the duration of irritable mood, as well as in mental health disorders characterized by irritable mood (Copeland et al., Reference Copeland, Brotman and Costello2015). Furthermore, the heterogeneity in developmental trajectories and multifinality of this transdiagnostic symptom exacerbate the challenges of identifying youth at high-risk (Riglin et al., Reference Riglin, Eyre, Thapar, Stringaris, Leibenluft, Pine and Thapar2019). There is a critical need to develop predictive models that can determine which youth are at greatest risk for high and chronic levels of irritability across critical, transitional developmental periods.
Prior work has observed four or five youth irritability trajectories in longitudinal community samples and has reported an association between trajectories characterized by persistently elevated levels of irritability and poorer mental health outcomes (Orri et al., Reference Orri, Galera, Turecki, Boivin, Tremblay, Geoffroy and Côté2019; Riglin et al., Reference Riglin, Eyre, Thapar, Stringaris, Leibenluft, Pine and Thapar2019; Wiggins et al., Reference Wiggins, Mitchell, Stringaris and Leibenluft2014; Yu et al., Reference Yu, Hodgdon, Kryza-Lacombe, Osuna, Bozzetto, Ciro and Wiggins2023b). Across these studies, the majority of children exhibit normative, persistently low irritability levels throughout development, while a smaller percentage of youth experience higher levels of irritability either persistently throughout or at some point during the assessed developmental period. For example, in a sample of 1,393 children from ages 6 to 12 using teacher reports of irritability, four trajectories were identified and included low (74.7%), persistent (5.0%), rising (13.0%), and declining (7.4%) (Orri et al., Reference Orri, Galera, Turecki, Boivin, Tremblay, Geoffroy and Côté2019). Furthermore, Wiggins et al. (Reference Wiggins, Mitchell, Stringaris and Leibenluft2014) identified five trajectories based on parent reports of child irritability from age 3 to 9: low-decreasing (60.8%), medium-decreasing (21.0%), high-steady (10.6%), initially very high-decreasing (5.4%), and high-increasing (2.2%). Interestingly, Yu et al. (Reference Yu, Hodgdon, Kryza-Lacombe, Osuna, Bozzetto, Ciro and Wiggins2023b) identified an important inflection point in preadolescence (around age 9), after which irritability levels shifted to either high or low levels. Thus, it is critical to further investigate these changes in irritability from preadolescence into early adolescence.
Although previous research has built a foundation for our understanding of irritability trajectories in youth, critical gaps remain. First, adolescence is characterized by increased vulnerability to mental health disorders; thus, there is a need for research that closely examines the unfolding of irritability across the transition from preadolescence to adolescence with sufficiently frequent repeated assessments. Although a few studies have analyzed irritability trajectories that crossed over into the adolescent years, the time intervals between clinical assessments have often omitted ages that may be pivotal time points for the developmental course of irritability (Riglin et al., Reference Riglin, Eyre, Thapar, Stringaris, Leibenluft, Pine and Thapar2019; Yu et al., Reference Yu, Hodgdon, Kryza-Lacombe, Osuna, Bozzetto, Ciro and Wiggins2023b). Second, there is a need to predict the course of irritability to facilitate early intervention that can alter high-risk irritability trajectories. Few studies have investigated predictors of the course of irritability (Sorcher et al., Reference Sorcher, Mennies, Robeson, Seeley, Klein, Dougherty and Olino2023; Wiggins et al., Reference Wiggins, Mitchell, Stringaris and Leibenluft2014; Yu et al., Reference Yu, Hodgdon, Kryza-Lacombe, Osuna, Bozzetto, Ciro and Wiggins2023b), and no studies to our knowledge have applied machine learning techniques to develop predictive models for irritability trajectories. Machine learning provides an exploratory, computational tool to identify predictors across numerous domains. In turn, this approach can contribute to subsequent confirmatory research with a priori hypotheses and ultimately inform early detection of high-risk individuals.
Research investigating predictors for irritability is sparse, and the limited research has revealed predictors for youth irritability across a broad range of domains. Studies of irritability predictors have reported youth internalizing and externalizing problems (e.g. Leadbeater & Homel, Reference Leadbeater and Homel2015), sleep problems (e.g., Rubens et al., Reference Rubens, Evans, Becker, Fite and Tountas2017), harsh parenting behaviors (Wiggins et al., Reference Wiggins, Mitchell, Stringaris and Leibenluft2014), lower parental education (Kessel et al., Reference Kessel, Dougherty, Hubachek, Chad-Friedman, Olino, Carlson and Klein2021; Wiggins et al., Reference Wiggins, Mitchell, Stringaris and Leibenluft2014), and parent personality and psychopathology (Dougherty et al., Reference Dougherty, Smith, Bufferd, Stringaris, Leibenluft, Carlson and Klein2013; Sorcher et al., Reference Sorcher, Mennies, Robeson, Seeley, Klein, Dougherty and Olino2023; Wiggins et al., Reference Wiggins, Mitchell, Stringaris and Leibenluft2014) as predictors of later youth irritability; however, the majority of these studies examined predictors of later irritability but not the longitudinal course of irritability. Prior research has also interrogated both concurrent and longitudinal structural neural correlates of youth irritability with scrutiny of brain regions involved in reward processing, emotion regulation, and inhibitory control (e.g., Dennis et al., Reference Dennis, Humphreys, King, Thompson and Gotlib2019). Given the paucity of research into predictors of the course of irritability, it is crucial to apply data-driven methods to examine predictors that have been previously identified in the youth irritability research while also investigating predictors from the broader youth psychopathology literature.
Machine learning, a diverse set of data-driven algorithms that discover patterns in large datasets, has the potential to facilitate our identification of youth at higher risk for long-term maladjustment by generating predictive models (Galatzer-Levy et al., Reference Galatzer-Levy, Huang and Bonanno2018). Large community samples such as the Adolescent Brain Cognitive Development study (ABCD; Barch et al., Reference Barch, Albaugh, Avenevoli, Chang, Clark, Glantz and Sher2018), a large national sample of preadolescents assessed for 10 years, offer the opportunity to apply machine learning methods to investigate irritability and mental health during critical developmental years (Xiang et al., Reference Xiang, Chen, Peng, Luo, Jiang, Chen and Zhou2022).
Our study aims to leverage the ABCD dataset to identify irritability trajectories and to develop predictive models for these irritability trajectories using a wide range of preadolescent predictors. We examine irritability trajectories across the transition from preadolescence (ages 9–10) to early adolescence (ages 13–14) using latent class growth analysis. We apply several different supervised machine learning algorithms to develop predictive models for irritability trajectories. Results for the predictive models describe model performance and identify important preadolescent predictors of irritability trajectories. Our full set of candidate predictors reflects a comprehensive biopsychosocial model of youth irritability and mental health across development, spanning multiple domains that have the potential to influence the developmental course of irritability, including youth psychopathology, youth physical health, neurocognitive abilities, psychosocial environment, parent psychopathology, and youth neurobiology. Based on prior research in community samples, we expect to observe that the majority of youth will exhibit consistently low levels of irritability, while a subset of youth will show persistently high or changing levels of irritability. In accordance with the data-driven nature of machine learning, we take an exploratory approach to the evaluation of model performance and the identification of top predictors without specific a priori hypotheses.
Method
Participants
Data are from the ABCD Study, a 10-year longitudinal study that tracks youth development in a large, national sample starting from preadolescence (Volkow et al., Reference Volkow, Koob, Croyle, Bianchi, Gordon, Koroshetz, Pérez-Stable, Riley, Bloch and Conway2018). The baseline sample consisted of 11,862 9–10-year-old youth residing in the United States. The current study analyzed data from the ABCD Data Release 5.1 (10.15154/z563-zd24), which included the full, preadolescent sample at baseline, 1-year, 2-year, and 3-year follow-ups, and partial sample at the 4-year follow-up (n = 4,678). The outcome of interest is developmental trajectories of parent-reported youth irritability symptoms based on the Child Behavior Checklist (CBCL) irritability scale scores.
Youth irritability
The CBCL is a parent-report mental health measure that assesses the frequency and severity of a child’s emotional and behavioral problems (Achenbach, Reference Achenbach2009). Prior research has quantified an irritability dimension by summing three CBCL items that evaluate the extent to which their child can be described as “stubborn, sullen or irritable,” exhibiting “sudden changes in mood or feelings,” and having “temper tantrums or hot temper” (Roberson-Nay et al., Reference Roberson-Nay, Leibenluft, Brotman, Myers, Larsson, Lichtenstein and Kendler2015; Stringaris et al., Reference Stringaris, Zavos, Leibenluft, Maughan and Eley2012). Each item is rated as absent (0), occurs sometimes (1), or occurs often (2) over the past six months, resulting in an irritability index ranging from 0 to 6 with higher scores indicating higher levels of irritability. Prior exploratory and confirmatory factor analyses support the psychometric properties of this scale to measure the latent construct of irritability (Stringaris et al., Reference Stringaris, Zavos, Leibenluft, Maughan and Eley2012; Wiggins et al., Reference Wiggins, Mitchell, Stringaris and Leibenluft2014).
Baseline predictors
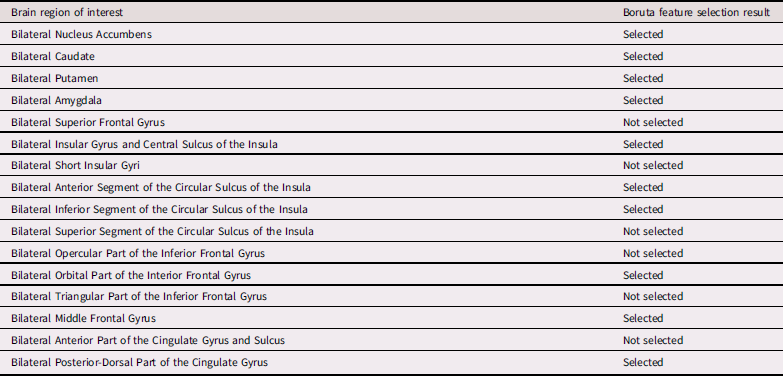
We used both the small literature on predictors and correlates of youth irritability and the broader literature on predictors of internalizing and externalizing symptomatology, particularly given the transdiagnostic nature of irritability, to inform the selection of the candidate predictors (Hill et al., Reference Hill, Kashyap, Raffanello, Wang, Moffitt, Caspi and Posner2025; Kessel et al., Reference Kessel, Dougherty, Hubachek, Chad-Friedman, Olino, Carlson and Klein2021). Specifically, we used baseline variables that spanned the wide range of ABCD emotional, behavioral, cognitive, and contextual domains, including youth’s mental health, physical health, neurocognitive abilities, demographics, culture and environment, parent mental health, and structural neurobiological measures (Barch et al., Reference Barch, Albaugh, Avenevoli, Chang, Clark, Glantz and Sher2018; Casey et al., Reference Casey, Cannonier, Conley, Cohen, Barch, Heitzeg and Dale2018; Zucker et al., Reference Zucker, Gonzalez, Ewing, Paulus, Arroyo, Fuligni and Wills2018). The breadth of candidate predictors along with data-driven methods allowed us to expand on the limited research on predictors of youth irritability with the aim of guiding theoretical models of irritability. The current study used baseline variables from Release 4.0 which contained the full sample at baseline. For the full list of selected predictors refer to Tables 1 and 2.
Candidate behavioral predictors and feature selection results

Table 1. Long description
Panel A: Mental health domain. Lists measures like Child Behavior Checklist (CBCL), BISBAS, Impulsivity (UPPS-P) scale, and KSADS with various scales and selection results. Panel B: Family history/parent mental health domain. Includes Adult Self Report (ASR) and Family history summary scores with scales and selection results. Panel C: Physical health domain. Lists Youth sleep disturbance and Youth risk behavior survey with scales and selection results. Panel D: Neurocognition domain. Includes NIH toolbox with various tests and selection results. Panel E: Demographic domain. Lists Parent demographics survey and Residential history derived scores with scales and selection results. Panel F: Culture & environment domain. Includes ABCD parent family environment scale, ABCD youth family environment scale, School risk and protective factors, Children’s report of parental behavior inventory, and Adverse childhood experiences with scales and selection results.
Candidate structural MRI predictors and feature selection results
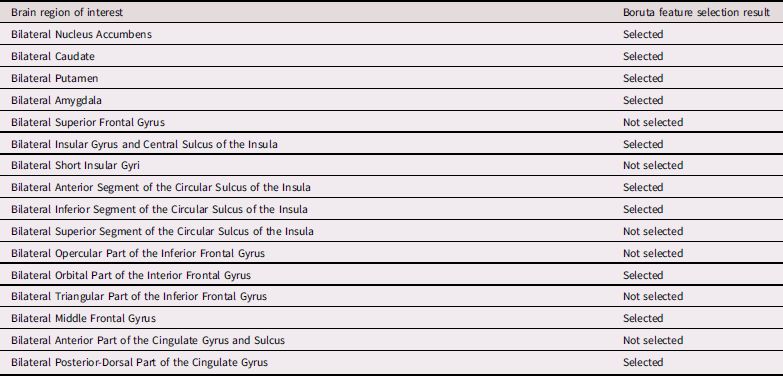
Table 2. Long description
A table comparing brain regions of interest and their feature selection results. The table has 12 rows and 2 columns. The columns are labeled ‘Brain region of interest’ and ‘Boruta feature selection result’. The rows list various brain regions and indicate whether they were selected or not selected. Row 1: Bilateral Nucleus Accumbens, Selected. Row 2: Bilateral Caudate, Selected. Row 3: Bilateral Putamen, Selected. Row 4: Bilateral Amygdala, Selected. Row 5: Bilateral Superior Frontal Gyrus, Not selected. Row 6: Bilateral Insular Gyrus and Central Sulcus of the Insula, Selected. Row 7: Bilateral Short Insular Gyri, Not selected. Row 8: Bilateral Anterior Segment of the Circular Sulcus of the Insula, Selected. Row 9: Bilateral Inferior Segment of the Circular Sulcus of the Insula, Selected. Row 10: Bilateral Superior Segment of the Circular Sulcus of the Insula, Not selected. Row 11: Bilateral Opercular Part of the Inferior Frontal Gyrus, Not selected. Row 12: Bilateral Orbital Part of the Interior Frontal Gyrus, Selected. Row 13: Bilateral Triangular Part of the Inferior Frontal Gyrus, Not selected. Row 14: Bilateral Middle Frontal Gyrus, Selected. Row 15: Bilateral Anterior Part of the Cingulate Gyrus and Sulcus, Not selected. Row 16: Bilateral Posterior-Dorsal Part of the Cingulate Gyrus, Selected.
Data analysis plan
Developmental trajectories
To identify differential irritability trajectories from ages 9 to 14, we implemented a series of latent class growth analyses ranging from two to five classes, with growth factors fixed to zero in Mplus version 8.9 (Muthén & Muthén Reference Muthén and Muthén2017). In addition to testing models based on linear trajectories, we repeated the series of models with two to five classes while estimating quadratic components for each class. To account for the hierarchical structure within the ABCD data, the models were stratified by site and clustered by family. The models classified participants by growth trajectory group based on their caregiver-rated CBCL irritability scores across the baseline, 1-year, 2-year, 3-year, and 4-year follow-up assessments. The models were estimated using full information maximum likelihood with all available data. Each model was evaluated based on information criteria model-fit indices, confidence in classification, likelihood ratio tests, and interpretability. Lower values of information criteria model-fit indices including the Akaike Information Criterion (AIC), the Bayesian Information Criterion (BIC), and the Sample Size Adjusted BIC (SSABIC) indicate better fit (Nyund-Gibson & Choi, 2018). Entropy is a measure of confidence in classification with values greater than 0.8 indicating good classification (Nyund-Gibson & Choi, Reference Nylund-Gibson and Choi2018). Likelihood-based tests, such as the Vuong-Lo-Mendell-Rubin adjusted likelihood ratio test (VLMR-LRT) indicates whether the current model provides a statistically significant improvement over the previous model with k−1 classes. A significant p-value on a likelihood-based test indicates that the current model offers statistically significant improvement over the previous model, whereas a non-significant p-value suggests maintaining the model with k−1.
Machine learning procedures
Each machine learning problem is unique and, therefore, development of accurate predictive models requires assessment of different algorithms. Applying multiple machine learning methods provides the opportunity to compare performance metrics and to examine the most important predictors for different approaches. Accordingly, we trained four different multiclass supervised machine learning models to classify youth irritability trajectories. A standardized machine learning pipeline was designed to maintain consistency across models in feature selection, data preprocessing, and adjusting for class imbalance. The full set of candidate predictors was reduced using Boruta, a data-driven procedure based on the Random Forest algorithm that identifies relevant predictors, thereby minimizing the risk of overfitting in the final models (Jiang et al., Reference Jiang, Gradus and Rosellini2020; Kursa & Rudnicki, Reference Kursa and Rudnicki2010; Kursa et al., Reference Kursa, Jankowski and Rudnicki2010). Data preprocessing included normalization of numeric predictors, dummy coding of categorical predictors, and Bagged Tree Imputation (BTI) for missing data imputation (Joranov et al., Reference Jordanov, Petrov and Petrozziello2018). Synthetic Minority Oversampling Technique (SMOTE) was used to address class imbalance by generating synthetic cases for minority classes using the nearest neighbors algorithm (KNN) (Chawla et al., Reference Chawla, Bowyer, Hall and Kegelmeyer2002). Model training employed 10-fold cross-validation for hyperparameter tuning applied to each of the four machine learning models (Elastic Net, KNN, Random Forest, and XGBoost). The four machine learning models that we selected are classic supervised learning models which use different techniques to balance the tradeoff between prediction accuracy and overfitting. Elastic net is a regularized regression technique that combines LASSO and ridge regression by optimizing two hyperparameters (Whelan et al., Reference Whelan, Watts, Orr, Althoff, Artiges, Banaschewski and Garavan2014; Zou & Hastie, Reference Zou and Hastie2005). KNN assigns classification using k nearest neighbors (Cunningham & Delany, Reference Cunningham and Delany2021). Random forest is an ensemble method that generates multiple models which are averaged together to produce predictions (Jiang et al., Reference Jiang, Gradus and Rosellini2020). XGBoost is another ensemble method, yet this method builds multiple models sequentially, thus improving on each previous model (Chen & Guestrin, Reference Chen and Guestrin2016).
All participants with structural MRI data were included in the machine learning sample (n = 11,034). The data were divided into training (n = 8,826, 80%) and test sets (n = 2,208, 20%), stratified by irritability trajectory.
For all observations in the test dataset, each model produced an estimated probability of class assignment to each of the four trajectories and assigned the final predicted class based on the highest estimated probability across all four trajectories. The current study provided a comprehensive overview of model performance, including measures of overall performance and performance by trajectory. Performance metrics included measures of the overall ratio of accurately classified cases to inaccurately classified cases (accuracy), the ability of the models to accurately detect true cases of a trajectory (true positive rate), the ability of the model to accurately detect only true cases of a trajectory (precision), and the harmonic mean of true positive rate and precision which quantifies the balance between true positive rate and precision (F1 Score) (Sokolova & Lapalme, Reference Sokolova and Lapalme2009). The possible values range from 0 to 1, with 1 representing perfect performance and 0 representing worst possible performance. Overall performance measures were calculated using micro- and macro-averaging techniques. Micro-averaging gives each observation in the test dataset an equal influence on the performance metric, while macro-averaging gives each class (or trajectory) an equal influence on the performance metric. Performance metrics by trajectory were calculated by modeling the results as one-vs-rest binary classification with the trajectory of interest being considered the positive class and all other classes being considered the negative class, including data visualizations for ROC curves along with area under the curve for each trajectory (Mathew et al., Reference Mathew, Kshirsagar, Abidin, Griffin, Kanarachos, James and Fitzpatrick2023). This method of plotting one-vs-rest ROC curves and calculating AUC by trajectory provided insight into the model’s ability to rank order estimated probability of class assignment to the trajectory of interest as opposed to any of the other three trajectories. Lastly, the rankings for the top ten variables are reported for the Elastic Net, Random Forest, and XGBoost algorithms. Variable importance results provided insight into the relative influence of each predictor on the final model’s predictions (Bartoszuk & Gagolewski, Reference Bartoszuk and Gagolewski2020). The top ten important variables were obtained using the “vip” package in R (Greenwell & Boehmke, Reference Greenwell and Boehmke2020). Machine learning analyses were conducted in R version 4.2.2.
Results
Irritability trajectories
Prior to latent growth curve analysis, we first tested the longitudinal measurement invariance of the CBCL irritability scale over time. Specifically, we conducted a series of confirmatory factor analyses to test configural, metric, scalar, and strict invariance, allowing correlated residuals between identical items at adjacent timepoints (for results, see Supplementary Table 1). Global model fit was evaluated by the following criteria: CFI ≥ 0.90, TLI ≥ 0.90, RMSEA ≤ 0.08, SRMR ≤ 0.08 (Sathyanarayana & Mohanasundaram, Reference Sathyanarayana and Mohanasundaram2024), although a CFI > 0.95 is preferred (Hu & Bentler, Reference Hu and Bentler1999). As shown in Supplementary Table 1, the configural, metric, and scalar models are all above the less conservative threshold of CFI ≥ 0.90. Longitudinal measurement invariance was assessed based on Δ CFI ≤ 0.010, Δ RMSEA ≤0.015, Δ SRMR ≤ 0.030 for metric invariance, and Δ SRMR ≤ 0.010 for scalar invariance (Chen, Reference Chen2007; Cheung & Rensvold, Reference Cheung and Rensvold2002). Results supported longitudinal measurement invariance at the configural, metric, and scalar levels. Scalar invariance is considered sufficient support for further analysis (Tse et al., 2024). Thus, we proceeded with latent class growth analyses to identify youth irritability trajectories.
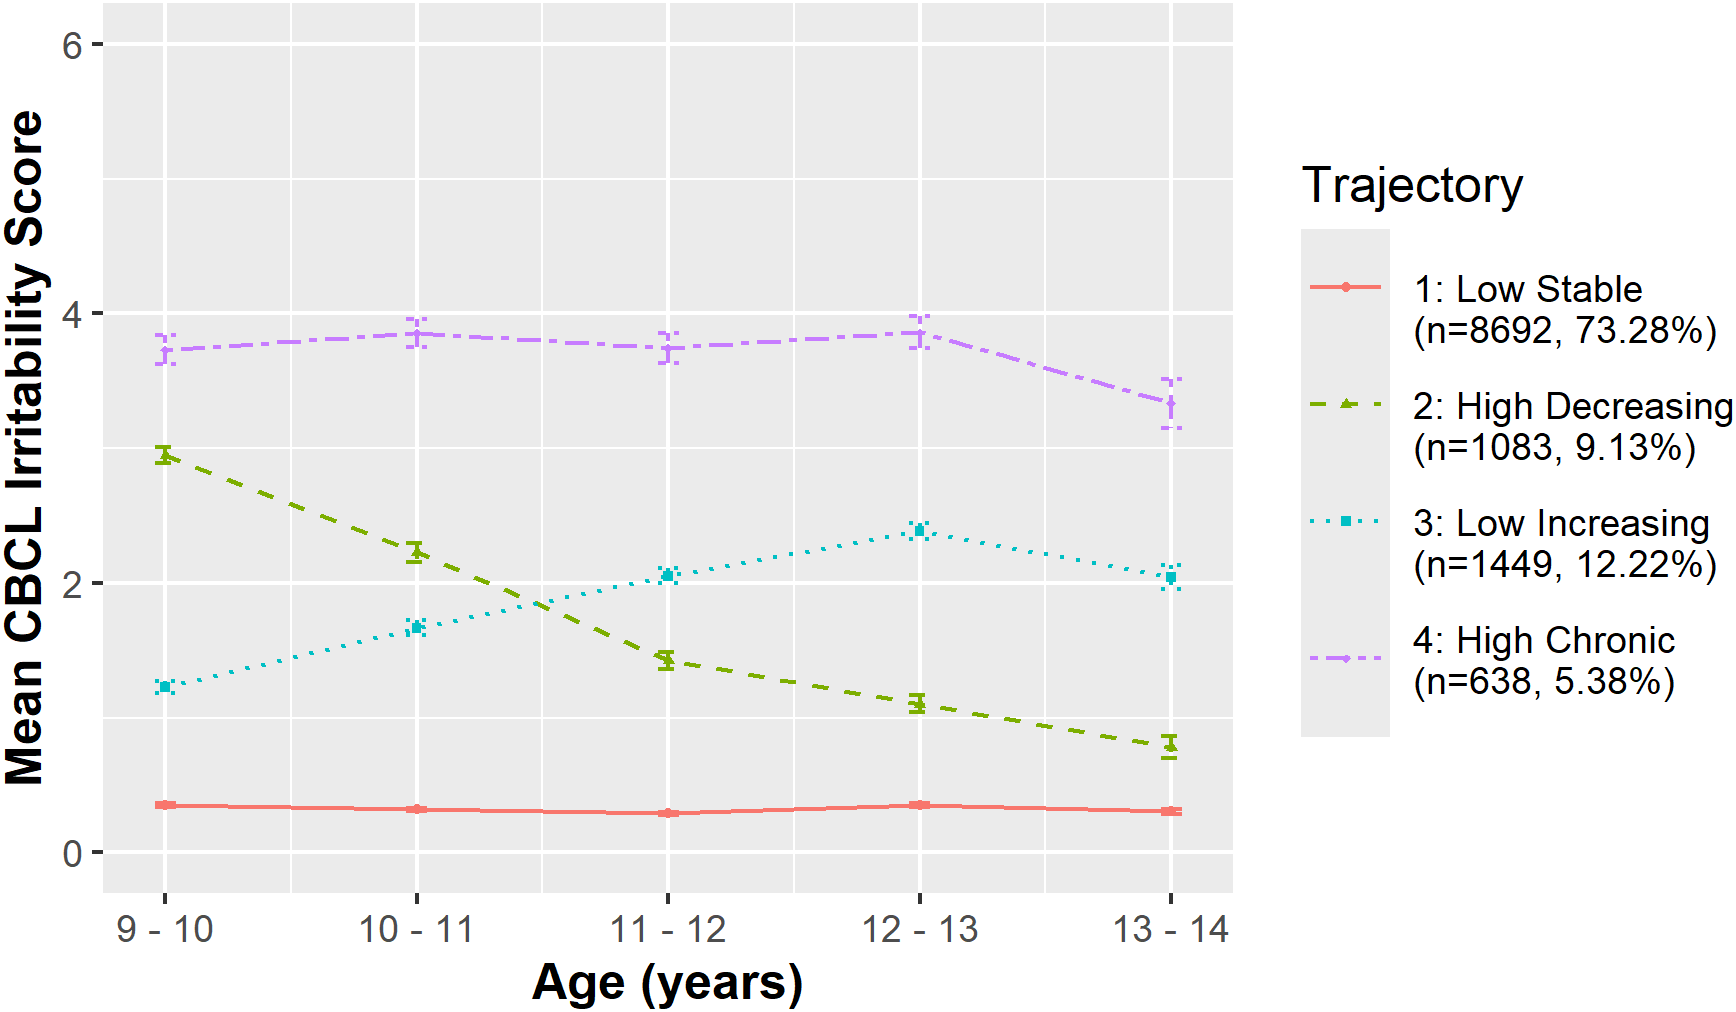
Model-fit indices for the latent class growth analyses, including AIC, BIC, and SSABIC, indicated better fit as the number of classes increased. All models resulted in entropy > 0.8 indicating acceptable accuracy. Models with two, three, and four classes resulted in significant Lo-Mendell-Rubin Adjusted LRT Tests suggesting that the previous model should be rejected in favor of the model with more classes (Nyland-Gibson & Choi, Reference Nylund-Gibson and Choi2018). However, the five-class model had a non-significant Lo-Mendell-Rubin Adjusted LRT Test indicating that the four-class model cannot be rejected in favor of the five-class model (See Table 3). We observed the same pattern of model-fit indices, entropy, and Lo-Mendell-Rubin Adjusted LRT Test as the number of classes increased for both the linear and quadratic models. The quadratic classes produced smaller AIC, BIC, and SSABIC for each model in comparison to the linear models with the same number of classes, indicating better fit for the trajectories with quadratic components (See Supplementary Table 2). Moreover, quadratic components were significant for each of the four trajectories (See Supplementary Table 3). Thus, we selected the four-class latent growth curve model with quadratic components. The four-class model differentiated growth trajectories in irritability into classes that were characterized as (1) low stable (n = 8,692, 73.28%), (2) high decreasing (n = 1,083, 9.13%), (3) low increasing (n = 1,449, 12.22%), and (4) high chronic (n = 638, 5.38%). Model results are detailed in Supplementary Table 3 and illustrated in Figure 1.
Irritability trajectories across the transition to adolescence in ABCD sample.

Model-fit statistics for quadratic models of irritability trajectories

Table 3. Long description
A table with six columns and five rows comparing model-fit statistics for quadratic models of irritability trajectories. The columns are Number of classes, AIC, BIC, SSABIC, Entropy, and Lo-Mendell-Rubin adjusted LRT test with Value, p, and n (%) of smallest class. Row 1: Number of classes, 2; AIC, 137,574.62; BIC, 137,641.05; SSABIC, 137,612.44; Entropy, 0.91; Value, 19,834.60; p, <.01; n (%) of smallest class, 2,564 (21.62). Row 2: Number of classes, 3; AIC, 135,352.24; BIC, 135,440.81; SSABIC, 135,402.68; Entropy, 0.90; Value, 4,999.43; p, <.01; n (%) of smallest class, 655 (5.52). Row 3: Number of classes, 4; AIC, 133,457.94; BIC, 133,576.03; SSABIC, 133,525.19; Entropy, 0.89; Value, 1,852.92; p, <.01; n (%) of smallest class, 638 (5.38). Row 4: Number of classes, 5; AIC, 132,274.06; BIC, 132,421.68; SSABIC, 132,358.12; Entropy, 0.88; Value, 1,160.94; p, .15; n (%) of smallest class, 291 (2.45).
Note: Model-fit indices include Akaike Information Criterion (AIC), Bayesian Information Criteria (BIC), and Sample Size Adjusted Bayesian Information Criterion (SSABIC).
Demographic information for each irritability trajectory group is presented in Supplementary Table 4. We conducted Rao-Scott design-corrected chi-square tests to evaluate whether trajectory classification was associated with sex or parental education and subsequently applied pairwise proportion tests with a Bonferroni correction. The irritability trajectory groups significantly differed by youth sex, χ 2 (3, N = 11,862) = 21.44, p < .001, and parental education, χ 2 (3, N = 11,848) = 34.27, p < .001. Relative to their male peers, female youth were disproportionately more likely to be classified in the low stable trajectory, χ 2 (1) = 11.62, p < .01. Conversely, male youth were more likely to be classified as either high decreasing, χ 2 (1) = 7.86, p = .02, or high chronic, χ 2 (1) = 11.78, p < .01, as compared to females. In comparison to youth whose parents did not have a 4-year college degree, youth having at least one parent who obtained a 4-year college degree or higher were more likely to be classified as following a low increasing trajectory, χ 2 (1) = 11.76, p < .01, whereas they were less likely to follow a high decreasing trajectory, χ 2 (1) = 10.96, p < .01, or a high chronic trajectory, χ 2 (1) = 14.07, p < .01.
Machine learning results
The proportions of the machine learning sample classified to each irritability trajectory were nearly identical to the proportions in the full sample: low stable (n = 8,125, 73.64%), high decreasing (n = 988, 8.95%), low increasing (n = 1,339, 12.14%), high chronic (n = 582, 5.27%). The Boruta feature selection procedure confirmed 51 predictors from the full set of 82 candidate features as potentially relevant. Refer to Tables 1 and 2.
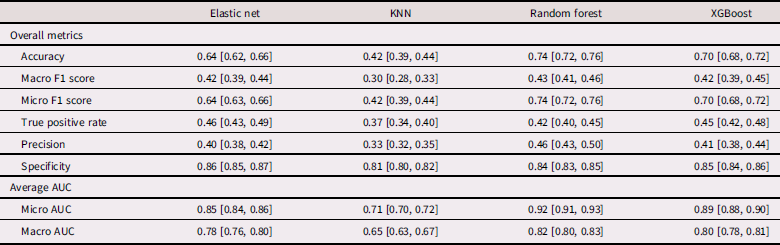
Model performance varied by both algorithm and performance metric. Overall, the Elastic Net, Random Forest, and XGBoost algorithms achieved similar performance, while the KNN algorithm exhibited poorer performance. For example, Random Forest achieved the highest accuracy with a value of 0.74, which was slightly better than the accuracy achieved through the XGBoost algorithm (0.70) and through the Elastic Net algorithm (0.64), whereas the KNN algorithm resulted in the lowest accuracy with a value of 0.42. A similar pattern emerged from the macro F1 scores, such that the Elastic Net, Random Forest, and XGBoost algorithms exhibited similar performance, whereas the KNN algorithm resulted in the lower macro F1 score. See Table 4 for details.
Performance metrics for machine learning models

Table 4. Long description
The table compares the performance metrics of four machine learning algorithms: Elastic net, KNN, Random forest, and XGBoost. It has 11 rows and 5 columns. The columns are labeled Elastic net, KNN, Random forest, and XGBoost. The rows are grouped into Overall metrics and Average AUC. The metrics include Accuracy, Macro F1 score, Micro F1 score, true positive rate, Precision, Specificity, Micro AUC, and Macro AUC. Each cell contains values representing the performance of the algorithms on the respective metrics. For example, the Accuracy values are 0.64 for Elastic net, 0.42 for KNN, 0.74 for Random forest, and 0.70 for XGBoost. The table provides a detailed comparison of how each algorithm performs across different metrics.
Note: Values are performance metrics with 95% confidence intervals in brackets. True positive rate, precision, and specificity are macro scores. Area Under the Curve (AUC).
Separate calculations of true positive rate and precision for each trajectory revealed differences in performance across the set of algorithms. For example, XGBoost produced the highest true positive rate for the high chronic trajectory (0.56). On the other hand, Random Forest had the highest true positive rate for both the low stable trajectory (0.92) and the high decreasing trajectory (0.28). Finally, KNN generated the highest true positive rate for the low increasing trajectory (0.38). In terms of precision, the Random Forest algorithm had the highest precision for the three minority trajectories: high decreasing (0.28), low increasing (0.28), and high chronic (0.46), whereas the Elastic Net algorithm had the highest precision for the low stable trajectory (0.90). See Supplementary Table 5.
Visual inspection of the ROC Curves for each trajectory revealed similar patterns for the Elastic Net, Random Forest, and XGBoost algorithms. The ROC curves indicated that classification of the high chronic trajectory has the best tradeoff between true positive rate and false positive rate across the range of thresholds. The low stable trajectory had the next best tradeoff between true positive rate and false positive rate, while the two trajectories with change in irritability overtime were more difficult to accurately classify. The ROC curve for the low increasing trajectory was closest to the diagonal line for all algorithms indicating the poorer tradeoff between true positive rate and false positive rate. See Supplementary Table 5 and Supplementary Figure 1 for details.
Baseline predictors
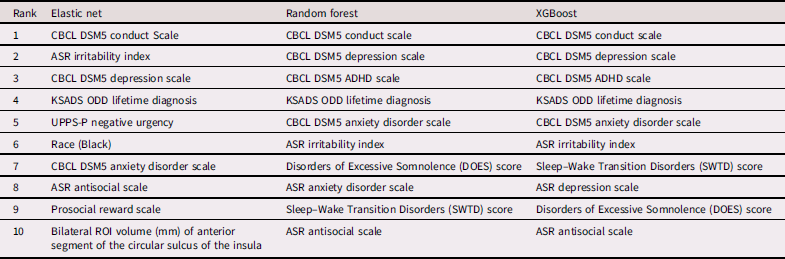
The CBCL DSM-5 Conduct Scale was consistently ranked as the most important predictor by Elastic Net, Random Forest, and XGBoost. All three algorithms identified predictors from the youth psychopathology domain (CBCL Depression Scale, CBCL Anxiety Disorder Scale, and KSADS lifetime diagnosis of ODD) and predictors from the parent psychopathology domain (ASR irritability index and ASR antisocial index) among the top ten predictors. Four additional predictors were uniquely selected as top ten predictors by the Elastic Net algorithm: Negative Urgency Scale, Black race, Prosocial Reward Scale, and bilateral structural MRI volume for the circular sulcus of the insula. Three predictors were identified by both the Random Forest and XGBoost algorithms: CBCL Attention Deficit Hyperactivity Disorder (ADHD) Scale, Sleep–Wake Transition Disorders (SWTD) Score, and Disorders of Excessive Somnolence (DOES) Score. Lastly, the Random Forest and XGBoost algorithms each uniquely identified another predictor from the parent psychopathology domain. Specifically, Random Forest ranked the Adult Self Report (ASR) anxiety disorder score among the top ten important predictors, whereas XGBoost ranked the ASR depression score among the top ten important predictors. See Table 5 for details.
Top ten predictors by algorithm for machine learning models

Table 5. Long description
A table titled ‘Top ten predictors by algorithm for machine learning models’ with four columns: Rank, Elastic net, Random forest, and XGBoost. The table has ten rows, each representing a different rank from 1 to 10. Each row lists the top predictors identified by the Elastic net, Random forest, and XGBoost algorithms. The predictors include various scales and diagnoses from youth and parent psychopathology domains, as well as other specific predictors. For example, the CBCL DSM-5 Conduct Scale is ranked first by all three algorithms. The Elastic Net algorithm uniquely includes predictors like the Negative Urgency Scale and bilateral structural MRI volume. The Random Forest and XGBoost algorithms share some predictors but also have unique ones, such as the ASR anxiety disorder score for Random Forest and the ASR depression score for XGBoost.
Note: Abbreviations in the top predictors include: Attention Deficit Hyperactivity Disorder (ADHD), Adult Self Report (ASR), Child Behavior Checklist (CBCL), Kiddie Schedule for Affective Disorders and Schizophrenia (KSADS), Oppositional Defiant Disorder (ODD), Region of Interest (ROI), and Urgency-Premeditation-Perseverance-Sensation Seeking-Positive Urgency (UPPS-P).
A supplementary analysis was conducted to evaluate model performance when only behavioral predictors were included. Results are reported in the Supplementary Materials and presented in Supplementary Tables 6–8 and Supplementary Figure 2.
Discussion
The current study identified distinct trajectories of youth irritability across the transition to early adolescence and top preadolescent predictors of the course of irritability using multiple machine learning methods. We identified four developmental trajectories for youth irritability assessed annually from preadolescence to early adolescence in the ABCD sample: low stable (n = 8,692, 73.28%), high decreasing (n = 1,083, 9.13%), low increasing (n = 1,449, 12.22%), and high chronic (n = 638, 5.38%). The four irritability trajectories illustrate differential longitudinal patterns in irritability severity as youth enter early adolescence, which is a sensitive developmental stage characterized by an increase in the onset of mental health disorders (Solmi et al., Reference Solmi, Radua, Olivola, Croce, Soardo, Salazar de Pablo and Fusar-Poli2022). Specifically, the high chronic trajectory signals a high level of risk that persists from preadolescence into early adolescence. The low increasing trajectory indicates a moderate level of risk that exacerbates from preadolescence into early adolescence. Conversely, the high decreasing trajectory shows a mitigation of risk during the transition to early adolescence. Lastly, the low stable trajectory represents normative, low-risk levels of youth irritability throughout this developmental transition period. These irritability trajectories reflect previous findings in the irritability trajectory literature, which has consistently indicated that there is heterogeneity in the developmental course of irritability (e.g., Riglin et al., Reference Riglin, Eyre, Thapar, Stringaris, Leibenluft, Pine and Thapar2019; Wiggins et al., Reference Wiggins, Mitchell, Stringaris and Leibenluft2014; Yu et al., Reference Yu, Hodgdon, Kryza-Lacombe, Osuna, Bozzetto, Ciro and Wiggins2023b).
Three of the four supervised machine learning algorithms that we applied to predict youth irritability trajectories using a broad spectrum of baseline predictors achieved comparable performance, in contrast to substantially poorer predictive performance of the KNN algorithm. Further review showed variation in performance by trajectory. The algorithms were best at detecting the two trajectories that consistently fell on the extreme ends of the irritability range (low stable and high chronic). Specifically, the low stable trajectory had the highest true positive rate and precision across all algorithms indicating that the models could accurately identify true cases of this trajectory without a substantial excess of false positive predictions. The one-vs-rest measures (ROC curves and area under the curve) for the Elastic Net, Random Forest, and XGBoost algorithms illustrated a strength in differentiating the high chronic trajectory from the other three trajectories. On the other hand, the two irritability trajectories characterized by change in irritability over time (high decreasing and low increasing) were more challenging to accurately differentiate from the other trajectories for all algorithms using our set of preadolescent predictors. While the machine learning models were designed to differentiate between the four youth irritability trajectories, the strengths and weaknesses in performance inform cautious interpretation of the top predictors. Specifically, the top predictors likely provide more insight into identifying the high chronic and low stable trajectories with limited insight into identifying the low increasing and high decreasing trajectories.
Variable importance metrics revealed that the majority of the top predictors were from the youth psychopathology domain, particularly parent-report CBCL symptom scales. Notably, the CBCL DSM-5 Conduct Problems Scale was consistently identified as the most important predictor for irritability trajectory regardless of algorithm. We also observed CBCL ADHD, lifetime diagnosis of oppositional defiant disorder (ODD), and negative urgency (impulsivity) as top predictors, which is consistent with previous findings linking externalizing problems with youth irritability (e.g., Leadbeater & Homel, Reference Leadbeater and Homel2015). Internalizing symptoms on the CBCL (depression, anxiety disorder) also ranked among the top-ranked predictors for irritability trajectory, in accordance with prior research that found reciprocal effects between youth irritability and internalizing symptoms (Leadbeater & Homel, Reference Leadbeater and Homel2015; Savage et al., Reference Savage, Verhulst, Copeland, Althoff, Lichtenstein and Roberson-Nay2015). The literature strongly supports youth irritability as an antecedent to later psychopathology with some studies expanding on our knowledge with findings of bidirectional associations between externalizing and internalizing symptoms and youth irritability over time (Chad-Friedman et al., Reference Chad-Friedman, Galano, Lemay, Olino, Klein and Dougherty2023). The current study indicates that preadolescent externalizing and internalizing symptoms predict the course of youth irritability, thus adding support for the less studied direction of this bidirectional association; nevertheless, our analyses cannot confirm the directionality, only temporal precedence of assessment.
Top predictors for youth irritability trajectory spanned domains beyond youth psychopathology, including parent psychopathology, youth physical health, demographics, and environment and culture. Among these domains, parental irritability was consistently the highest ranked, providing empirical evidence of familial liability for irritability specifically. The youth irritability literature indicates that irritability may be transmitted from parent to child through genetic risk factors (Roberson-Nay et al., Reference Roberson-Nay, Leibenluft, Brotman, Myers, Larsson, Lichtenstein and Kendler2015) and family environment (Sorcher et al., Reference Sorcher, Mennies, Robeson, Seeley, Klein, Dougherty and Olino2023; Wiggins et al., Reference Wiggins, Mitchell, Stringaris and Leibenluft2014). Parental antisocial symptoms and parental depression were also identified as top predictors. These top predictors align with prior research indicating that parent psychopathology can increase risk for youth irritability (Dougherty et al., Reference Dougherty, Smith, Bufferd, Stringaris, Leibenluft, Carlson and Klein2013; Roberson-Nay et al., Reference Roberson-Nay, Leibenluft, Brotman, Myers, Larsson, Lichtenstein and Kendler2015; Sorcher et al., Reference Sorcher, Mennies, Robeson, Seeley, Klein, Dougherty and Olino2023; Wiggins et al., Reference Wiggins, Mitchell, Stringaris and Leibenluft2014; Yu et al., Reference Yu, Hernandez, Swineford, Walker, MacNeill, Zhang and Wiggins2023a). Specifically, parental history of depression predicts youth irritability (Dougherty et al., Reference Dougherty, Smith, Bufferd, Stringaris, Leibenluft, Carlson and Klein2013; Sorcher et al., Reference Sorcher, Mennies, Robeson, Seeley, Klein, Dougherty and Olino2023; Wiggins et al., Reference Wiggins, Mitchell, Stringaris and Leibenluft2014). Although to our knowledge no prior studies have found an association between parental antisocial behavior and youth irritability, a twin study, spanning preadolescence to late adolescence, reported shared genetic influence between irritability and antisocial behavior (Mikolajewski et al., Reference Mikolajewski, Taylor and Iacono2017).
Multiple methods (Random Forest and XGBoost) highlighted the importance of two predictors from the youth sleep disturbance measure, specifically excessive somnolence or sleepiness and sleep–wake transition (i.e., difficulty falling or staying asleep). In particular, youth in the low stable trajectory tended to have lower sleep disturbance scores as compared to youth in any of the other three trajectories, with youth in the high chronic trajectory exhibiting the highest sleep disturbance scores. Prior research has found a bidirectional association between sleep duration and daily irritability such that shorter sleep duration was correlated with higher irritability symptoms in youth ages 8–18 (Meigs et al., Reference Meigs, Kiderman, Kircanski, Cardinale, Pine, Leibenluft and Naim2024). The present findings highlight two features of sleep, somnolence and sleep–wake transition, that warrant further investigation into their association with the course of irritability during the transition to early adolescence.
In addition, one algorithm (Elastic Net) uniquely identified two other top predictors from the environment and demographic domains, respectively. These top predictors for the Elastic Net model included the Prosocial Reward Subscale from the School Risk and Protective Factors and race (Black or African American). Prosocial behavior has been linked to positive mental health outcomes (Oberle et al., Reference Oberle, Ji and Molyneux2023). Trajectories with lower preadolescent irritability (low stable and low increasing) had slightly higher prosocial reward, suggesting that this school-level variable may be a potential protective factor as well as a possible target for intervention. From the demographic domain, a higher proportion of Black or African American youth, as compared to White youth, were classified in the low stable trajectory, which is consistent with a previous sample (Yu et al., Reference Yu, Hodgdon, Kryza-Lacombe, Osuna, Bozzetto, Ciro and Wiggins2023b). The diversity of domains represented among the top predictors demonstrates the importance of a comprehensive clinical evaluation to identify youth at high risk.
The top ten important predictors were dominated by behavioral and clinical variables with only one algorithm selecting one structural MRI variable as the tenth-ranked predictor. Specifically, the Elastic Net algorithm indicated that structural volume of the anterior segment of the circular sulcus of the insula may be an important biomarker for irritability trajectories. Structural neuroimaging research has found a concurrent association between higher youth irritability (ages 9.1–13.9) and larger right insula volume (Dennis et al., Reference Dennis, Humphreys, King, Thompson and Gotlib2019). As only one algorithm identified this region as a top predictor indicating that further research is needed. The paucity of structural MRI variables among the top predictors of the current models is consistent with prior work that has found that psychometric and behavioral variables outperform structural MRI variables in predicting adolescent mental health outcomes (Chavanne et al., Reference Chavanne, Paillère Martinot, Penttilä, Grimmer, Conrod, Stringaris and Artiges2023; Whelan et al., Reference Whelan, Watts, Orr, Althoff, Artiges, Banaschewski and Garavan2014). It is likely that common method variance increased the relevance of variables obtained from questionnaires, particularly parent-report measures, over the relevance of neurobiological variables because the irritability trajectories were ascertained from caregiver-reported CBCL.
The current report has several strengths. The use of a large, racially diverse sample enabled us to apply data-driven methods during a critical developmental transition to early adolescence. Moreover, the wide range of predictors that were used in the machine learning analyses provides avenues for future research and may increase the generalizability of our results. Despite these strengths, there are some noteworthy limitations that can inform future research directions. First, this study relied on annual reports of caregiver-rated youth irritability using the three-item CBCL irritability index. Future research could improve the measure of irritability by integrating youth report and multidimensional measures of irritability. Second, this study included annual assessments from preadolescence to early adolescence and future research is needed to extend the assessments into adolescence and early adulthood. Third, although we were careful not to include any items that overlap between the CBCL irritability scale and the other CBCL scales used as baseline predictors, we recognize that irritability is a symptom in several diagnoses including oppositional defiant, depressive, and anxiety disorders. Thus, it is possible that irritability symptoms occurring within these baseline diagnoses may influence our results; however, because only one diagnosis with irritability as a symptom made it to the top 10 predictors (lifetime ODD diagnosis), item overlap does not appear to be driving our findings. Nevertheless, future research should investigate whether a lifetime diagnosis of ODD with or without irritable mood differentially predicts the course of irritability or influences its rank as a predictor. Fourth, the machine learning models showed modest performance in predicting irritability trajectories. The limitations of the machine learning models bring to light new research questions for further investigation. Specifically, poorer classification of the low increasing and high decreasing trajectories suggests that the preadolescent predictors were insufficient at differentiating these trajectories from the others. Research that incorporates distal and proximal factors across development may improve predictive accuracy and discover important predictors for youth irritability trajectories. Additionally, future research could build binary machine learning models that discriminate between the high chronic and high decreasing and low stable and low increasing trajectories respectively. Furthermore, better true positive rate and precision for the low stable trajectory as compared to the other trajectories suggests more homogeneity in the low-risk group. In contrast, the high-risk groups may be characterized by more heterogeneity across risk factors. Future research could investigate whether there are different risk profiles within each of the high-risk trajectories. Finally, the data-driven approaches applied in this work offer advantages for analyzing large datasets and building predictive models; however, it is crucial to follow up with more targeted research to assess specific hypotheses and expand on this research.
In conclusion, this report expanded on the irritability trajectory literature by characterizing irritability trajectories across the developmental transition from preadolescence to early adolescence in a large, national sample. Subsequently, we applied a robust machine learning approach with multiple methods which enabled us to evaluate a broad set of predictors of the course of irritability during a crucial developmental period. Machine learning methods are data-driven, exploratory approaches designed for prediction rather than the identification of causal associations. However, examining the predictors that contribute most strongly to model performance can help researchers generate new hypotheses and identify variables that may be incorporated into developmental theory following additional confirmatory research (Van Lissa, Reference Van Lissa2023). Thus, our top predictors warrant further investigation to identify their role in the course of high-risk irritability. It is possible that some may serve as potential targets for intervention and prevention efforts to alter the course of high-risk irritability trajectories.
Supplementary material
The supplementary material for this article can be found at https://doi.org/10.1017/S0954579426101977.
Data availability statement
Data for the current study were from the Adolescent Brain Cognitive Development (ABCD) Study. De-identified data from the ABCD Study are available to qualified researchers through the NIMH Data Archive (NDA). To request access, submit a Data Access Request (DAR) through the ABCD Study website (abcdstudy.org) in accordance with the instructions described at https://nda.nih.gov/abcd/request-acess. Code available upon request.
Acknowledgements
Data used in the preparation of this article were obtained from the Adolescent Brain Cognitive DevelopmentSM (ABCD) Study (https://abcdstudy.org), held in the NIMH Data Archive (NDA). This is a multisite, longitudinal study designed to recruit more than 10,000 children age 9–10 and follow them over 10 years into early adulthood. The ABCD Study® is supported by the National Institutes of Health and additional federal partners under award numbers U01DA041048, U01DA050989, U01DA051016, U01DA041022, U01DA051018, U01DA051037, U01DA050987, U01DA041174, U01DA041106, U01DA041117, U01DA041028, U01DA041134, U01DA050988, U01DA051039, U01DA041156, U01DA041025, U01DA041120, U01DA051038, U01DA041148, U01DA041093, U01DA041089, U24DA041123, U24DA041147. A full list of supporters is available at https://abcdstudy.org/federal-partners.html. A listing of participating sites and a complete listing of the study investigators can be found at https://abcdstudy.org/consortium_members/. ABCD consortium investigators designed and implemented the study and/or provided data but did not necessarily participate in the analysis or writing of this report. This manuscript reflects the views of the authors and may not reflect the opinions or views of the NIH or ABCD consortium investigators.
We acknowledge the support of the University of Maryland Baltimore, Institute for Clinical & Translational Research (ICTR) and the University of Maryland Strategic Partnership: MPowering the State (MPower), which provided training and educational stipend (LSJ).
Funding statement
Research reported in this publication was supported by the National Institute of Mental Health under award number R01MH122487 (MPIs: Wiggins, Dougherty).
Competing interests
The authors declare no competing interests to declare.
Pre-registration statement
The analytic plan was pre-registered (https://doi.org/10.17605/OSF.IO/GE3XC) prior to conducting this research [December 22, 2021]. Due to the data-driven nature of this study no a priori hypotheses were made. Given the comprehensive nature of the preregistration, the findings will be disseminated across multiple papers, of which this is one.




 Open access

