Large natural disasters sometimes have substantial and persistent impacts on economies. For example, the Lisbon Earthquake in 1755 not only changed prices and wages, but also led to more mercantilist-type policies argued to have improved the long-run performance of the Portuguese economy (Pereira Reference Pereira2009).Footnote 1 For Japan, the Great Kanto Earthquake in 1923 changed the spatial distribution of industries and resulted in the development of a new industrial agglomeration (Imaizumi, Ito, and Okazaki Reference Imaizumi, Ito and Okazaki2016). Thus, while the Lisbon Earthquake and the Great Kanto Earthquake were very damaging disasters, they also arguably had positive long-run impacts on the economy.
Positive long-run impacts of natural disasters have been extensively studied over the last decade. Much of the work has tried to disentangle two countervailing forces. On the one hand, there is the destruction of physical and human capital and the inherent negative disruptions to normal economic activity. On the other hand, natural disasters offer opportunities to shed less efficient firms, upgrade technologies and production techniques that may have otherwise been retained for substantially longer. These latter consequences arguably fall within a process that was originally coined by Joseph Schumpeter (Reference Schumpeter1942, pp. 82–85) as “creative destruction.”Footnote 2
The possibility of creative destruction provides a new perspective in the historical research on the implications of natural disasters. After WWI, the Japanese economy was struggling to upgrade its industrial structure in the face of harsh international competition and prolonged depression. In addition, the Japanese economy in this period was characterized by the emergence of the “dual structure” between large firms and small- and medium-sized enterprises (Nakamura and Feldman Reference Nakamura and Feldman1983; Flath Reference Flath2005).Footnote 3 The shift in the spatial distribution of industries as a result of the Great Kanto Earthquake noted earlier may have also involved the upgrading of factories and equipment. This issue of post-natural disaster upgrading has, to our knowledge, not yet been explored in the economic history literature. Here, we explicitly investigate the possibility of creative destruction due to damage suffered in the Great Kanto Earthquake. Our hypothesis is that the damage due to the earthquake may have provided a unique opportunity for affected firms to upgrade their technology, but that this process was conditional on firms being a large enough size to access financial resources and be able to afford the upgrade.
This article also contributes more generally to the literature on creative destruction after natural disasters. Despite a large body of literature on this topic, the evidence is at best mixed with most studies finding, if anything, small negative effects, although a handful also find some small positive effects.Footnote 4 In terms of existing firm-level studies, there are hints at the possibility of some creative destruction after natural disasters. For instance, Andrea Leiter, Harald Oberhofer, and Paul Raschky (Reference Leiter, Oberhofer and Raschky2009) find that European firm employment growth is higher in regions that experienced major floods. In a study of Japanese manufacturing firms after the 1995 Kobe Earthquake, Matthew Cole et al. (Reference Cole, Elliott and Okubo2019) provide evidence that labor productivity increased in surviving firms. Importantly, however, neither of these studies had a direct measure of technology upgrading or change in production processes and, thus, were only able to infer creative destruction. In our context, because production processes during this period were less complex, we can clearly measure the upgrading of production technologies and processes, and, hence, potentially link it directly to the earthquake. For the purpose of our study, we focus on manufacturing firms in Yokohama City, the largest port city close to Tokyo, both because Yokohama City was very seriously damaged by the Great Kanto Earthquake and because of the availability of data.
DAMAGES TO AND RECOVERY OF THE INDUSTRIES IN YOKOHAMA CITY
Background
Yokohama City is located south of Tokyo and is one of the oldest port cities in Japan. It currently has the second-largest population in Japan with 3.6 million people.Footnote 5 From a historical viewpoint, Yokohama has played a crucial role in Japanese economic growth, with the opening of the country to trade during the 1850s and 1860s. The U.S.–Japan Treaty of Army and Commerce of 1858 forced Japan to trade with foreign countries and open several ports. Yokohama (Kanagawa) was one of the earliest such trade ports.
Daniel Bernhofen and John Brown (Reference Bernhofen and Brown2005) argued that Japan experienced a dramatic change in economic structure with the opening of trade, inducing the formation of industrial clusters. More specifically, Japan started exporting silk and tea in this early period, for which Yokohama served as the main port.Footnote 6 As shown in Figure 1, Yokohama was the largest port for Japanese exports until the Great Depression of 1929. Thus Yokohama was the center of several advanced industries: manufacturing firms, financial sectors, wholesalers, retailers, trading companies, and transportation companies. Yokohama also had a major silk market and was connected via railways to central Tokyo. By 1920, Yokohama’s population was 420,000, spread over 39.27 square km, and was the sixth largest city in Japan.Footnote 7 Because of its growing industrial development, Yokohama also became the center of manufacturing clusters after the Industrial Revolution of the 1910s and 1920s.
EXPORTS OF INTERNATIONAL PORTS (UNIT: NOMINAL YEN)

Overview
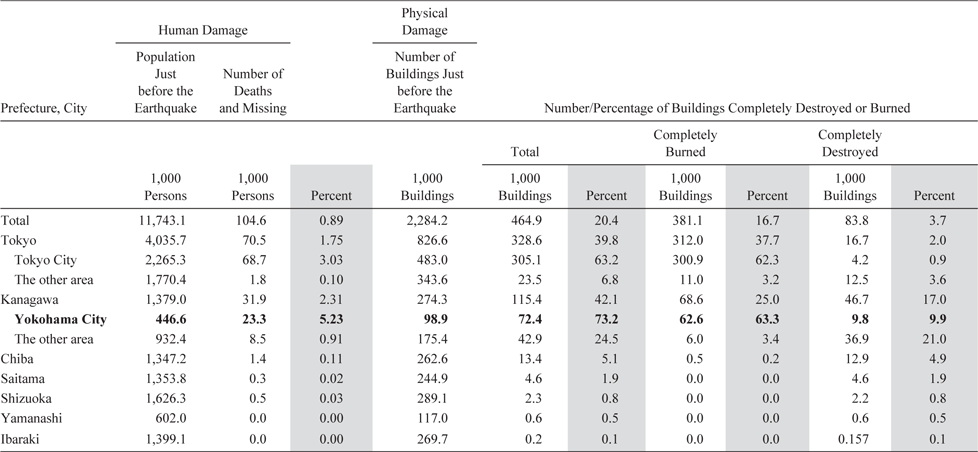
On 1 September 1923, an earthquake with the magnitude of 7.9 hit the center of Japan. The total number of dead and missing is estimated to be more than 100,000, and the destruction of assets is believed to be around 35 percent of Japan’s GNP (Imaizumi, Ito, and Okazaki Reference Imaizumi, Ito and Okazaki2016). Indeed, it is believed that it was the most serious natural disaster that Japan had experienced to the present. In Table 1, we summarize the damage by prefecture/city. The damage was concentrated in two prefectures, Tokyo and Kanagawa. While the damage in Tokyo Prefecture, especially in Tokyo City, has been widely publicized, the scale of the damage in Yokohama City in Kanagawa Prefecture, when standardized by the population and the number of buildings, was actually larger than in Tokyo City. In Yokohama City, 5.23 percent of the people were dead or missing, and 63.3 percent of the buildings were completely burned and 9.9 percent were completely destroyed, whereas in Tokyo City 3.03 percent of the people died or were missing and 62.3 percent of the buildings were completely destroyed and 0.9 percent burned.
DAMAGE BY THE GREAT KANTO EARTHQUAKE

Source: Tokyo City Government (1925, pp. 160–63).
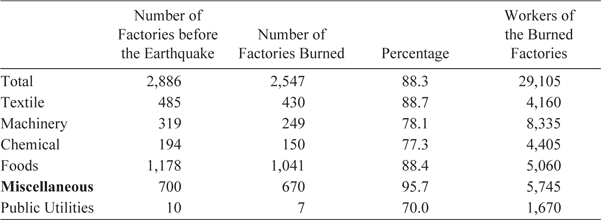
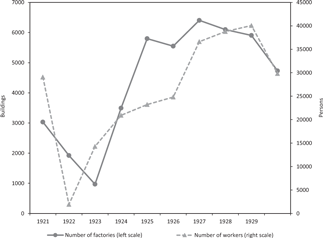
In the immediate aftermath of the earthquake, Yokohama City Office conducted a survey of the damage to those manufacturing factories with 20 or more employees. As shown in Table 2, 88.3 percent of manufacturing factories were destroyed. The seriousness of the damage can also be observed in Figure 2 in which both the number of factories and workers declined sharply from 1921 to 1923.Footnote 8 At the same time, it is also notable that the number of manufacturing factories and workers recovered swiftly. More precisely, by 1924 the number of manufacturing factories exceeded that in 1921. It took until 1927 for unemployment to recover.

DAMAGE ON THE MANUFACTURING INDUSTRIES IN YOKOHAMA CITY AND RECOVERY

There was large variation in both the extent of damage and recovery.Footnote 9 On the one hand, some factories sustained serious damage and stayed closed. For example, The Yokohama Spinning Co. (Yokohama Boseki) factory was destroyed and stayed closed. Japan Veneer Lumbering Co. (Nihon Benia Seizai) was not re-opened but instead requested government aid. On the other hand, Japan Optical Instrument Co. (Nihon Koki Kogyo), while a small part of the factory building and equipment was destroyed and damaged, the production capacity was not compromised and it continued to operate.
What is remarkable in the context of this article is that some of the factories that incurred serious damage overcame these damages and used the shock to undertake new investment. For example, almost the whole of the Yokohama Cable Plant (Yokohama Densen Seizoussho) of Furukawa Electric Co. (Furukawa Denki Kogyo) was burned down, but once the reconstruction work was completed the plant was larger than before the earthquake (Yokohama City Office ed. 1926, p. 411). In addition, Makuzu Gomei, a ceramic company, lost its plant, but reconstructed it with a more ideal kiln (ascending kiln) (p. 410).
Furukawa Electric Co. was a major cable company, owned by Furukawa Zaibatsu, one of the 10 largest Zaibatsu groups (Holding Companies Liquidation Committee 1950, pp. 415–17). The origin of the Furukawa family’s businesses was in copper mining and refining at the Ashio Mine,Footnote 10 but later their businesses were extended to copper processing. In 1908, Furukawa Zaibatsu acquired Yokohama Cable Co., a major manufacturer of covered wire, which was renamed the Furukawa Electric Co. in 1920, merging two of the Furukawa Zaibatsu cable plants (the Nikko Plant in Tochigi Prefecture and the Honjo Plant in Tokyo Prefecture). Furukawa Electric also managed other cable companies affiliated to Furukawa Zaibatsu (Furukawa Electric Co. 1991, pp. 150–51).
The Great Kanto Earthquake caused serious damage to Furukawa’s Yokohama and Honjo plants. This damage was reflected in the decline in the value of fixed assets in the second half of 1923 (see Figure 3). By early 1924, Furukawa Electric decided on a plan of reconstruction, which included a drastic restructuring and reallocation of cable production in Furukawa Zaibatsu. That is, the Yokohama Plant would specialize in high-quality cable, while the Nikko Plant and affiliated companies would specialize in lower-quality cable. In reconstructing the Yokohama Plant, the Zaibatsu purchased new land and reformed the layout of the buildings, so that the whole plant could be managed more efficiently (Furukawa Electric Co. 1991, pp. 150–51), while the Honjo Plant was closed.Footnote 11 The business report of Furukawa Electric stated, “In reconstructing the damaged plants, we are not only recovering them but also completely improving the equipment, with the idea of turning misfortune to good account.”Footnote 12 As shown in Figure 4, its fixed assets and sales recovered and exceeded the level before the earthquake, the return on assets (ROA) was stable, although perhaps not as high.
DAMAGE BY THE EARTHQUAKE AND REVOVERY: FURUKAWA ELECTRIC CO.

DAMAGE BY THE EARTHQUAKE AND RECOVERY: KIRIN BREWERY CO.

The Kirin Brewery Co. was founded in 1907 and acquired The Japan Brewery Co., the oldest beer company in Japan, located in the Yamate area of Yokohama City (Kirin Brewery Co. 1957, p. 55). The Yamate area is in the eastern part of Yokohama City and was a foreign concession until 1899 when the partial treaties between Japan and the Western countries were revised. WWI had provided an opportunity for the Japanese beer industry to develop quality which reduced imports of European products. Indeed, the Kirin Brewery added a new plant in Hyogo Prefecture (Kanzaki Plant), in addition to the original Yokohama Yamate Plant. In May 1923, Kirin Brewery acquired Toyo Brewery Co. adding the Sendai Plant in Miyagi Prefecture to its production capacity.
Just after the acquisition of Toyo Brewery Co., the Great Kanto Earthquake hit Kirin Brewery’s headquarters and the Yokohama Yamate Plant, both of which were almost completely destroyed. The original reconstruction plans revealed that the cost of repairing the plant would be nearly as large as constructing a new plant. Before the earthquake, it was known that the site of the Yokohama Yamate Plant did not have enough room for future expansion. The location was inconvenient in terms of transportation and water supply (Kirin Brewery 1957, p. 93). As a result, the Kirin Brewery decided to move the Yokohama Plant from Yamate to the Namamugi area, which is in the northeastern part of Yokohama City.
In this regard, Kirin Brewery (1957) notes that this relocation was an important step for the development of the company:
“Although it is true that the destruction of Yokohama Yamate Plant was a serious damage to the company, in another perspective this disaster promoted the construction of a new plant with brand new equipment, and thereby resolved the problems of transportation and water supply that we had been long suffering from, and, in turn, has been the basis of the present prosperity. In this sense, looking back, we can say that the benefit from the disaster much more than covered the loss.” (p. 93)
In Figure 4, we summarize the damage to the Kirin Brewery and its recovery. To separate the impact of the earthquake from the effect of the acquisition of the Toyo Brewery Co., which took place in the same year, we aggregated the data of the Kirin Brewery and the Toyo Brewery before the acquisition. In addition, as sales of beer have substantial seasonality, the sales data are depicted as centralized moving averages over two half-years. With the earthquake event, the fixed assets and ROA declined sharply in the second half of 1923. However, the fixed assets increased rapidly from 1924 and by 1926 became twice the size of that before the earthquake. Sales increased only in the late 1920s, possibly reflecting the completion of the new Yokohama Plant in 1926, which introduced equipment from the most advanced Western technology, especially the bottling equipment (Kirin Brewery Co. 1957, p. 104).
Government Policies
In the immediate aftermath of the Great Kanto Earthquake, the government and the Bank of Japan (BOJ) implemented a policy to supply abundant liquidity to the damaged areas. For example, the government legislated the bills payable issued in the damaged area and discounted before 1 September 1923, would be rediscounted by the BOJ, and the government would compensate the losses of the BOJ incurred by this operation up to 100 million yen. Consequently, the BOJ rediscounted bills of 431 million yen (Bank of Japan ed. 1983, pp. 87–91), which was 2.89 percent of Japan’s GNP in 1923. This large liquidity supply focusing on the damaged areas had to mitigate the financial constraints of firms in damaged areas.
In addition to the general liquidity supply, the BOJ supplied funds for specific purposes, such as reconstruction of firms. That is, the BOJ loaned funds to such semipublic banks as Nihon Kangyo Bank and Industrial Bank of Japan, which in turn loaned money to industrial firms for reconstruction (Research Bureau, Bank of Japan 1933, pp. 783–85). Juro Teranishi (Reference Teranishi2011) showed that in Tokyo, Yokohama, and Kobe Cities in 1932, larger firms whose capital was no less than 500,000 yen borrowed 55 percent of funds from banks, whereas the firms whose capital was less than 10,000 yen, borrowed more than 75 percent of their money from organizations and individuals other than banks (p. 293).Footnote 13 This implies that a firm’s accessibility to bank loans depended upon its size, and only larger firms could enjoy the effect of the policy measures taken by the BOJ.
In addition to these emergent financial measures to ease liquidity constraints, the government designed and implemented the Plan for Reconstruction of the Imperial Capital (Teito Fukkō Keikaku). A reconstruction plan for Yokohama City was included in that plan by the request of the Yokohama City Council. The central part of the plan was the recovery of infrastructures and land readjustment. For Yokohama City, before the earthquake, improvement of roads was supposed to be an urgent issue because many of the roads in the city were narrow, winding, and unpaved. Yokohama City Office drew up a plan for road improvement in June 1923 (pre-earthquake). The earthquake provided an opportunity to implement the plan, and by implementing the plan as a part of the reconstruction, roads in Yokohama were substantially improved (Yokohama City Office ed. 1976, pp. 111–12).
The land adjustment was closely related to road improvements. To increase the width of roads and make them straight, it was necessary to acquire more land. To swiftly implement land adjustment, a new law, the Special Law for City Planning was legislated in December 1923, which enabled the central and city governments to enforce land adjustment. In Yokohama City, land of 3.4 km2, which was about one-third of the burned area, was adjusted from 1923 to 1928: 48 percent of the land adjustment was carried out by the central government, while the other 52 percent was implemented by the city government. The basic idea of land adjustment was that landowners provide part of their land for public use without compensation because they will enjoy the benefit of land adjustment. Only in the case where the decrease in the area of private land was larger than 10 percent of the total area of land adjustment was financially compensated by the central government or the city government (Yokohama City Office ed. 1976, pp. 113–15).Footnote 14
DATA
Firm Data
We use unique firm-level data for Yokohama City: Handbook of Manufacturing Firms in Yokohama City (Yokohama-shi Kogyo Meikan), by the Bureau of Manufacturing and Commerce of Yokohama City Office (Yokohama Shiyakusho, Shoukou-ka).Footnote 15 Only data for two years, 1921 and 1925, are available (as of the end of December), but these conveniently cover pre- and post-earthquake points in time. The dataset includes information on firm name, main product, address, owner’s name, founding year, and horsepower of machines.Footnote 16 It covers all manufacturing sectors located in Yokohama City. Because there are no firm identifiers, firms are matched between two periods by using the information on firm address, firm name, founding year, and owner’s name (in particular the family name).
We identify firm closures as those that were listed in 1921 and no longer listed in 1925. One may be concerned that these delisted firms include firms that survived, but moved out of Yokohama City. To address this concern, we check whether the delisted firms did indeed exit. In doing so, we focus on 31 delisted firms that had machines with no less than five horsepower because the likelihood of survival through movement is arguably higher for larger firms. We match those delisted with the complete list of plants with 10 or more workers in Japan in 1935.Footnote 17 Out of the 31 delisted firms, just three firms are found in the list for 1935, and 28 firms are not. In addition, two of the three survival firms that moved location were the plants of –U.S. oil companies (Rising Sun and Standard Oil). These findings indicate that only a few firms that survived moved out of Yokohama City. For surviving firms, we measure a firm’s technology upgrading as its growth in horsepower between 1921 and 1925. As judged by the summary statistics of the growth in horsepower in the Online Appendix Table, technology upgrading after the Great Kanto Earthquake in manufacturing firms in Yokohama City was on average small and positive (mean = 0.2103), but with considerable variation (sd = 1.189).
Damage Data
Our earthquake damage data consist of chome (town district) level damage index taken from Tsutomu Takahama et al. (Reference Takahama, Midorikawa and Shinbo2001).Footnote 18 More specifically, Takahama et al. (Reference Takahama, Midorikawa and Shinbo2001) used more than 150 historical documents and statistical records, applying text-mining methods to interviews with 25 experienced individuals and local historians. Based on these historical sources and interviews, the authors then constructed district-level damage data for Yokohama City. The data include the total number of wood buildings and the number of buildings totally damaged and partially damaged at the chome level. In addition, the original dataset of Takahama et al. (Reference Takahama, Midorikawa and Shinbo2001), not reported explicitly in their research paper, includes more detailed information on damage to roads and artificial areas at the district level.Footnote 19
Takahama et al. (Reference Takahama, Midorikawa and Shinbo2001) illustrate the damage map of Yokohama City at the chome level. Yokohama City is a geographically concentrated area, but was spatially heterogeneous in terms of damage. Noteworthy in this regard is that damage in Yokohama is fairly clustered in the central areas, where manufacturing industries were densely located. Indeed only 140 of the 704 chomes had plants located in them, and we restrict our analysis to these localities. Figure 5 represents the histogram of our damage index at the chome level, where the horizontal axis is the percentage of totally destroyed buildings. Around 50 percent of chomes were damaged with more than 60 percent of buildings totally destroyed.
SHARE OF TOTALLY COLLAPSED BUILDING (CHOME LEVEL)

Damage summary statistics are reported in the Online Appendix Table. Consistent with Figure 5, the mean of damage is 0.3, indicating that on average 30 percent of buildings were totally destroyed at the chome level.
FIRM-LEVEL ESTIMATIONSFootnote 20
Survival of Firms
The process of firm exit is believed to be an intrinsic component of the creative destruction process as more efficient firms are likely to survive under negative conditions (Aghion and Howitt Reference Aghion and Howitt1992). We, thus, first investigate whether firms located in damaged areas were less likely to survive and the extent to which this depended on their financial constraint. Because we have no explicit information on the financial aspects of the firms in our dataset, we use a measure of firm’s capital size (horsepower of machines) as an indicator of financial access, which appears to be a reasonable proxy in prewar Japan.Footnote 21 Because we only have data for 1921 and 1925, our analysis will cover survival over this period. To estimate the role of local earthquake damage on firm survival, we run the following logit model:
 $${{Survival}_{irs}} = {\beta _1}Siz{e_i} + {\beta _2}Damag{e_r} + {\beta _3}Damage \times Siz{e_{ir}} + {\beta _4}{X_i} + {\beta _5}{Y_r} + {\mu _S} + {\varepsilon _{irs}},$$
where subscript irs indicates firm i in sector s located in chome r. “Survival” is a dummy variable taking a value one if firm i operates before and after the earthquake, and zero if the firm exits after the earthquake. “Damage” denotes our proxy of chome r level damage by Takahama et al. (Reference Takahama, Midorikawa and Shinbo2001), which indicates the share of damaged buildings in the total number of buildings in chome r. Given the lack of data on employment in 1921, a firm’s pre-quake “Size” is firm size proxied by total horsepower in 1921. Reassuringly, post-quake employment, for which we have data, and total horsepower are significantly positively correlated with a correlation coefficient of 0.65. “Damage × Size” is an interaction term allowing for the possibility that larger, and, hence, arguably less financially constrained, firms may be affected differently by the earthquake. Xi is a vector of firm i characteristics in 1921 while Yr is a vector of chome r characteristics. μs is a vector of sector dummy variables.
In terms of firm characteristics, Xi, includes a “Foreign_owner” dummy, constructed from the owner’s name, “Age” to denote a firm’s age, an export specialization dummy, “Export,” which takes unity if the main product name indicates “export only” in our data, and “Multi-plant” an indicator variable for whether it is part of a multi-plant organization inside Yokohama City. The multi-plant firms can be identified by the same firm owner and firm name: 15 percent of surviving firms are multi-plant firms. All are two-plant firms and many are located in the same neighborhood. In terms of relocation after the earthquake, only a few firms stopped operations and moved away from Yokohama. On the other hand, some firms moved within Yokohama City after the earthquake (25 percent of surviving firms). Half of the relocation was within the same district (chome). Furthermore, the rest of them are generally relocations within the same neighborhood. We treat these as survivors and include a dummy variable “Relocation(within_Yokohama)” to control for them.Footnote 22 A few firms shut down and moved away to outside of Yokohama. To control for this, a dummy variable, “Relocation (out_of_Yokohama),” is added.
We should note that given that the data used for Equation (1) is cross-sectional in nature, we cannot include chome-level fixed effects and also identify the effect of “Damage.” We, thus, construct as rich of a set of chome-level characteristics as is reasonably available to make sure that we are capturing the causal effect of “Damage.” More precisely, Yr includes the total number of buildings (“Num_building”) and an artificial area dummy (“Artificial_area”), which takes on the value of one if the chome was constructed by a landfill in the Yokohama port. All the chome-level data are taken from Takahama et al. (Reference Takahama, Midorikawa and Shinbo2001).
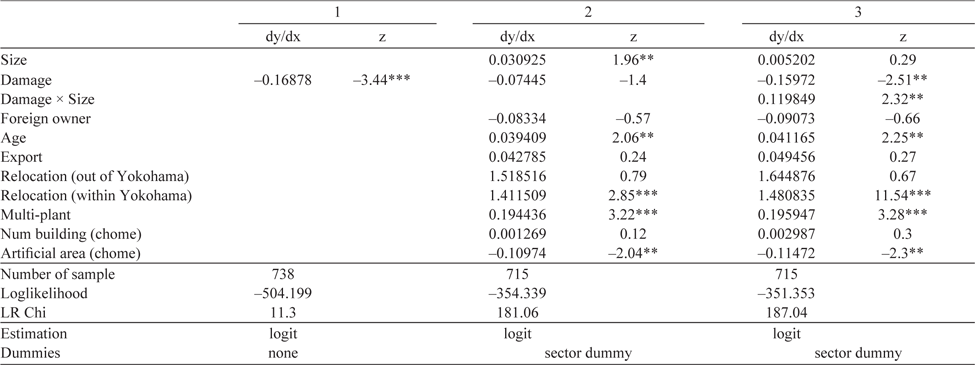
In Table 3, we report the marginal effectsFootnote 23 of estimation of Equation (1) excluding the interaction term between “Damage” and “Size.” In the first column, the negative coefficient on the damage proxy suggests that the probability of survival of firms was significantly lower in damaged areas. Firms located in more seriously damaged districts are more likely to shut down, and vice versa. In the second column, we take into account access to financial resources as proxied by their size. As a result, size is significantly positive. Better financial access results in firm survival. In the third column, the significant positive coefficient on this “Damage × Size” interaction term tells us that greater financial constraint decreases the likelihood of surviving in a damaged area.
SURVIVAL ESTIMATION

* = Significant at the 10 percent level.
** = Significant at the 5 percent level.
*** = Significant at the 1 percent level.
Survivalisr = ß 1Sizei + ß 2Damager + ß 3Damage × Sizeir + ß 4Xi + ß 5Yr + μS + ɛirs
“Size” is log of total horsepower of machines in 1921.
“Age” is log of firm age.
“Damage” is index (0 to 1) taken from Takahama et al. (Reference Takahama, Midorikawa and Shinbo2001).
“Relocation (out of Yokohama)” is the dummy for relocation (away from Yokohama).
“Relocation (within Yokohama)” is the dummy for relocation within Yokohama City.
Note: (average) marginal effect (dy/dx).
Source: Authors’ calculations.
We can use our estimates to assess the economic importance of damage on firm survival using the marginal effects. Accordingly, being in a damaged area per se decreased a firm’s likelihood of survival by 16.8 percent (–0.168, coefficient of “Damage” in the first column). However, for the largest, and arguably least financially constrained, in our sample the probability of survival was 98 percentage points higher than for the smallest.Footnote 24
Finally, to interpret our results as evidence of creative destruction, we need to show that those firms that survived were also those that were more efficient, that is, in our context those that used higher technology ex-ante the earthquake. Of course, we neither know which firms were damaged nor exactly why each firm actually exited, only the damage level of the chome they are located in. To get some suggestive evidence of whether the pre-earthquake technology level played a role in survival after the earthquake, we focus only on those chomes that were rather heavily damaged, that is, at least 50 percent were totally damaged, and compare the pre-earthquake level horsepower of firms that survived to those that exited. The histogram of the relative distribution is shown in Figure 6. As can be seen, the distribution of pre-quake technology of the survivors (dark bars) lies substantially further to the right than that of exits (white bars), thus indeed suggesting that firms that survived were more technology intensive.
SURVIVAL AND DEATH AT DAMAGED AREAS (MORE-THAN 0.5 IN DAMAGE INDEX)

Technology Upgrading of Surviving Firms
Using our set of firms that survived until 1925, we next investigate whether those located in damaged areas were more likely to upgrade their technology, conditional on their financial constraints. To this end, a firm’s degree of technology upgrade is regressed on its characteristics and chome-level building damage. More specifically, the following equation is estimated by ordinary least squares (OLS):
 $$Upgrad{e_{irs}} = {\beta _1}Siz{e_i} + {\beta _2}Damag{e_r} + {\beta _3}Damage \times Siz{e_{ir}} + {\beta _4}{X_i} + {\beta _5}{Y_r} + {\mu _S} + {\varepsilon _{irs}},$$
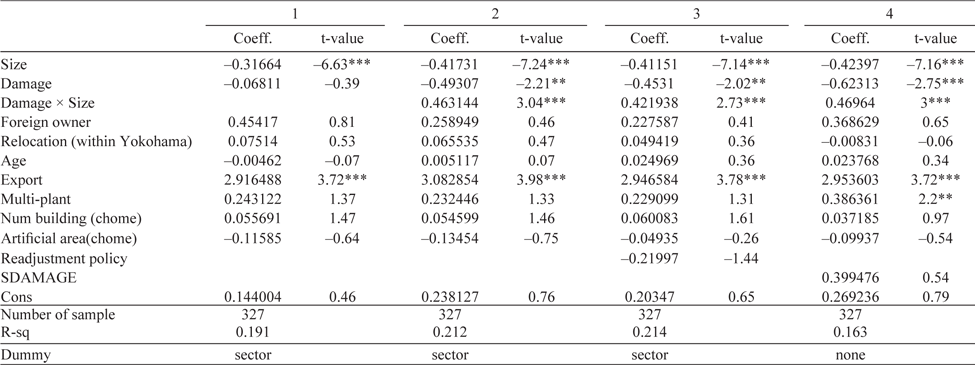
where subscript irs indicates firm i in sector s, located in chome r. “Upgrade” is the rate of technological improvement, measured as the growth in the horsepower of firm i from 1921 to 1925.Footnote 25 All other controls are as in Equation (1), except for “Relocation (out_of_Yokohama),” as we had to exclude relocated firms because we had no information on their machine use in 1925.
In Table 4 we report the results without interacting firm size with the chome damage variable (Column 1). As can be seen, “Size” has a significant and negative coefficient (–0.31664). This tells us that less capital-intensive firms tend to increase their capital. This can be interpreted as a mean reversion. Our results indicate that in more damaged areas firms’ capital tends to grow less, as indicated by the negative coefficient of “Damage.” However, more importantly the significantly positive coefficient of “Damage × Size,” which measures the additional effect of damage for larger firms, says that capital-intensive firms located in the damaged areas tend to experience a lower fall in capital upgrading than less capital-intensive firms.
TECHNOLOGY UPGRADING

* = Significant at the 10 percent level.
** = Significant at the 5 percent level.
*** = Significant at the 1 percent level.
Upgradeirs = ß 1Sizei + ß 2Damager + ß 3Damage × Sizeir + ß 4Xi + ß 5Yr + μS + ɛirs
OLS regressions
“Size” measured by horsepower of machines in 1921.
 $SDAMAG{E_{Sj}} = \sum\limits_{i = 1,i \in S}^{{N_S}} {DAMAG{E_r}} \times {{Siz{e_{ir}}} \over {\sum\nolimits_{i = 1,i \in S}^{{N_S}} {Siz{e_{ir}}} }}$
Source: Authors’ calculations.
We can use our coefficients to calculate the size above which a firm with an average level of damages, that is, 0.318, would experience upgrading.Footnote 26 The critical value implied by our coefficients is 1.178; that is the value of “Size” above which the sum of the coefficients on “Damage” and “Damage × Size” is positive. This implies that in an average damaged locality, about 24 percent of surviving firms would have been large enough to finance a technological upgrade.Footnote 27
Next, we investigate whether the readjustment policy affected the upgrading of machines. We add the dummy for the policy variable, which takes unity if the chome was targeted by the readjustment policy. In Column 3, the insignificant coefficient on the policy variable, “Readjustment Policy,” suggests that the readjustment policy did not aid firms in upgrading their machinery. The readjustment policy reduced land size of targeted firms, which would downsize firms. Since machine horsepower is proportional to machine size, the policy made negative impact on upgrading their machinery.
Finally, we ask whether firms may have benefited from decreased competition from other firms in damaged areas in the same sector. To this end, we generated a sectoral destruction index, “SDAMAGE,” as follows:
 $$ SDAMAG{E_{Sj}} = \sum\nolimits_{i = 1,i \in S}^{{N_S}} {DAMAG{E_r}} \times {{Siz{e_{ir}}} \over {\sum\nolimits_{i = 1,i \in S}^{{N_S}} {Siz{e_{ir}}} }},$$
where subscript S refers to a firm’s sector, and the other variables are defined earlier. In essence, “SDAMAGE” is size weighted local damage experienced by firms operating in sector s, and in the same chome. We include this variable in the last column of Table 4. While the coefficient is positive as expected, its insignificance suggests that a fall in competition from other firms in damaged areas in the same sector did not induce any technological upgrading.
PREFECTURAL ESTIMATIONS
As a further robustness check, we conducted prefectural level estimations using data from the Manufacturing Census (Ministry of Agriculture and Commerce of Japan). The Manufacturing Census is annually available, but only at the prefectural level (47 prefectures).Footnote 28 The census includes information on the number of firms (plants) with machines (capital), the number of machines by type of engine (steam, electric, turbine, water turbine, the Pelton wheel, and gas engine), and horsepower of each engine type. Our compiled dataset covers the period 1919 to 1926, except for 1922.Footnote 29
To investigate the impact of earthquake damage on technology at the prefecture level we estimate:
 $$Growt{h_{Nu{m_{pt}}}} = {\beta _1}Nu{m_{pt}} + {\beta _2}PostQuak{e_t} + {\beta _3}Damage \times PostQuak{e_{pt}} + year + {\omega _p} + {\varepsilon _{pt}},$$
where p indicates prefecture and t is the year. ωp is a vector of prefecture dummy variables. “Num” is either the number of firms with machines (capital), or the number of machines (capital) by each type of engine. “Growth_Num” is the growth rate from t – 1 to t for each machine variable (“Num”). “Damage” is a damage variable for prefecture measured by the percentage of fatalities caused by the earthquake in total population in each prefecture. The values are taken from the same source as for Table 1. We note that in all seven damaged prefectures, Kanagawa Prefecture (Yokohama) was the highest percentage of casualties in the population (2.31 percent) and Tokyo Prefecture the second highest (1.75 percent).Footnote 30 “PostQuake” is a dummy taking a value of one in all years after 1923. “Damage × PostQuake” is the interaction of “Damage” and “PostQuake.” We note that prefectural damage, “Damage,” is dropped due to the use of a comprehensive set of prefectural dummies in this estimation.
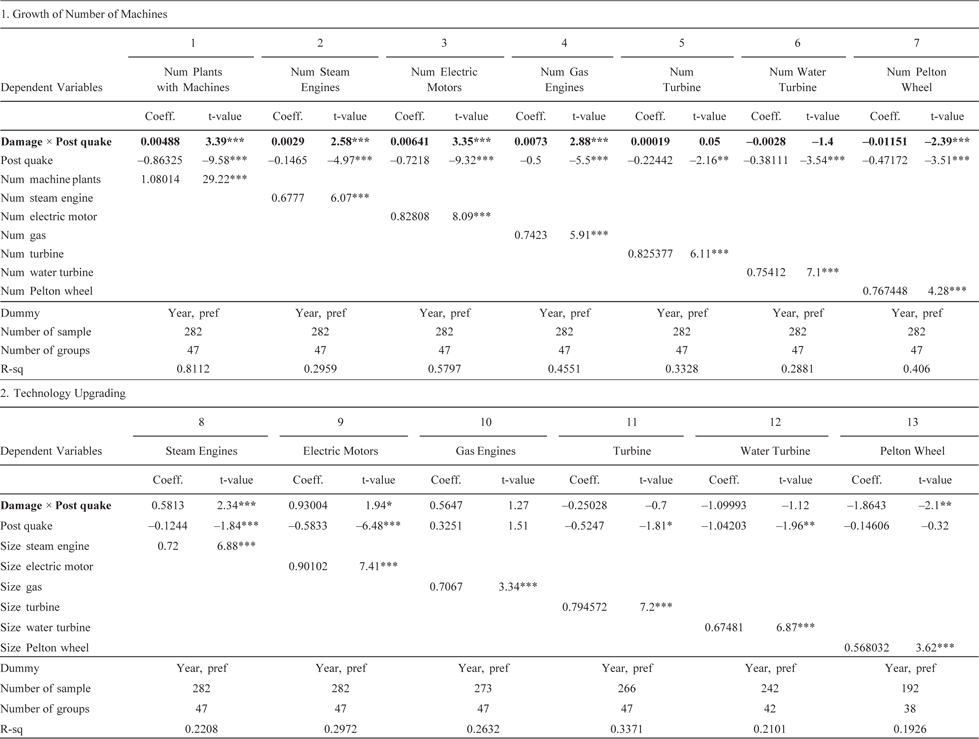
First, we look at the impact on the number of plants with machines. The results, shown in Column 1 of Table 5 reveal that the interaction term of “Damage × PostQuake” is significantly positive. More precisely, seriously damaged prefectures experienced a higher growth rate in the number of machine plants after the earthquake.
PREFECTURAL LEVEL ANALYSIS

* = Significant at the 10 percent level.
** = Significant at the 5 percent level.
*** = Significant at the 1 percent level.
Upgradept = ß 1Sizept + ß 2PostQuaket + ß 3Damage × PostQuakept + year + ωp + ɛpt
Growth_Numpt = ß 1Numpt + ß 2PostQuaket + ß 3Damage × PostQuakept + year + ωp + ɛpt
OLS with clustered standard errors (prefecture).
Year: 1919, 1920, 1921, 1923, 1924, 1925, 1926
Post quake is year dummy after the earthquake (1924, 1925, 1926).
Damage variable is the percentage of casualties at prefectural level.
Source: Authors’ calculations.
Columns 2 to 7 of Table 5 report the results of using the growth of the number of different machine types as the dependent variable. Accordingly, the “Damage × PostQuake” interaction term is significantly positive for machines with electric motors, those with steam engines, as well as gas engines, indicating that their use was boosted in prefectures that experienced earthquake damage, but not for turbines.
Next, we estimate the upgrade of machines after the earthquake using the following equation:
 $$Upgrad{e_{pt}} = {\beta _1}Siz{e_{pt}} + {\beta _2}PostQuak{e_t} + {\beta _3}Damage \times PostQuak{e_{pt}} + year + {\omega _p} + {\varepsilon _{pt}},$$
where “Size” is the total prefecture horsepower at the year 1921, and “Upgrade” is the growth of prefecture horsepower. Columns 8 to 13 of Table 5 report the results. The interaction term of “Damage” and “PostQuake” (“Damage × PostQuake”), is significantly positive for machines with steam engines and those with electric motors. In this regard, Ryoshin Minami (Reference Minami1987) showed that electric motors diffused rapidly from the 1900s. The total horsepower of electric motors exceeded that of steam engines in the late 1910s, and the share of electric motors in the total motive power of manufacturing industries in Japan became higher in the late 1920s. In this sense, the 1920s were characterized by an “electric revolution.”
Finally, we want to explore if access to financing would have aided post-quake technological upgrading. We have bank lending data at the prefectural level from Nihon Teikoku Tokei Nenkan (Statistical Yearbook of the Empire of Japan) for each year and create a time-varying prefecture-specific data series of total bank lending. We estimate:
 $$Growt{h_{nu{m_{pt}}}} = {\beta _1}Nu{m_{pt}} + {\beta _2}Damage \times Postquake \times lendin{g_{pt}} + {\beta _3}Damage \times PostQuak{e_{pt}} + {\beta _4}lendin{g_{pt}} + {\beta _5}Damage \times lendin{g_{pt}} + {\beta _6}Postquak{e_t} + year + {\omega _p} + {\varepsilon _{pt}},$$
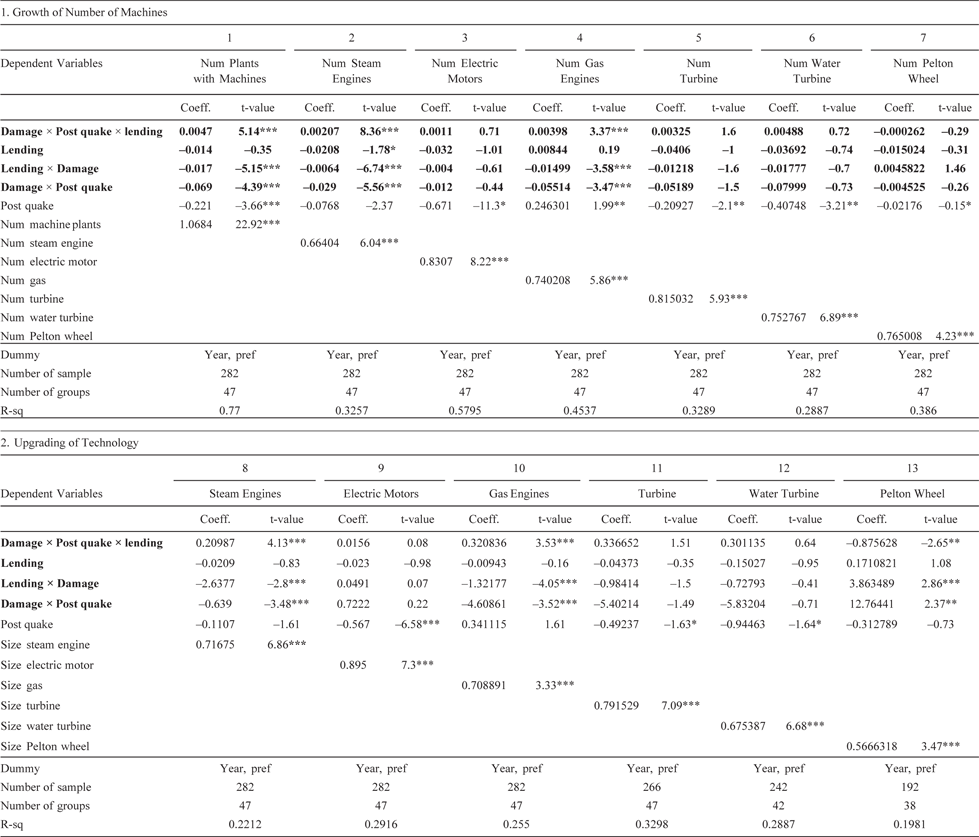
where the variable “lending” is the total amount of private bank lending at prefecture p at year t (taking log). As shown in Columns 1 to 7 of Table 6, the interaction term of “Damage × Postquake × lending” is significantly positive for the number of plants with machines, plants with steam engines, as well as plants with gas engines. Thus, bank lending, likely stimulated by the BOJ policy, increases firms’ capital investment, at least for some types of technologies, in seriously damaged prefectures.
PREFECTURAL LEVEL ANALYSIS (WITH BANK LENDING)

* = Significant at the 10 percent level.
** = Significant at the 5 percent level.
*** = Significant at the 1 percent level.
Upgradept = ß 1Sizept + ß 2Damage × Postquake × Lendingpt + ß 3Damage × PostQuakept + ß 4Lendingpt + ß 5Lending × Damage + ß 6Postquaket + year + ωp + ɛpt
Growth_Numpt = ß 1Numpt + ß 2Damage × Postquake × Lendingpt + ß 3Damage × PostQuakept + ß 4Lendingpt + ß 5Damage × Lendingpt + ß 6Postquaket + year + ωp + ɛpt
OLS with clustered standard errors (prefecture).
Year: 1919, 1920, 1921, 1923, 1924, 1925, 1926
Post quake is year dummy after the earthquake (1924, 1925, 1926).
Damage variable is the percentage of casualties at prefectural level.
Source: Authors’ calculations.
We also estimate the impact of access to finance on technological upgrading at the prefecture level with:
 $$Upgrad{e_{pt}} = {\beta _1}Siz{e_{pt}} + {\beta _2}Damage \times Postquake \times lendin{g_{pt}} + {\beta _3}Damage \times PostQuak{e_{pt}} + {\beta _4}lendin{g_{pt}} + {\beta _5}lending \times Damage + {\beta _6}Postquak{e_t} + year + {\omega _p} + {\varepsilon _{pt}}.$$
As shown in Columns 8 to 13 of Table 6, the interaction terms of “Damage × Postquake × lending” are significantly positive for machines with steam engines and those with gas engines. This indicates that these types of engines were upgraded by bank lending in damaged prefectures after the earthquake. In other words, damaged prefectures with good financial access through the banking sector tend to upgrade machines. This indicates that financial channels by the BOJ policies were mainly through the banking sector, which managed to make use of manufacturing firm’s upgrading capital.
With these results in mind, it is notable that the Japanese economy was experiencing a motive power evolution during this period. Minami (Reference Minami1976), using Japan’s Manufacturing Census data, studied how important the evolution of this type of motive power was in the Japanese industrialization from the late nineteenth century. More specifically, he illustrated the evolution of motive power, from traditional water wheels to the steam engine, and then from the steam engine to the electric/gas motor.
CONCLUSION
The Great Kanto Earthquake inflicted very serious damage on Yokohama City and Tokyo City. About 90 percent of factories in Yokohama City were burned down. However, manufacturing industries in Yokohama City swiftly recovered. As we show in this article, the number of factories and workers exceeded the 1921 levels by 1924 and 1927, respectively. Furthermore, we found some cases where firms exploited the damage by the earthquake to upgrade their factories. For example, Furukawa Electric Co. not only reformed the layout of its Yokohama Plant, but it also restructured the division of works between Yokohama plants and its other plants. Kirin Brewery Co. relocated the damaged Yokohama Yamate Plant to a new site and introduced advanced production equipment. These are typical cases of creative destruction that are generally often just assumed in the literature on this topic.
We also examined to what extent we can generalize these cases. Using firm-level data from Yokohama City, we found that while firms in more damaged areas were less likely to survive but the survivors were those with better initial technology. Hence, the earthquake is likely to have increased the level of technology by shedding less efficient firms. Moreover, although those in more damaged areas tended to upgrade their technology less than those in less damaged areas, if a firm had large enough capital, and, hence, was arguably financially liquid, then the earthquake acted to induce it to switch to more advanced machines.
Examining prefectures across the whole of Japan, we find that earthquake damage in a region induced more firms with machines, more growth in steam engines and machines with electric motors, and greater use of electric power, at least for some engine types. In addition, damaged prefectures with larger bank lending, promoted by the BOJ policies, saw higher growth. All of these results suggest that there was indeed creative destruction due to the Great Kanto Earthquake, but that the opportunity for creative destruction was mainly open only to large firms with greater financial access and already more technologically advanced firms.
Furthermore, it provides a new perspective on Japanese economic history in this period. In this literature, the period between the two world wars has been characterized by an upgrade of the industrial structure based on electric power and the emergence of a “dual structure.” Creative destruction by the Great Kanto Earthquake accelerated both of these aspects in the evolution of the Japanese economy for those affected areas.