I. INTRODUCTION
The most common material utilized to manufacture ball and roller bearing rings is alloy steel GCr15 (the alternative corresponding designations are AISI/SAE 52100 and DIN 100Cr6). GCr15 comprises 1.0% carbon steel and 1.3–1.6% chromium. Reference Shipley1 The segregation that occurs during solidification leads to coarse carbide formation along the center of the casting Reference Blinov, Doronin, Antoschenkov and Lukina2–Reference Kiessling and Beckström4 and uneven component distribution. Reference Malinovskaya, Kurasov, Glaskova and Spektor5–Reference Bode, Schwerdtfeger, Geck and Höfer7 The large carbides and homogenization of the components seriously influence hot workability Reference Gubenko and Galkin8,Reference Gerashchenko, Zhadan, Shturgunov, Zaikin and Kapsheeva9 and machinability. Reference Capatina, Teodorescu, Taru and Udvuleanu10 Homogenization heat treatment before hot rolling is usually applied to reduce microsegregation and dissolve large core carbides.
However, long-time homogenization at high temperatures leads to coarse austenite grain sizes. Coarse prior austenite grains significantly influence the structure and mechanical properties of steels after hot rolling. Reference Yang, Hu and Sun11–Reference Yin, Yang, Li and Wang15 The austenite grain size distribution is inhomogeneous because the distribution of the components in the cast billet is also inhomogeneous. Research on grain growth and homogenization is necessary.
The austenite grain growth kinetics of hot-rolled GCr15 bearing bars have been investigated by annealing the samples for short times at low temperatures. Reference Yue, Zhang, Liao and Gao16 Recently, some research works have been published on the normal/abnormal grain growth. Reference Shirdel, Mirzadeh and Parsa17,Reference Shirdel, Mirzadeh and Parsa18 A study on the grain size, morphology, and grain size distribution of austenite also has been reported. Reference Li, Liu, Song, Kong, Li and Zhang19 Homogenization heat treatment has also been implemented in different situations (i.e., inhomogeneous distribution, long times, and high temperatures).
This study aims to investigate the grain growth kinetics and distribution changes in a GCr15 bearing steel cast billet during long-time and high-temperature homogenization heat treatment.
II. EXPERIMENTAL MATERIALS AND PROCEDURES
A commercial-type GCr15 bearing steel cast billet with an average chemical composition of 1.0 wt% C–1.42 wt% Cr–0.35 wt% Mn–0.25 wt% Si–0.025 wt% P–0.025 wt% S–0.3 wt% Ni–0.25 wt% Cu–0.10 wt% Mo was utilized. The microsegregation that occurred during the solidification process leads to an inhomogeneous distribution of the alloying elements, especially C and Cr.
Specimens with a size of 15 × 10 × 5 mm were obtained from the columnar zone of a 150 × 150 mm cast billet. The specimens were heated at different temperatures (i.e., 1000, 1050, 1100, 1150, 1200, and 1250 °C) and soaked for different times (i.e., 30, 60, 90, 120, 150, and 180 min) using a tube-type atmosphere furnace. Afterward, the specimens were immediately quenched in water. The temperature of the specimens was measured with a B-type thermocouple. The specimens were protected in N2 atmosphere during the experiments to prevent oxidation and decarburization. The quenched specimens were etched with saturated picric acid + hydrochloric acid + sodium dodecyl benzene sulfonate at 80 °C for 60–150 s to reveal prior austenite grain boundaries after grinding and polishing. Subsequently, the austenite grains were observed with an optical microscope. Grain size was measured and evaluated through the average linear intercept method implemented in the software ImageJ. More than 500 grains were individually measured for each specimen to obtain the distribution of the austenite grains.
III. EXPERIMENTAL RESULTS
A. Effect of soaking temperature and time on austenite grain size
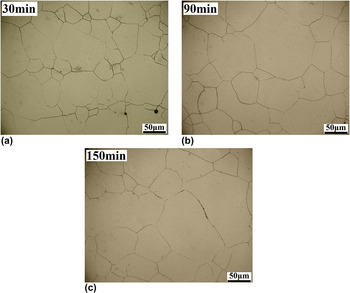
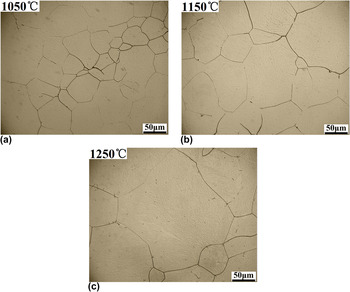
Figure 1 shows the microstructural evolution during annealing at 1050 °C for 30, 90, and 150 min. The austenite grains grow gradually as the annealing time increases, and a few small grains were observed after heating for a long time. The decrease in small grains reveals that large austenite grains can merge small ones and gradually grow with the increase in heating time. The curvature of the grain boundaries becomes large as the grains grow. More 120° grain angles were also observed. Figure 2 shows the morphology of the austenite grains in the GCr15 bearing steel cast billet at different heating temperatures and 60 min holding time. The austenite grains coarsen with the increase in the heating temperature. Similar changes in grain morphology are shown in Fig. 1. Moreover, slight abnormality of grain growth can be observed in the optical micrographs. This phenomenon should be correlated to the uneven distributions of the components.
Optical micrographs of the GCr15 bearing steel cast billet after annealing at 1050 °C for (a) 30 min (b) 90 min (c) 150 min.

Optical micrographs of the GCr15 bearing steel cast billet after annealing at (a) 1050 °C (b) 1150 °C (c) 1250 °C for 60 min.

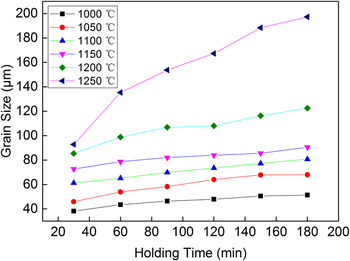
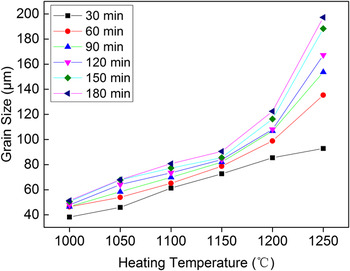
Figures 3 and 4 show the relationship between austenite grain sizes and holding time as well as between austenite grain sizes and temperature, respectively. Figure 3 shows that the austenite grain growth rate slows down when the holding time increases. Consequently, the grain boundaries become flat, and the drive force of the grain growth decreases. The effect of heating temperature and time on the austenite grain growth rate can be quantitatively described. The driving pressure for grain growth is provided as Reference Patterson and Liu20,Reference Hellman and Hillert21
 $${P_{\rm{d}}} = \alpha {\gamma \over D}\quad ,$$
where D is the mean volumetric grain diameter, γ is the grain boundary energy, and α is a dimensionless geometric constant. Velocity is generally assumed to be directly proportional to driving pressure, with the constant being the effective boundary mobility (M) shown as follows Reference Humphreys and Hatherly22 :
 $$\nu = M{P_{\rm{d}}}\quad .$$
Relationship between austenite grain sizes and holding time.

Relationship between austenite grain sizes and heating temperature.

The grain boundary velocity is expressed by
 $$\nu = {1 \over 2}{{{\rm{d}}D} \over {{\rm{d}}t}}\quad .$$
Assuming that mobility is given by an Arrhenius relationship, the grain growth rate can be expressed by combining Eqs. (1) and (2) as follows:
 $${{{\rm{d}}D} \over {{\rm{d}}t}} = {M_0}\;{\rm{exp}}\left( { - {Q \over {RT}}} \right){{\alpha \gamma } \over D}\quad .$$
Figure 4 shows that a substantial increase in the grain growth rate is caused by annealing at elevated temperatures. This phenomenon is in good agreement with Eq. (3). The grain growth rate decreases as the grain sizes increase (Fig. 3), which is also well explained by Eq. (3).
B. Effect of soaking temperature and time on austenite grain distribution
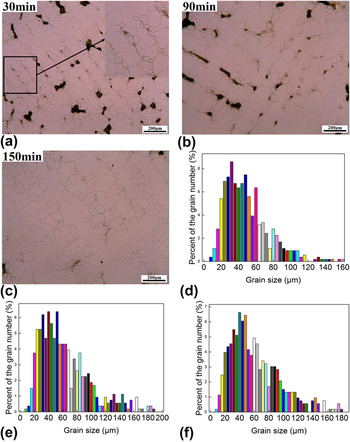
Figure 5 shows the distribution of austenite grains after annealing at 1050 °C for 30, 90, and 150 min. The microsegregation of C and Cr in the GCr15 bearing steel cast billet leads to uneven etching of the samples. Parts of the interdendritic regions are etched to black. The first picture in Fig. 5 shows the dendritic distribution of austenite grains. The small grains in the interdendritic regions and the large ones at the dendritic arms indicate that the coarsening rate of the interdendritic grains is lower than that of the grains at the dendritic arms. This result is due to the “solute drag effect” of the alloying elements or the second-phase particles. Reference Novikov23,Reference Gil and Planell24 The specimens were all superheated in the experiment process. Therefore, the second-phase particles were all dissolved into the austenite matrix. The coarsening rate is mainly restrained by the alloy elements. High Cr concentrations in the interdendritic region result in a low coarsening rate of the austenite grains.
Distribution of austenite grains after annealing at 1050 °C for (a) 30 min (b) 90 min (c) 150 min and (d), (e), (f) are the histograms, respectively.

The most widely utilized criterion to determine the distribution nonhomogeneity of austenite grains is the ratio of D max (size of the maximum observed grain) to D average (average grain size). The D max/D average values of the austenite grains are 3.1, 3.6, and 3.7 after holding for 30, 90, and 120 min, respectively, at 1050 °C. The distribution nonhomogeneity of the austenite grains increases with prolonged holding time. The histograms in Fig. 5 show the distribution of the austenite grains after holding for different times. The size differences in the two areas increase with the increase in holding time as the grain growth rate of the interdendritic grains decreases. The increased differences in grain sizes lead to an increase in distribution nonhomogeneity. The bimodality in grain size distribution also can be seen in the pictures. This is due to the different growth velocities of the dendritic and the interdendritic grains.
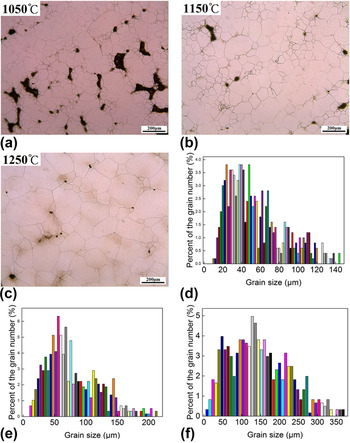
Figure 6 shows the distribution of austenite grains after annealing at 1050, 1150, and 1250 °C for 1 h. The small grains in the interdendritic areas rapidly grow. The grain distribution also tends to become homogeneous when the heating temperature increases from 1050 to 1250 °C. The D max/D average values of the austenite grains are 3.7, 2.8, and 2.4 after annealing at 1050, 1150, and 1250 °C, respectively. The diffusivity of Cr increases rapidly with the increase in temperature, whereas Cr nonhomogeneity rapidly decreases. The differences in the grain growth rate between grains in the interdendritic areas and those at the dendritic arms are significantly reduced. In other words, the inhomogeneity of the austenite grain distribution decreases with the increase in annealing temperature. The bimodality in grain size distribution almost cannot be seen at 1250 °C. This means the distribution nonhomogeneity of the components have been decreased to a very low level. The grain boundary defaceting phenomenon appeared at 1250 °C may also contribute to the disappearance of the bimodality. As this phenomenon improved the grain growth velocity so much, the “solute drag effect” of the alloy elements has been weakened.
Distribution of austenite grains after annealing at (a) 1050 °C (b) 1150 °C (c) 1250 °C for 1 h and (d), (e), (f) are the histograms, respectively.

IV. DISCUSSIONS
A. Mathematical model of grain growth
According to metallographic principles, the grain growth kinetics of the GCr15 bearing steel cast billet can be described with Beck's classical theory of grain growth as follows Reference Hillert25 :
 $$D = K{t^n}\quad ,$$
where D is the average grain size at holding time t, K is a grain growth rate constant, and n is the grain growth exponent.
The K value depends on the material and temperature. The relation between austenite grain growth and the austenitizing condition is explained by the thermally activated atomic jump process. Therefore, Eq. (4) is expressed by the following Arrhenius-type equation. Reference Lee and Lee26
 $$D = {K_0}\;{\rm{exp}}\left( { - {Q \over {RT}}} \right){t^n}\quad ,$$
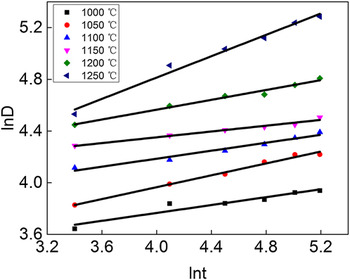
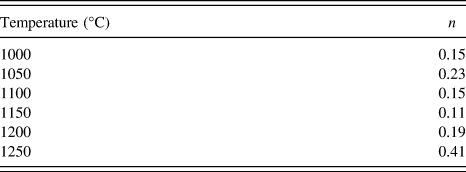
where K 0 is a constant, Q is the activation energy for grain growth, T is the annealing temperature, and R is the gas constant. Formulated by Eq. (4), lnD and lnt can be linearly fitted (Fig. 7). Based on the values of n summarized in Table I, the grain growth exponents n at most of the temperatures are about 0.2. This value increases to 0.41 at 1250 °C may be attributed to the grain boundary faceting/defaceting phenomenon as has been demonstrated for other metals. Reference Koo and Yoon27–Reference Hamilton, Siegel, Daruka and Léonard29 More experimental work is required to verify this phenomenon in the case of the present material.
Logarithmic plots of average grain size D versus annealing time t.

Values of the grain growth exponents (n).

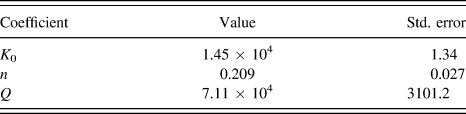
The unknown variables in Eq. (5) are analyzed by multiple regression to quantitatively express the growth model of the austenite grain in the GCr15 bearing steel cast billet, which can be derived by considering the effect of heating temperature and holding time. The following equation can then be obtained:
 $$D = 1.45\, \times \,{10^4}\;{\rm{exp}}\left( { - {{7.11\, \times \,{{10}^4}} \over {RT}}} \right){t^{0.209}}\quad ,$$
where D is the average grain size (µm), t is the holding time (s), T is the absolute heating temperature (K), and R is the gas constant (8.31 J/mol K).
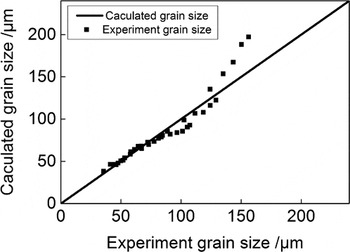
The accuracy of the mathematical approximation during the multiple regression analysis is shown in Table II. A comparison of the calculated and experimental austenite grain sizes using Eq. (6) is shown in Fig. 8. The average relative error between the calculated and experimental austenite grain sizes is 7.2%. The calculated austenite grain size is in good agreement with the experimental one.
Accuracy of the mathematical approximation.

Comparison of the calculated and experimental average grain sizes.

B. Model of grain size distribution
The distribution of austenite grain size in GCr15 bearing steel cast billet is different from that in steels with a homogeneous solute distribution. Some quantitative descriptions for the austenite grain size distribution are needed. The most common theoretical functions used to describe grain size distribution are the Louat, Reference Louat30 log-normal, Reference Feltham31 and Weibull functions given in Eqs. (7)–(9), respectively.
 $$f(x) = 2a\;{\rm{exp(}} - a{x^2}{\rm{)}}$$
 $$f(x) = {1 \over {\sqrt {2\pi } \sigma x}}\;{\rm{exp}}\left( { - {{{{({\rm{In}}\;x - \mu )}^2}} \over {2{\sigma ^2}}}} \right)$$
 $$f(x) = {\beta \over {{\alpha ^\beta }}}{x^{\beta - 1}}\;{\rm{exp}}\left( { - {{\left( {{x \over \alpha }} \right)}^\beta }} \right)$$
The independent variable x in the equations is the ratio of the austenite grain diameter to the average grain diameter (D a). The dependent variable f(x), which is referred as the normalized frequency, is the ratio of the grain number with a specific grain size to the maximum grain number.
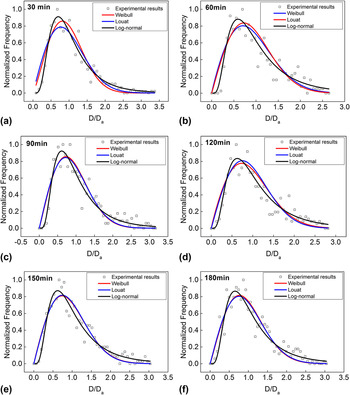
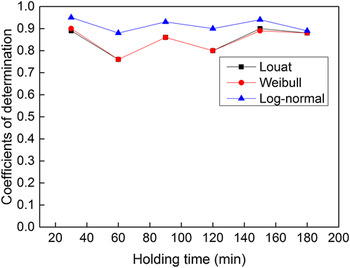
The austenite grain size distributions after annealing at 1050 °C for different times were compared with the Louat, log-normal, and Weibull functions in Fig. 9. The figure shows that the maximum value of the normalized frequency appears in the D/D a < 1 region. This observation indicates that the sizes of most grains are smaller than the average grain size in the structure because the growth processes of partial grains are restrained by the alloying atoms in the segregation zone. Figure 9 also demonstrates that the log-normal function fits the grain size data fairly well in the entire range of grain sizes. The Weibull and Louat functions deviate from the data when the grain size is either very small or very large. Figure 10 shows the coefficients of determination of each fitting equation. The coefficients of determination of the Weibull and Louat functions are basically equal, with values obviously lower than those of the log-normal function.
Grain size distribution in the cast billet after annealing at 1050 °C for different times: (a) 30 min, (b) 60 min, (c) 90 min, (d) 120 min, (e) 150 min, and (f) 180 min.

Coefficients of determination of each fitting equation in Fig. 9.

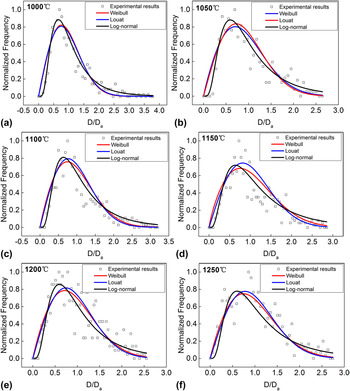
Figure 11 shows a comparison between the austenite grain size distributions after annealing at different temperatures for 1 h and the Louat, log-normal, and Weibull functions. The figure shows that the maximum values of normalized frequency obviously appear in the D/D a < 1 region for all heating temperatures except 1250 °C. The maximum value of normalized frequency appears in the D/D a ≈ 1 region after annealing at 1250 °C for 1 h. These results imply that the homogeneity of the structure improves, and the restraining effect of the alloying atoms on the austenite grains weakens significantly when the samples are annealed at 1250 °C for 1 h. Figure 12 shows that the log-normal function fits the grain size distribution data better than the other two functions when the annealing temperature is lower than 1250 °C. However, the Weibull function fits the grain size distribution data better than the other functions after annealing at 1250 °C for 1 h. Several simulation results obtained by random models, such as cellular automata, Reference He, Ding, Liu and Shin32 Monte Carlo, Reference Srolovitz, Anderson, Sahni and Grest33 and atom jumping, Reference Fan, Geng and Chen34 also show that the Weibull function fits the grain size data better than other functions. These models are all based on the assumption that the growth process of austenite grains is completely random. This condition indicates that the Weibull function fits the grain size distribution data well when the structure is homogeneous. The log-normal function also fits the grain size distribution data well when the structure is not homogeneous.
Grain size distribution after annealing for 1 h at different temperatures: (a) 1000 °C, (b) 1050 °C, (c) 1100 °C, (d) 1150 °C, (e) 1200 °C, and (f) 1250 °C.

Coefficients of determination of each fitting equation in Fig. 11.

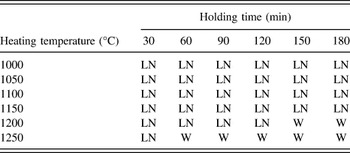
Table III shows the best fitting functions of the grain size data for annealing at different temperatures and times. The Weibull (expressed as W) function best fits the grain size data when the structure is heated at 1200 °C and 1250 °C for at least 150 and 60 min, respectively. The log-normal function, which is expressed as LN, best fits the grain size data for the other experimental temperatures and times. This result shows that the heat treatment process improves the homogeneity and distribution regularities of austenite grain sizes.
Best fitting functions of the grain size data for annealing at different temperatures and times.

V. CONCLUSION
The following conclusions can be drawn from the study on the grain growth of the GCr15 bearing steel continuous cast billet.
-
(1) The austenite grain growth rate decreases with the increase in holding time and increases with the increase in heating temperature.
-
(2) The growth model of austenite grains in the GCr15 bearing steel continuous cast billet is as follows:
 $${\bi{D}} = 1.45\, \times \,{10^4}\;{\rm{{\bf{exp}}}}\left( { - {{7.11\, \times \,{{10}^4}} \over {{\bi{RT}}}}} \right){{\bi{t}}^{0.209}}\quad .$$
-
(3) The austenite grain sizes are unevenly distributed in the GCr15 bearing steel continuous cast billet. The distribution nonhomogeneity changes with the increase in heating temperatures and times.
-
(4) The Weibull function fits the austenite grain size distribution data well when the structure is homogeneous. The log-normal function fits the grain size distribution data well when the structure is not homogeneous.