Planning for increased demands for emergency services is critical for the delivery of quality health care. As populations around the world continue to grow, hospital emergency departments are often strained to meet patient volumes.Reference Di Somma, Paladino and Vaughan 1 For example, in the United States, over the past decade, emergency room departments have been challenged with high utilization rates compounded by an incongruously lower number of health care providers that can handle the demands.Reference Kellermann 2 , Reference Barish, McGauly and Arnold 3 In 2007, the Institute of Medicine declared that American emergency departments were in crisis in a report entitled: “Hospital-Based Care: At a Breaking Point.” From 1993 to 2003, emergency visits increased from 90.3 million to 113 million, although there was a loss of 425 emergency departments. More recently, in 2013, the total number of emergency room visits increased to over 134 million. 4 It is estimated that it costs $1 million to build a hospital bed and an additional $600,000 to $800,000 to staff it. Thus, an increase or decrease in admission by 1 day may result in a net change of around $800,000 to the hospital in 1 year.Reference Lucas, Farley and Twanmoh 5 , Reference Falvo, Grove and Stachura 6 This unstable service demand puts many hospitals at risk for patient overcrowding, which, in turn, can negatively impact public health and undermine disaster preparedness efforts.Reference Trzeciak and Rivers 7
Emergency Room Capacity and the Health Insurance Market
From a public health standpoint, overcrowding in emergency rooms can disproportionately affect hospitals that service uninsured and low-income patients. Previous research has shown that patients who are uninsured and/or are of lower socioeconomic status are more likely to use emergency services instead of primary care.Reference Hudon, Sanche and Haggerty 8 According to Kangovi and colleagues, poor individuals tend to use the emergency department more often because their services are perceived to be more accessible and cheaper than ambulatory services.Reference Kangovi, Barg and Carter 9 These patients are often present with more severe health conditions than patients of higher socioeconomic status.Reference Kangovi, Barg and Carter 9 Promisingly, President Obama’s 2016 landmark paper on health care reform indicated that between 2010 and 2015, the rate of uninsured Americans dropped by 43%Reference Obama 10 ; however, it is unclear how this decline translates to reducing the emergency room utilization rates and improving health care services for indigent populations.
Although increasing insurance coverage is a major step forward to providing poor patients with better access to health care services, further examination of the economic context and characteristics of hospital-based emergency departments that serve low-income patients is needed. Past disaster situations, such as Hurricane Katrina, underscore how events such as natural disasters can exacerbate the conditions of already burdened emergency departments in low-income areas. According to Rudowitz and colleagues, prior to Hurricane Katrina, the state of Louisiana had the fourth highest emergency rate room visit rates in the nation.Reference Rudowitz, Rowland and Shartzer 11 The Charity Hospital Emergency Department, for example, had one of the most frequented emergency rooms in the country and was the hub for emergency care during the storm.Reference Rudowitz, Rowland and Shartzer 11 Some scholars have argued that the extent of damage and loss of human life could have been minimized by addressing the economic blight in the impacted areas.Reference Laska and Morrow 12 It was no secret that there were many vulnerable residents living around the Gulf in conditions that offered greater risk due to the hazardous economic conditions, such as densely populated areas with high unemployment and low incomes. This is not uncommon in many urban settings in the United States.Reference Hartman and Squires 13
Construct of Economic Hazard
An economic hazard refers to detrimental socioeconomic conditions that increase the risk for adverse outcomes in various settings, ranging from natural disasters to health care utilization.Reference Schumacher and Strobl 14 - Reference Watts, David Bryan and Tarwater 16 Unemployment rates and income per capita have been used in defining an economic hazard. 17 Countries and communities with low income per capita and high unemployment rates are known to suffer more losses from natural disasters because of a limited capacity to take precautionary measures in response to the demand for safety.Reference Schumacher and Strobl 14 In that sense, areas with low income and high unemployment rates face a high level of economic hazard, which, in turn, impacts their capacity to respond to natural disasters. Socioeconomic characteristics such as race, education, income, and employment rate are also commonly used in health outcome research.Reference Hong, Liu and Hottel 18 It is common knowledge that communities with high unemployment rates and lower incomes are more vulnerable to unfavorable health outcomes, including access to and utilization of health care services.Reference Suruda, Burns, Knight and Dean 19 - Reference Khan, Glazier, Moineddin and Schull 21
Research Objectives
To gather a greater understanding of the relationship between economic hazard areas and emergency services, we examine this relationship to assist hospital administers and emergency preparedness personnel for future planning efforts. Motivated by policy changes impacting health care, this study explores the impact of economic hazard areas on the health care quality, specifically in hospital-based emergency departments in the United States. Our main objective is to develop an innovative approach to operationalize the concept of economic hazard within the context of emergency care delivery. Grounded in the literature, we hypothesize that health care facilities that serve densely populated areas with high unemployment and lower incomes will report more emergency visits than less populated areas with lower unemployment and higher incomes.
METHODS
Study Data
The 2014 Area Health Resource File, 2012 American Hospital Association (AHA) Database, 2012 Hospital Compare Database through the Centers for Medicare and Medicaid Services (CMS), 2012 Hospital Value-Based Purchasing (HVBP), and the 2012 CMS Impact File were used for this study (Table 1). The Area Health Resources Files (AHRF) data contain county, state, and national-level health care and population health-related factors pulled from over 50 sources. The AHA database includes information on over 6,000 hospitals in the United States and contains hospital level data. 22 The Hospital Compare database contains hospital level data on all cause readmissions, complications, and deaths within 30 days of a hospital admission for patients hospitalized with 1 of several primary diagnoses. The HVBP database contains a list of participating hospitals and their corresponding scores on clinical process of care, patient experiences, outcomes, and overall HVBP total performance score. The CMS Impact File contains information regarding inpatient prospective payment system and includes hospital case mix, wage index, disproportionate share percentage, outlier payment percentage, cost-to-charge ratio, number of beds, Medicare discharges, and Medicare days as a percentage of total inpatient days.
National Data Sets and Corresponding Variables.

Variables
We identified our quality outcome measure as emergency room visits rate within a hospital service area. We created the variable by dividing the number of emergency room visits by the population of the hospital services area in which the emergency room is located. To define an appropriate construct for economic hazard (our key independent variable), we used three main variables: change in population, income per capita, and the unemployment rate for each hospital within its services area from 2000 to 2012. Three cutoff categories were created: hospitals with areas of low, average, or high levels of economic hazard. A hospital’s service area was originally defined by the National Center for Health Statistics as a “single cluster of contiguous counties which are relatively self-contained with respect to hospital care.”Reference Pickle 23 The definition has since been updated and now reflects a collection of census ZIP codes that define a hospital’s primary market area and which residents are receiving the majority of their care from the hospitals in that area. 24
For our covariate variables, we used both hospital and market level factors. For hospital-level variables, we used the fiscal year 2012 hospital specific pay for performance program payment data used and published by Medicare. This database provides a total performance score for each participating hospital. The higher the performance score, the greater the indication of quality provided by the hospital, and, in turn, the greater the reimbursement. The HVBP program payment adjustment is the total amount by which each hospital’s fiscal year base payment is affected by performance in the HVBP program. In addition, we used hospital size (small < 100 beds, medium >99 beds and <200 beds, and large ≥200 beds), hospital ownership status (government non-federal, for-profit, and not-for-profit), whether or not the hospital was part of a system, whether the hospital provides medical education (teaching and non-teaching hospitals), disproportionate share patient percentage, and a registered nurse per inpatient day (full-time registered nurses divided by inpatient days per 1,000). Our market-level variables were Herfindahl-Hirschman Index (HHI), which is a measure of the size of firms in relation to the industry and an indicator of the amount of competition among them. An HHI score of 1 indicates a monopolistic market, whereas a score that approaches zero indicates an increasingly competitive market (monopolistic environment) (see Table 1).
Statistical Analysis
For the analysis, we used a cross-sectional design approach using multiple sources of secondary data. Univariate, bivariate, multivariate analyses were conducted to examine the impact of economic hazard on hospitals. Prior to conducting the multivariable analysis, the data were examined for normality using Skewness-Kurtosis tests and for multi-collinearity using Pearson’s correlation matrix (all correlation coefficients < 0.60). We reported percentages for categorical variables and means for continuous variables. We used a Poisson regression analysis to examine the predicted probability of emergency room visits per hospitals service area population by selected hospital characteristics using Equation 1. The data did not demonstrate over dispersion.
In Poisson regression, we suppose that the Poisson incidence rate, μ, is determined by a set of k regressor variables and β are the regression coefficients. The expression relating these quantities is as follows:
 $$\eqalignno{\log \left( \mu \right){\equals}&\beta _{0} {\plus}\beta _{1} Economic\,hazard_{1} {\plus}\beta _{2} Hospital{\rm }_{2} \cr&{\plus}\beta _{3} Healthcare\,market_{3} $$
Results are presented as adjusted predicted probabilities (95% CIs). Likelihood ratio chi-square and McFadden’s pseudo R-squared were used to determine the best fitting model.Reference Lemeshow and Hosmer 25 We tested for statistically significant differences using the student’s t test. A two-sided P value of 0.05 was set to denote statistical significance. All statistical analyses were performed using STATA software, version 14.0 (StataCorp, College Station, TX).
In accordance to the policy of the University of North Florida, the research was categorized as exempt by the Institutional Review Board because the study analyzed secondary data that are publicly available.
Results
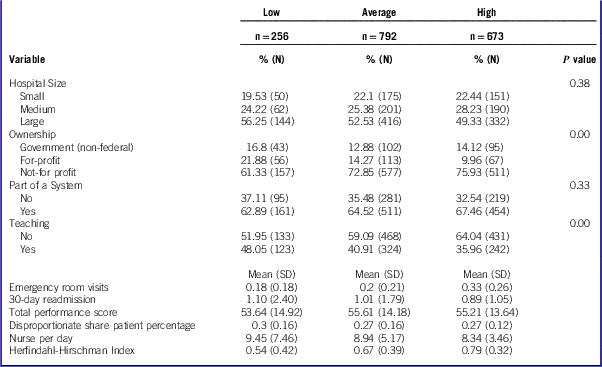
The sample size for the analysis includes 1,721 general medical and surgical hospitals. Organizational characteristics illustrated in Table 2 are reported by their frequency located in each economic hazard condition (low, average, and high). Within the low hazard category, there were, on average, 19.53% small, 24.44% medium, and 56.25 % large-sized hospitals. About 21% identified as for-profit, 16.8% as government non-federally owned, 61.33% as not-for profit, 62.89% as belonging to a system, and 48% as teaching hospitals. On average, for every 1,000 population within the health service area, there were 0.18 emergency room visits and 0.0001 readmissions within 30 days. In addition, there was a total performance score of 53.64, a 30% disproportionate share, 9.45 nurses per inpatient days, and an HHI of 0.54. These results are contrasted to the high hazard environment that contained 22.44% small, 28.23% medium, and 49.33% large hospitals. About 14% identified as owned by the non-federal government, 10% as for-profit, 76% as not-for profit, 67.46% as belonging to a system, and 36% as teaching hospitals. On average, there are 0.33 emergency room visits per 1,000 population in the health services area, 0.0002 readmissions within 30 days of discharge per 1,000 population in the health services area, an average total performance score of 55.21, 27% disproportionate share, 8.34 nurses per day, and an HHI of 0.79. The bivariate analysis reveals that there were relevant differences between ownership and teaching status for the different hazard categories.
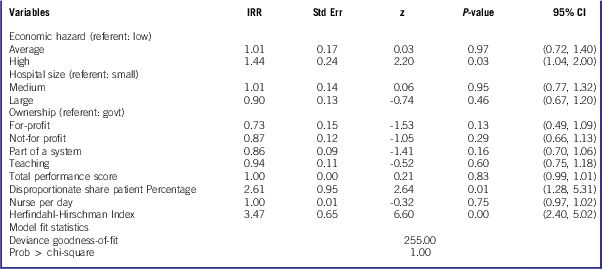
The Poisson regression results shown in Table 3 provide indication that there are no statistically significant differences in the organizational structures of the hospitals in the sample in regard to the predicted probability of emergency room visits within the health services area. However, there is a difference in the incident rate ratio of emergency room visits between environments considered to be experiencing greater amounts of hazard, compared to lower amounts of hazard. Specifically, areas that are classified as high hazard have 1.44 times the risk of experiencing a greater number of emergency room visits than areas that are classified as low hazard. Similarly, organizations that have a higher disproportionate share patient percentage have 2.61 times the risk of experiencing a greater number of emergency room visits. Finally, hospitals located in less competitive markets as identified by the HHI have 3.47 times the risk of experiencing a greater number of emergency room visits than more competitive markets.
DISCUSSION
We analyzed a nationally constructed data set of hospital-based emergency departments to determine whether economically hazardous environments characterized by the change of population, income per capita, and unemployment rate experience a higher number of emergency room visits than areas of lower rated economic hazard risk in the United States. In the United States, emergency departments are uniquely structured and are guided by federal policies that prohibit them from turning away patients who are unable to pay for medical services rendered. Therefore, they are described as “safety net providers” by the Institute of Medicine.Reference Warden, Griffin and Erickson 26 Our hypothesis indicating that highly populated areas with high unemployment with lower income were more likely to report increased emergency room visits was supported. This finding is in line with multiple studies that have found a significant indirect relationship between medical care utilization and changes in economic conditions.Reference Driscoll and Bernstein 27 - Reference Tang, Stein and Hsia 29 Furthermore, a recent study found that a state’s unemployment rate was a statistically significant factor in the hospitals’ emergency room visit and outpatient visit volume.Reference Hughes and Khaliq 28
Moreover, hospital emergency departments that were located in areas with less market competition experienced more emergency room visits. Competitiveness can be seen at multiple levels within the health care industry, and it can be perceived from an organizational level, industry level, and national level. We used competitiveness at an organization level to identify a hospital’s competitive advantage over similar entities.Reference Ștefan, Popa and Dobrin 30 According to a white paper jointly published by the Department of Justice and the Federal Trade Commission, “a dose of competition” has played a critical role in improving and transforming the health care industry. Furthermore, hospitals that are within a competitive market have shown significant improvement in cost, quality, and accessibility.Reference Commission 31
Our findings also suggest that hospitals that service patients in higher economic hazard areas report a higher number of emergency room visits. In the United States, the economic condition of a geographic location dramatically influences the relationship between employment, health coverage, overall costs, and access to care. Because 55% of health insurance coverage is provided through employment, an economic downturn typically results in employers altering health insurance benefits offered by limiting options and reducing cost and increasing cost-sharing provisions.Reference Majerol, Newkirk and Garfield 32 , Reference Bernstein 33 Limitations on benefits and access facilitate the inherited increase in emergency department visits.
Limitations
While contributing to the larger literature, this study has several limitations. First, the study used a cross-sectional design, inhibiting the ability to determine causal relationships. Second, the findings of the study are limited to 1 year, and, thus, our ability to capture hospital changes due to health policy, such as the impact of the Affordable Care Act, is limited to inference. Third, the development of a new construct, such as economic hazard, limits our ability to compare to other findings currently in the literature. Finally, the data sets used have several limitations. For example, the AHA survey relies heavily on self-reported data acquired by asking hospitals to complete the survey, and may present issues of bias and/or social desirability. The AHRF data set provides a combination of a large number of externally collected data sets. This provides an increase in the likelihood of error, and the manipulation of data either through conversion or through defining rankings may arbitrarily change the data or misrepresent county level attributions.
CONCLUSIONS
The economic hazard crisis is complex. Hospitals’ emergency departments are faced with a conflicting role of being a safety net provider and a major source of hospital revenue. During an economic hazard, these emergency departments become the primary source of care for many individuals with lack of health insurance. Our study findings indicate that hospitals that are in high economic hazard areas, higher disproportionate share, and less competitive markets, are at greater risk of having emergency room visits. Hospital administrators and health policy-makers need to work in conjunction to focus efforts on public safety as a key objective in the delivery of emergency medical care. Many emergency department models consist of the introduction of clinic hours or outreach efforts. Further research should extend this research by overlaying like data with geographic information systems software to visualize emergency department usage patterns. This could assist local hospital administrators and emergency managers in high-risk areas to refine their strategic planning to minimize emergency room visits. In addition, hospital administrators could use community-centered research approaches by partnering with multidisciplinary teams consisting of community members and health workers, medical and public health professionals to identify ways to address systemic barriers to health care and negligent health behaviors that lead to preventable emergency room visits. Furthermore, this planning could reduce the number of emergency room visits and increase local resilience to future disasters (both natural and man-made) (Tables 2 and 3).
Descriptive Statistics.

Predicted Probability of Emergency Room Visits Per Hospital Service Area Population by Selected Hospital Characteristics and Economic Hazard Levels.

Notes: IRR is incidence rate ratios for the Poisson model shown earlier. We obtain the IRR by exponentiating the Poisson regression coefficient; z measures the number of standard deviations below or above the population mean of a raw score. Abbreviations: CI, confidence interval; Std Err, standard error.
Conflict of Interest Statement
The authors declare no conflict of interests.
Statement of Authorship
Each author participated and contributed sufficiently to take public responsibility for appropriate portions of the content.