Introduction
Nanotechnology has emerged as a revolutionary approach in agriculture, offering innovative solutions to traditional farming challenges (Santos et al., Reference Santos, Biraku, Nielsen, Ozketen, Ozketen and Hakki2024). The unique properties of nanoparticles, such as their high surface area-to-volume ratio and ability to penetrate plant tissues, significantly influence the physiological and biochemical traits in many plants (Ďúranová et al., Reference Ďúranová, Kšiňan, Kuželová, Šimora, Ďurišová, Olexíková, Ernst and Kolenčík2024). Research has demonstrated that nanoparticles can enhance nutrient uptake efficiency, improve stress tolerance and promote overall plant health of various field crops (Ahmed et al., Reference Ahmed, Javed, Razzaq and Mashwani2021; Singh et al., Reference Singh, Handa and Manchanda2021; Van Nguyen et al., Reference Van Nguyen, Nguyen, Le, Nguyen, Nguyen, Le, Nguyen, Dinh, Hoang and Van Ha2022; Zhang et al., Reference Zhang, Wang, Chen, Cui, Lu, Yang and Zhang2021).
Sugar beet (Beta vulgaris L.) has emerged as a crucial crop in Egypt, second only to sugarcane in its potential for profitability and industrial applications (Ibraheim et al., Reference Ibraheim, Eissa, Galal, Aboelyazied and Abou-ElWafa2024). Its significance extends beyond human consumption, as it provides high-quality energy and serves as animal feed. In Egypt, sugar beet has become a cornerstone of sugar production, accounting for 67.7 % of total output, with a harvested area of 253 825 hectares and an average yield of 53.4 tonnes per hectare (FAO 2022). The Egyptian Ministry of Agriculture and Land Reclamation has prioritized improving sugar beet yield and quality to bridge the gap between sugar consumption and production, recognizing the crop’s potential for winter cultivation and water conservation in reclaimed soils (Aly et al., Reference Aly, Khalil and Abdel Fattah2017).
The application of nanoparticles in sugar beet cultivation has shown promising results. Studies indicate that zinc nanoparticles can significantly improve sugar beet yields compared to traditional treatments, with enhanced sucrose content and plant vigour (Hamze et al., Reference Hamze, Khalili, Mir-Shafiee and Nasiri2024; Singh et al., Reference Singh, Rajput, Lalotra, Agrawal, Ghazaryan, Singh, Minkina, Rajput, Mandzhieva and Alexiou2024). Similarly, nanoparticles have demonstrated effectiveness in improving stress tolerance under saline conditions and enhancing taproot growth and physiological attributes (AbuQamar et al., Reference AbuQamar, El-Saadony, Saad, Desoky, Elrys, Abd El-Mageed, Semida, Abdelkhalik, Mosa and Al Kafaas2024; Elmahdy et al., Reference Elmahdy, Ahmed, Bakr, Abdallah, Abdelghany, El-Sorady, Elbana and Lamlom2023). These findings suggest that nano-fertilizer applications can reduce reliance on chemical inputs while promoting more sustainable agricultural practices.
Ammonium nitrate (NH4NO3) represents one of the most widely used nitrogen fertilizers due to its high solubility and rapid plant availability compared to other nitrogen sources, such as urea (Pasa et al., Reference Pasa, Weinert, Ferreira, Ferreira, Martinez, Pedó, da Silveira Pasa and Carlos2024). In sugar beet cultivation, ammonium nitrate application has been linked explicitly to significant improvements in taproot yields and sucrose content when compared to alternative nitrogen fertilizers (El-Sharnoby, Reference El-Sharnoby2021; Hasanen et al., Reference Hasanen, Elsokkary, Kamel and Abd Elsamea2013).This nitrogen source enhances vegetative growth by increasing leaf area and biomass accumulation, which are critical factors for photosynthesis and overall plant vigour (El-Shazly et al., Reference El-Shazly, El-Dissoky and Awaad2014). Additionally, ammonium nitrate positively impacts the biochemical composition of sugar beets, increasing concentrations of soluble sugars and amino acids essential for quality production (Chen et al., Reference Chen, Li, Li, Li, Zhu, Zhong, Zhang and Li2024a).
Despite the documented benefits of nanoparticles in agriculture and the established effectiveness of ammonium nitrate in sugar beet production, research examining nano-NH4NO3 applications in sugar beet cultivation remains limited. This study addresses this knowledge gap by investigating the effects of foliar nano-NH4NO3 application on yield and quality parameters across diverse sugar beet genotypes in Egypt. The research employs multivariate statistical analyses to understand genotype-treatment interactions, with the primary objective of determining optimal nano-fertilizer concentrations for enhancing sugar beet productivity and quality. The study tests the hypothesis that nano-NH4NO3 foliar applications will elicit cultivar-specific responses, with certain genotype-treatment combinations providing superior performance across yield and quality parameters.
Material and methods
Experimental site location
The field experiment was carried out over two consecutive growing seasons (2022–2023 and 2023–2024) at a private farm located in Sidi Salem, Kafr El-Sheikh Governorate, North Nile Delta, Egypt (31°07ʹ N, 30°05ʹ E, 12 m above sea level) (Figure 1). The study examined the effects of foliar application of nanoparticle NH4NO3 on the growth, physiology, yield and quality traits of five sugar beet (Beta vulgaris L.) varieties grown on clay soil.
Research site location: Sidi Salem, Kafr El-Sheikh Governorate, Egypt.

Weather conditions during the growing seasons
During the 2022–2023 growing season, weather conditions were characterized by moderate temperatures with a mean maximum of 28.4 °C and a mean minimum of 14.2 °C, accompanied by 145 mm of total precipitation concentrated primarily between November and February. Relative humidity averaged between 65–78 %, while wind speeds ranged from 2.1–3.8 m/s. The season experienced two mild frost events in January 2023 that required monitoring. The following 2023–2024 growing season showed slightly warmer conditions with mean maximum temperatures reaching 29.1 °C and minimum temperatures of 13.8 °C, though total precipitation decreased to 132 mm, again concentrated in the December–February period. Relative humidity was marginally lower at 62–75 %, and wind speeds increased slightly to 2.3–4.1 m/s. This season was marked by an extended dry period in February 2024 that necessitated supplemental irrigation to maintain crop health. Both growing seasons exhibited Mediterranean climate patterns characterized by mild, wet winters transitioning to warm, dry summers. Throughout both seasons, irrigation management was implemented strategically to maintain optimal soil moisture levels when natural precipitation proved insufficient. These consistent weather patterns and controlled irrigation practices provided an ideal experimental framework that enabled comprehensive assessment of how different sugar beet varieties responded to varying nanoparticle fertilizer concentrations under representative field conditions, ensuring that climatic variables remained relatively stable across the study period.
Experimental design
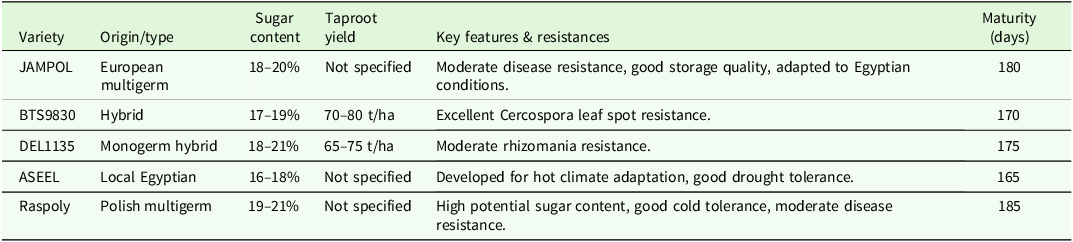
The experimental design used a split-plot arrangement within a randomized complete block design (RCBD) with three replications. Main plots were assigned to the five sugar beet varieties (Table 1), while subplots included three treatments of nanoparticle NH4NO3 foliar spray (0, 50 and 100 ppm). Each experimental unit consisted of a 28 m2 plot with rows spaced 50 cm apart and plants 20 cm apart within rows.
Characteristics of sugar beet varieties used in the field experiment

Nanoparticle NH 4 NO 3 synthesis and characterization
Nanoparticle NH4NO3 was synthesized using a multi-step size reduction process. Commercial NH4NO3 fertilizer was initially subjected to repeated grinding cycles in a conventional grinder for one hour, followed by sieving through a 250 μm mesh. This process was iterated to achieve preliminary size reduction. Subsequently, the pre-ground material underwent further size reduction using a Mastersizer 3000 laser diffraction particle size analyser (Malvern Instruments Ltd., Worcestershire, UK) to obtain nanoparticle-sized powder (Huang et al., Reference Huang, Dou, Li and Wang2018). Morphological characterization of the synthesized nanoparticle NH4NO3 was performed using high-resolution transmission electron microscopy (HR-TEM). A JEM-2100 microscope operating at 200 kV was used to capture high-resolution images of the nanoparticles (Figure 2). This analysis allowed for the visualization and confirmation of the nanoscale dimensions of the synthesized fertilizer particles.
The high-resolution transmission electron microscopy (HR-TEM) images of the (a) Low resolution and (b) High resolution.

Agronomic practices and fertilizer programme
Sugar beet (Beta vulgaris L.) was sown on September 15th in both the 2022–2023 and 2023–2024 growing seasons using multigerm seeds at a rate of 4–5 seeds per planting position (hill) spaced 20 cm apart within rows. Thinning was performed 40 days after sowing to maintain one vigorous plant per hill, a standard practice in Egyptian sugar beet cultivation to ensure uniform plant establishment and optimal resource utilization. This resulted in a final plant density of 100 000 plants/ha.
Soil fertilization was applied uniformly across all plots. Phosphorus was used as calcium superphosphate (15.5% P) at a rate of 31 kg P/ha during soil preparation. Potassium was applied as potassium sulphate (41.5% K) at a rate of 48 kg K/ha in two split applications: half during soil preparation and half 45 days after emergence. Nitrogen was applied as urea (46% N) at a rate of 90 kg N/ha in three equal applications: at sowing, 30 days after emergence and 60 days after emergence, in addition to the experimental foliar nanoparticle NH4NO3 treatments.
Irrigation was managed using a surface irrigation system, with water applied at 10-day intervals during the vegetative growth stage and 15-day intervals during the taproot development stage. Weed control was achieved through a combination of manual weeding and phenmedipham (1 L/ha) application at the 4–6 leaf stage. Pest and disease management followed the principles of integrated pest management (IPM) as recommended by the Sugar Crop Research Institute (El-Zayat, Reference El-Zayat2021).
Site characterization and soil analysis
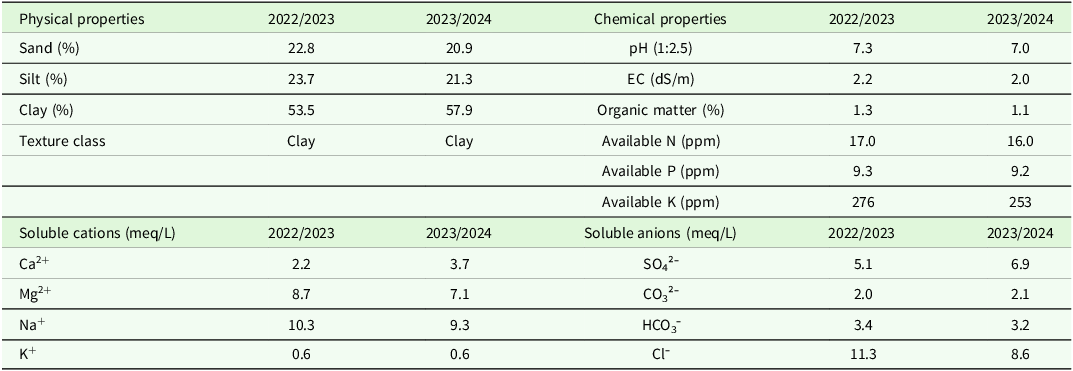
Soil physical and chemical properties were analysed following (Richards, Reference Richard1954) methodology to establish baseline characteristics (Table 2). The experimental site featured heavy clay soil (53.5–57.9% clay) with moderate sand (20.9–22.8%) and silt (21.3–23.7%) fractions. Soil pH ranged from 7.0 to 7.3, indicating slightly alkaline conditions favourable for sugar beet cultivation. Electrical conductivity (EC) measured 2.0–2.2 dS m⁻¹, indicating moderate salinity. Organic matter content ranged from 1.1–1.3%, while available nitrogen remained stable at 16–17 ppm. Available phosphorus was consistently low (9.2–9.3 ppm), and potassium availability was adequate (253–276 ppm). Soluble sodium (9.3–10.3 meq L⁻¹) and chloride (8.6–11.3 meq L⁻¹) levels reflected slightly saline conditions typical of irrigated Mediterranean agricultural systems.
Physical and chemical soil characteristics of the experimental site during 2022/23 and 2023/24 seasons

Data collection and trait measurements
Trait measurements were conducted to evaluate the effects of nano-fertilizers across morphological, physiological, quality and biochemical parameters. The experimental design targeted key pathways through which nanoparticles may influence sugar beet performance: enhanced nutrient uptake affecting taproot development; improved photosynthetic efficiency; modified sugar accumulation; and altered secondary metabolite production. At 120 days after sowing, five representative plants per subplot were randomly selected and carefully excavated. Leaf and taproot tissues were separated, washed and fresh weights recorded. Subsamples were oven-dried at 70 °C for 72 hours to determine dry weights for crop growth rate calculations. Plants were harvested 210 days after sowing from the three central rows of each subplot to minimize edge effects. All plant material was cleaned, topped and processed immediately to ensure measurement accuracy.
Taproot characteristics
Ten randomly selected taproots per plot were measured for length (from crown to tip, in cm) and fresh weight (in grams) after cleaning and topping. These morphological parameters indicate the effects of treatment on storage organ development.
Yield components
Taproot yield (t ha−¹) was determined by weighing all harvestable taproots from the three central rows of each subplot and extrapolating to a per-hectare basis. The outermost rows served as guard rows (border rows excluded from measurements to minimize edge effects from adjacent plots and extrapolated to a per-hectare basis.
Sugar yield was calculated as:
 $${\rm taproot \; yield \times extractable \; sugar \; percentage \; (McGinnus \; 1971).}$$
Growth analysis
Leaf and taproot crop growth rates were calculated using (Watson, Reference Watson1952) Formula:
 $${\rm CGR = (W_{2} - W_{1})/(t_{2} - t_{1})}$$
where W1 and W2 represent dry weights at 120 DAS and harvest, respectively. These physiological measures assess treatment effects on biomass accumulation rates.
Sugar quality traits
Fresh taproot juice samples were analysed for total soluble solids using a hand refractometer and sucrose content using a digital saccharometer (Jensen, Reference Jensen1995). The extractable sugar percentage was calculated following (Reinefeld et al., Reference Reinefeld, Emmerich, Baumarten, Winner and Beiss1974):
 $$\eqalign{\!\rm EXT\% = & \,Sucrose\% \cr & - [0.343(K + Na) + 0.094 \; \alpha-amino \; N + 0.29].}$$
Juice purity was determined as:
 $${\rm (Sucrose/TSS) \times 100 (Carruthers \; and \; Oldfield \; 1961).}$$
Sugar loss to molasses was calculated as:
 $$\eqalign{\rm SLM\% = \, & 0.343(K^{+} + Na^{+}) + 0.094\ (\alpha - amino-N) \cr & \!\!\!\ - 0.31 (Reinefeld \; et \; al., 1974).}$$
These parameters directly assess the commercial potential for sugar extraction.
Biochemical analyses
Taproot protein content was determined as total nitrogen × 6.25 (AOAC 1990). Total nitrogen content was determined using the Kjeldahl digestion method (AOAC 1990). Approximately 0.5 g of dried, ground taproot tissue was digested with concentrated H2SO4 in the presence of a catalyst mixture, then steam-distilled and titrated. Total carbohydrates were measured using the (DuBois et al., Reference DuBois, Gilles, Hamilton, Rebers and Smith1956) method and expressed as mg/g dry weight. Total phenolic compounds were quantified using UV/Vis spectrophotometry at 750 nm (Waterhouse, Reference Waterhouse2002).
The alkalinity coefficient was calculated as:
 $${\rm (K + Na)/\alpha-amino N (Harvey \; and \; Dutton, \; 1993).}$$
These biochemical parameters assess the effects of treatment on plant metabolism and nutritional composition.
Statistical analysis
Data analysis employed a mixed-effects model appropriate for the split-plot design structure using SAS software version 9.4 (SAS Institute Inc., Cary, NC, USA). The statistical model included:
Fixed effects: Season, nanoparticle spray treatment, cultivar and all possible interactions. Random effects: Replication nested within season and subplot error terms. Repeated measures: Season was treated as a repeated factor with appropriate covariance structure.
The model structure was:
 $$\eqalign{\rm Y\_ijkl =\ & {\rm \mu} + \rm S\_i + R(S)\_ij + C\_k + SC\_ik + {\rm \varepsilon} a\_ijk \cr & \!\!+ N\_l + SN\_il + \rm CN\_kl + SCN\_ikl + {\rm \varepsilon} b\_ijkl}$$
where Y_ijkl represents the response variable, μ is the overall mean, S_i is the season effect, R(S)_ij is the replication within season effect, C_k is the cultivar effect, N_l is the nanoparticle treatment effect and ϵ terms represent random errors at main plot (ϵa) and subplot (ϵb) levels.
Analysis of variance (ANOVA) was conducted to assess the significance of the main effects and interactions. Mean separations were performed using Tukey’s Honest Significant Difference (HSD) test at p ≤ 0.05. When three-way interactions were significant (p ≤ 0.05), data were analysed separately by season to examine two-way interactions. When two-way interactions were significant, simple effects were analysed within levels of the interacting factor. Non-significant interaction terms (p > 0.05) were retained in the model to maintain appropriate error terms for hypothesis testing, following standard split-plot analysis protocols. Model assumptions were verified through residual analysis, including tests for normality (Shapiro-Wilk test) and homogeneity of variance (Levene’s test). Correlation analysis among traits was conducted using Pearson correlation coefficients. Hierarchical clustering analysis was performed using Euclidean distance and Ward’s linkage method to identify trait response patterns and treatment groupings. All multivariate analyses were conducted using R version 4.3.1 (Team, 2023) in RStudio version 2023.06.1. Hierarchical clustering was performed using the ‘stats’ package (base R), and visualizations were created using ‘ggplot2’ version 3.4.3 (Wickham and Bryan, Reference Wickham and Bryan2023) and ‘pheatmap’ version 1.0.12 (Kolde, Reference Kolde2019) packages. Correlation analysis used the ‘corrplot’ package version 0.92 (Wei and Simko, Reference Wei and Simko2021).
Results
Analysis of variance for sugar beet traits
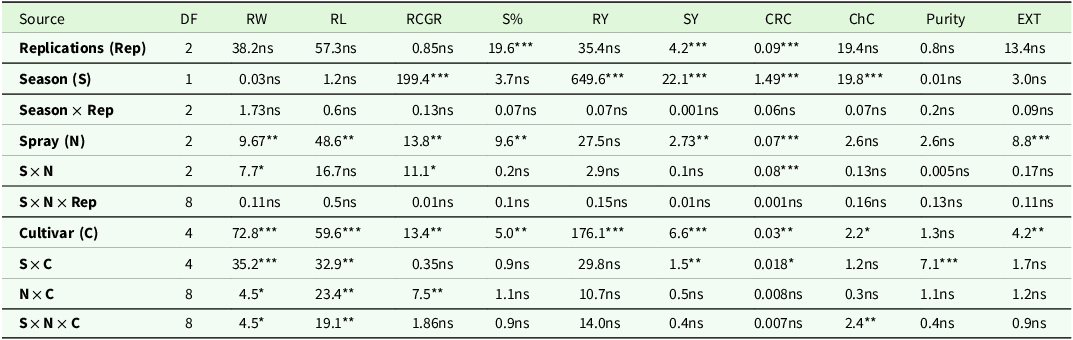
Analysis of variance revealed cultivar as the dominant source of variation for most measured traits (Table 3). Taproot yield and sugar yield showed highly significant cultivar effects (F = 44.0, p < 0.001 and F = 33.0, p < 0.001, respectively), with mean squares substantially larger than those for nanoparticle treatment effects. Nanoparticle spray treatments showed significant effects on taproot weight (F = 4.8, p < 0.01), taproot length (F = 24.3, p < 0.01), sucrose percentage (F = 4.8, p < 0.01), sugar yield (F = 13.7, p < 0.01) and carotenoid content (F = 35.0, p < 0.001). Seasonal effects were significant for multiple traits, most notably for taproot crop growth rate (F = 99.7, p < 0.001), taproot yield (F = 324.8, p < 0.001) and sugar yield (F = 110.5, p < 0.001). Significant three-way interactions (Season × Cultivar × Nanoparticle) were detected for taproot weight (p < 0.05), taproot length (p < 0.01) and chlorophyll content (p < 0.01), indicating context-dependent treatment responses. Two-way interactions between nanoparticle treatment and cultivar were significant for taproot weight (p < 0.05) and taproot length (p < 0.01).
Analysis of variance for key traits in sugar beet cultivars under different seasons and nanoparticle spray treatments

RW: taproot weight (g), RL: taproot length (cm), RCGR: taproot crop growth rate (g/cm²/day), S%: sucrose percentage (%), RY: taproot yield (t/ha), SY: sugar yield (t/ha), CRC: carotenoid content (mg/g FW), ChC: chlorophyll content (mg/g FW), EXT: extractable solids (%), Purity: juice purity (%).
*** p < 0.001, **p < 0.01, *p < 0.05, ns: not significant. The table presents mean squares values for each source of variation.
Main effects of cultivar and nanoparticle treatment
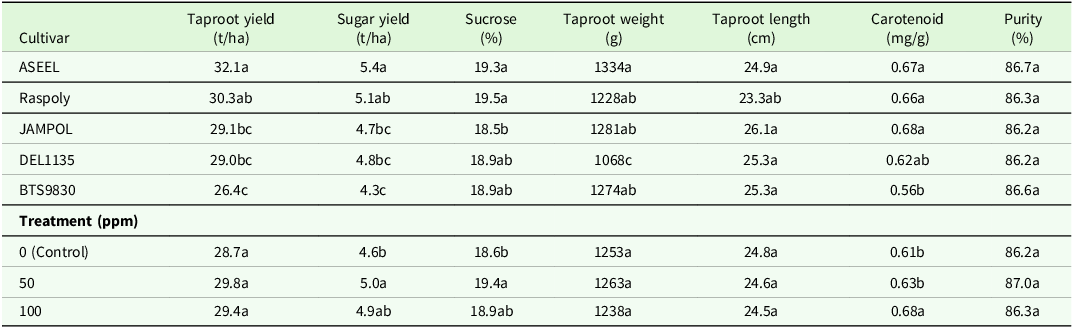
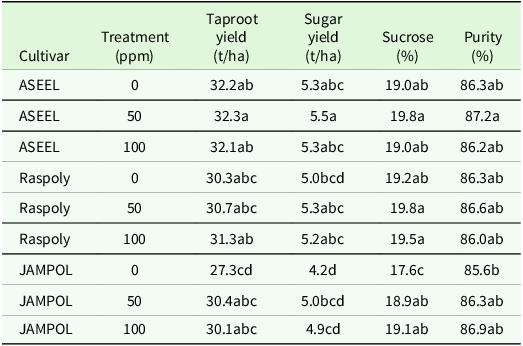
Cultivar selection significantly influenced all primary productivity parameters (Table 4). ASEEL achieved the highest taproot yield (32.1 t/ha) and sugar yield (5.4 t/ha), significantly outperforming BTS9830 (26.4 t/ha taproot yield, 4.3 t/ha sugar yield). Taproot weight followed similar patterns, with ASEEL producing the largest taproots (1334 g average) compared to DEL1135 (1068 g). Sucrose content varied from 18.5% (JAMPOL) to 19.5% (Raspoly), though differences among most cultivars were not statistically significant. Carotenoid content ranged from 0.56 mg/g in BTS9830 to 0.68 mg/g in JAMPOL. Nanoparticle treatments influenced several parameters, with response patterns varying by concentration (Table 4). The 50 ppm treatment produced the highest sugar yield (5.0 t/ha), significantly exceeding control (4.6 t/ha, p < 0.05), representing an 8.7% improvement. This enhancement was associated with increased sucrose percentage (19.4% vs 18.6% in controls). Taproot yield showed no significant response to nanoparticle treatments (p = 0.12), with values ranging from 28.7 to 29.8 t/ha across treatments. Carotenoid content demonstrated a dose-dependent response, with the 100 ppm treatment producing significantly higher levels (0.68 mg/g) compared to the control (0.61 mg/g) and the 50 ppm treatment (0.63 mg/g), representing an 11.5% increase over the control. Taproot morphological parameters (weight and length) showed no significant main effects of nanoparticle treatment. Juice purity remained consistently high across all treatments (86.2–87.0%), indicating that nanoparticle applications did not compromise sugar extraction quality. Cultivar-specific responses to nanoparticle treatments were most evident in ASEEL and Raspoly (Table 5). ASEEL achieved maximum sugar yield (5.5 t/ha) and sucrose content (19.8%) under 50 ppm treatment. Raspoly similarly responded favourably to 50 ppm application, achieving 5.3 t/ha sugar yield with 19.8% sucrose. Both cultivars showed minimal additional benefits from 100 ppm treatment compared to 50 ppm, with performance metrics stabilizing or slightly declining at higher concentrations.
Cultivar and nanoparticle treatment main effects on sugar beet performance parameters across two growing seasons (averaged across all treatments)

Values followed by the same letter within each column are not significantly different according to Tukey’s HSD test (p ≤ 0.05). Data represent means of three replications per treatment combination.
Cultivar × treatment interactions for key performance parameters across two growing seasons

Values followed by the same letter within each column are not significantly different according to Tukey’s HSD test (p ≤ 0.05). Data represent means across replications.
Seasonal variation in treatment responses
Performance parameters differed substantially between growing seasons, with second-season values consistently exceeding first-season measurements. Taproot yield averaged 23.8 t/ha in the first season compared to 33.2 t/ha in the second season, representing a 39.5% increase. Sugar yield followed similar patterns (4.2 vs 5.4 t/ha for first and second seasons, respectively). Growth rates also showed pronounced seasonal differences, with taproot crop growth rate averaging 5.3 g/cm²/day in the first season and 7.5 g/cm²/day in the second season. The magnitude of nanoparticle treatment effects varied between seasons, as indicated by significant Season × Nanoparticle interactions for taproot weight (p < 0.05) and taproot crop growth rate (p < 0.05). First-season responses to the 50 ppm treatment were more modest than second-season responses, particularly for sugar yield parameters. Protein content decreased from the first season (23.0% average) to the second season (20.9% average), while carotenoid content increased with season (0.60 vs 0.67 mg/g).
Multivariate analysis of treatment-cultivar response patterns
Hierarchical clustering analysis of 18 traits across all treatment combinations revealed distinct response patterns (Figure 3). The analysis identified four trait clusters and three treatment clusters based on similarity in response profiles. Trait Group I comprised yield-related parameters (taproot yield, sugar yield, taproot crop growth rate, protein content), which clustered together based on similar response patterns to treatments. These traits showed strong positive correlations and responded favourably to higher nanoparticle concentrations in specific cultivars. Trait Group II included sugar quality parameters (purity, sucrose percentage, extractable sugar, total soluble solids), indicating coordinated responses among processing quality traits. Trait Group III consisted of taproot morphology parameters (taproot weight, taproot length) along with total phenolic content and alkalinity coefficient. Trait Group IV encompassed physiological indicators including leaf crop growth rate, total carbohydrate content, total sugar content and chlorophyll content, showing unique and sometimes contrasting patterns across treatments. Treatment combinations segregated into three main clusters. Cluster I included all ASEEL treatments (0, 50, 100 ppm) and all Raspoly treatments (0, 50, 100 ppm), indicating consistent response patterns within these cultivars regardless of nanoparticle concentration. Cluster II comprised JAMPOL treatments (50 and 100 ppm) and all BTS9830 treatments (0, 50, 100 ppm). Cluster III contained JAMPOL control (0 ppm) and all DEL1135 treatments (0, 50, 100 ppm). Within Cluster I, dose-dependent responses were evident for several traits. Leaf crop growth rate, total carbohydrate content, taproot weight, taproot yield, sugar yield, protein content, sucrose percentage and extractable sugar showed progressive enhancement with increasing nanoparticle concentration in ASEEL and Raspoly cultivars, particularly at the 50 and 100 ppm levels. Cluster II treatments exhibited the highest values for purity and total soluble solids but the lowest values for sugar yield, taproot yield and carotenoid content among all treatment groups. Cluster III treatments showed elevated chlorophyll and total sugar content but reduced performance for sucrose percentage, total soluble solids, purity and extractable sugar compared to other clusters. The clustering analysis confirmed cultivar-specific response patterns to nanoparticle applications, with ASEEL and Raspoly showing more consistent positive responses across multiple traits than other cultivars tested.
Hierarchical clustering heatmap showing the combined effects of nanoparticle spray treatments and five sugar beet cultivars on 18 agronomic and biochemical traits. The heatmap utilizes Euclidean distance and Ward’s linkage method to group both traits (horizontal axis) and treatment combinations (vertical axis) based on similarity in their response profiles. The traits are divided into four distinct clusters (I, II, III, IV), indicating varying levels of response. The treatment combinations form three clusters, with clear separation based on both cultivar and nanoparticle concentration. The chlor scale represents normalized z-scores, where red signifies higher trait expression and blue indicates lower expression. RW: taproot weight (g), RL: taproot length (cm), LCGR: Leaf crop growth rate (g/cm²/day), RCGR: taproot crop growth rate (g/cm²/day), S: Sucrose percentage (%), TSS: Total soluble solids (%), RY: taproot yield (t/ha), SY: Sugar yield (t/ha), TPC: Total phenolic content (mg GAE/g FW), TCC: Total carbohydrate content (mg/g FW), PC: Protein content (%), TSC: Total sugar content (mg/g FW), CRC: Carotenoid content (mg/g FW), ChC: Chlorophyll content (mg/g FW), SLM: Sugar loss in molasses (%), EXT: Extractable solids (%), AC: Alkalinity coefficient (μmol TE/g).

Discussion
Nanoparticle treatment effects and dose-response patterns
The present study revealed mixed results for nano-NH4NO3 foliar applications on sugar beet performance. While taproot yield, the primary economic parameter, showed no significant response to nanoparticle treatments, some quality and biochemical parameters demonstrated treatment effects. The 12% increase in carotenoid content under 100 ppm treatment provides evidence of nanoparticle uptake and biological activity, consistent with previous findings that nanoparticles can influence plant secondary metabolite production (Kumar et al., Reference Kumar, Singh, Raliya and Tiwari2021; Prasad et al., Reference Prasad, Bhattacharyya and Nguyen2017). The observed dose-response pattern, with 50 ppm treatments generally outperforming higher concentrations, aligns with established principles of nanoparticle phytotoxicity thresholds (Dimkpa and Bindraban, Reference Dimkpa and Bindraban2017; Kah et al., Reference Kah, Tufenkji and White2019). The reduction in leaf crop growth rate in DEL1135 from 3.36 to 2.05 g/cm²/day between 50 and 100 ppm treatments suggests potential negative effects at higher concentrations, supporting previous observations of concentration-dependent nanoparticle toxicity (Liu and Lal Reference Liu and Lal2015). The maintenance of juice purity above 85 % across all treatments indicates that nano-NH4NO3 applications did not adversely affect sugar extraction quality, which is crucial for commercial sugar production (HAMED et al., Reference Hamed, Elgezery, Abou Hussien, Faiyad, Emara and Abdel-Hakim2025; Shaib and Hany, Reference Shaib and Hany2023). However, the lack of significant improvement in extractable sugar content suggests limited practical benefits for industrial processing.
Cultivar-specific responses and genetic factors
The pronounced cultivar × treatment interactions observed in this study highlight the importance of genetic background in determining nanoparticle responsiveness. ASEEL consistently achieved superior performance across multiple parameters, suggesting genetic traits that may facilitate better nutrient utilization efficiency (Fasahat et al., Reference Fasahat, Aghaeezadeh, Jabbari, Sadeghzadeh Hemayati and Townson2018). This cultivar-specific response pattern is consistent with previous research demonstrating genetic variation in stress tolerance and nutrient use efficiency among sugar beet genotypes (Curcic et al., Reference Curcic, Ciric, Nagl and Taski-Ajdukovic2018; Miglani et al., Reference Miglani, Parveen, Kumar, Ansari, Khanna, Rawat, Panda, Bisht, Upadhyay and Ansari2022).
The transformation of DEL1135 from poor first-season performance to competitive second-season yields illustrates the complex nature of genotype × environment × treatment interactions in sugar beet production (Schnepel and Hoffmann, Reference Schnepel and Hoffmann2016). Such interactions suggest that breeding programmes could potentially select for enhanced responsiveness to nano-fertilizer applications, though the economic benefits would need careful evaluation given the limited yield responses observed. The three-way interactions for morphological traits indicate that genetic control of nanoparticle response is environmentally dependent, supporting previous findings that sugar beet performance is strongly influenced by the interaction between genetic factors and growing conditions (Stephan et al., Reference Stephan, Kroner, Romer and Rösel2019).
Seasonal effects and environmental interactions
The superior second-season performance across most parameters reflects the strong environmental influence on sugar beet production. Enhanced growth rates, particularly the 15–30 % increase in taproot and leaf crop growth rates, align with previous observations that favourable weather conditions significantly impact sugar beet development (Schnepel and Hoffmann, Reference Schnepel and Hoffmann2016). The seasonal variation in protein content patterns, with higher first-season values (up to 23.6 %) declining in the second season, may reflect changes in nitrogen availability and plant maturation processes rather than direct nanoparticle effects. This pattern has been previously observed in sugar beet under varying nitrogen management regimes (Chen et al., Reference Chen, Zhang, Liu, Ni and Wu2024b; El-Sharnoby et al., Reference El-Sharnoby, Badr and Abo Elenen2021).
Limitations and practical implications
Several limitations constrain the interpretation of these findings. First, while experiments were conducted within the same farm property, the use of two different field plots with distinct soil characteristics (organic matter: 1.3 vs. 1.1 %; available K: 276 vs. 253 ppm) introduces site variation that confounds temporal (year-to-year) effects. This quasi-spatial replication, while agronomically sound for preventing treatment carry-over, limits our ability to separate true seasonal weather effects from inherent plot-to-plot soil variability. Future studies should employ true multi-location trials across diverse soil types and climatic zones, with each location maintained across multiple years, to better partition genotype × environment × treatment interactions.
Conclusion
This two-season field study demonstrated significant interactions between nanoparticle NH4NO3 foliar treatments, sugar beet cultivars and environmental conditions. The second growing season consistently produced superior performance across all measured parameters, highlighting the importance of optimal growing conditions for sugar beet production. Nanoparticle NH4NO3 foliar applications at 50 ppm concentration showed cultivar-specific effects on sugar yield, with ASEEL and Raspoly demonstrating 7–11% improvements while other cultivars showed minimal response. This genotype-by-treatment interaction indicates that nano-fertilizer efficacy depends strongly on genetic background, and main effects alone do not adequately characterize treatment performance. These findings demonstrate that targeted nano-fertilizer applications can simultaneously enhance sugar beet productivity and quality when matched with appropriate cultivars, offering a precision agriculture approach for sustainable sugar production intensification.
Data availability statement
The data that support the findings of this study are available on request from the corresponding author.
Acknowledgements
We gratefully acknowledge Dr. Ibrahim S.H.El-Gamal for granting permission to research his land. This work would not have been possible without his support.
Author Contributions
Conceptualization, N.B.; Data curation, M.M.E., N.B., G.F., N.N. and I.G.; Formal analysis, A.M.A, H. R.,N.B and S.F.L.; Funding acquisition, H.M.A.; Investigation, A.A.A.E and M.M.; Methodology, A.A.A.E, A.E, T.Z., N.N., G.F. and S.F.L.; Project administration, G.F., T.Z. and S.F.L.; Resources, A.A.S, N.B, N.N. and I.G.; Software, A.A.A.E.; Supervision, A.M.A and I.G.; Validation, A.A.A.E, T.Z., G.F, A.A.S. and S.F.L.; Visualization, G.F., T.Z. and S.F.L.; Writing – original draft, A.M.A, M.M.E. and S.F.L.; Writing – review & editing, A.M.A, G.F. and S.F.L.
Funding statement
This research received no specific grant from any funding agency, commercial or not-for-profit sectors.
Competing interests
The authors declare no competing interests.
Ethical standards
This article does not contain any studies with human or animal subjects. The current experimental research and field study including the collection of plant material, is complying with relevant institutional, national and international guidelines and legislation and used for research and development.