1. Introduction
An incompressible flow under rotation will experience the effect of the Coriolis force altering its dynamical behaviour (Greenspan Reference Greenspan1968). At sufficiently high rotation rates it will suppress the velocity gradients along the direction of rotation bringing the flow in a quasi-two-dimensional (quasi-2D) state in which the flow varies only along two dimensions. This behaviour is due to the Taylor–Proudman theorem obtained for flows in which the eddy turnover time is much longer than the rotation period. In addition to rendering the flow quasi-2D a fast rotating system supports inertial waves whose frequency increases linearly with the rotation rate. Their fast dispersive dynamics weaken the nonlinear interactions allowing for some analytical treatment in the framework of weak wave turbulence theory (Galtier Reference Galtier2003; Nazarenko Reference Nazarenko2011). The interplay of the two phenomena, quasi-2D and wave turbulence, can lead to a plethora of other phenomena, as often observed in natural flows.
Many different situations can be considered for rotating fluids that can lead to distinct results depending on the forcing mechanism, and the value of the involved control parameters. For example, different results can be envisioned for forced turbulence if the forcing mechanism injects energy exclusively to the quasi-2D component of the flow or if the forcing injects energy solely to the inertial waves (Sen et al. Reference Sen, Mininni, Rosenberg and Pouquet2012). Differences are also expected if the domain size is increased and more dynamical wavenumbers are introduced into the system. The presence of helicity has also been shown to affect the behaviour of the forward cascade (Teitelbaum & Mininni Reference Teitelbaum and Mininni2009).
The large number of different possibilities has led to the emergence of numerous experimental and numerical studies. These studies of rotating turbulence although numerous, they have to face among other challenges this wide parameter space and different experimental set-ups have been considered. First experiments in rotating tanks date back to Hopfinger, Gagne & Browand (Reference Hopfinger, Gagne and Browand1982). Since then, numerous experiments have been constructed expanding the range of parameter space covered (Boubnov & Golitsyn Reference Boubnov and Golitsyn1986; Morize, Moisy & Rabaud Reference Morize, Moisy and Rabaud2005; Ruppert-Felsot et al. Reference Ruppert-Felsot, Praud, Sharon and Swinney2005; Sugihara, Migita & Honji Reference Sugihara, Migita and Honji2005; Davidson, Staplehurst & Dalziel Reference Davidson, Staplehurst and Dalziel2006; Morize & Moisy Reference Morize and Moisy2006; Bewley et al. Reference Bewley, Lathrop, Maas and Sreenivasan2007; Staplehurst, Davidson & Dalziel Reference Staplehurst, Davidson and Dalziel2008; van Bokhoven et al. Reference van Bokhoven, Clercx, van Heijst and Trieling2009; Kolvin et al. Reference Kolvin, Cohen, Vardi and Sharon2009; Lamriben, Cortet & Moisy Reference Lamriben, Cortet and Moisy2011; Yarom, Vardi & Sharon Reference Yarom, Vardi and Sharon2013). The increase of computational power has also allowed the study of rotating flows by simulations. Most numerical investigations have focused on decaying turbulence (Bardina, Ferziger & Rogallo Reference Bardina, Ferziger and Rogallo1985; Mansour, Gambon & Speziale Reference Mansour, Gambon and Speziale1992; Bartello, Metais & Lesieur Reference Bartello, Metais and Lesieur1994; Hossain Reference Hossain1994; Squires et al. Reference Squires, Chasnov, Mansour and Cambon1994; Godeferd & Lollini Reference Godeferd and Lollini1999; Smith & Waleffe Reference Smith and Waleffe1999; Morinishi, Nakabayashi & Ren Reference Morinishi, Nakabayashi and Ren2001; Müller & Thiele Reference Müller and Thiele2007; Thiele & Müller Reference Thiele and Müller2009; Teitelbaum & Mininni Reference Teitelbaum and Mininni2010; Yoshimatsu, Midorikawa & Kaneda Reference Yoshimatsu, Midorikawa and Kaneda2011), with more recent investigations of forced rotating turbulence both at large scales (Yeung & Zhou Reference Yeung and Zhou1998; Mininni, Alexakis & Pouquet Reference Mininni, Alexakis and Pouquet2009; Mininni & Pouquet Reference Mininni and Pouquet2009, Reference Mininni and Pouquet2010; Mininni, Rosenberg & Pouquet Reference Mininni, Rosenberg and Pouquet2012) and at small scales in order to observe the development of an inverse cascade (Smith & Waleffe Reference Smith and Waleffe1999; Mininni & Pouquet Reference Mininni and Pouquet2009; Teitelbaum & Mininni Reference Teitelbaum and Mininni2009). Computational cost however did not allow for an exhaustive coverage of the parameter space. Small viscosity fluids (large Reynolds numbers) and high rotation rates (small Rossby numbers) put strong restrictions on simulations. Thus, typically either moderate Reynolds numbers and small Rossby numbers are reached or moderate Rossby numbers and large Reynolds numbers. In addition, these runs have not reached a steady state that requires long integration times.
The present work attempts to overcome some of these limitations by focusing on one particular forcing mechanism and varying systematically the rotation rate and the viscosity. The aim is to understand and map the parameter space of a forced rotating flow. Thus, the focus here is on a large number of simulations at moderate resolutions rather than a few high-resolution runs. The object of the study is the steady state of a flow in a triple-periodic square box of side
 $2{\rm\pi}L$
forced by a body force
 $\boldsymbol{F}=F_{0}\,\boldsymbol{f}$
of forcing amplitude
 $F_{0}$
in the presence of rotation
 ${\it\Omega}$
in the
 $\boldsymbol{z}$
direction. To the best of the author’s knowledge this is the first study of forced rotating flows in the steady state. In this set-up the Navier–Stokes equations for a unit density fluid with viscosity
 ${\it\nu}$
, non-dimensionalized by the forcing amplitude
 $F_{0}$
and the box size
 $L$
are
 $$\begin{eqnarray}\partial _{t}\boldsymbol{u}=\mathbb{P}\left[\boldsymbol{u}\times \boldsymbol{w}\right]+\mathit{Ro}_{F}^{-1}\mathbb{P}\left[\boldsymbol{u}\times \boldsymbol{e}_{\boldsymbol{ z}}\right]+\mathit{Re}_{F}^{-1}{\rm\Delta}\boldsymbol{u}+\boldsymbol{f},\end{eqnarray}$$
where
 $\boldsymbol{u}$
is the velocity field (measured in units of
 $\sqrt{F_{0}L}$
) satisfying
 $\boldsymbol{{\rm\nabla}}\boldsymbol{\cdot }\boldsymbol{u}=0$
. The vorticity field is given by
 $\boldsymbol{w}=\boldsymbol{{\rm\nabla}}\times \boldsymbol{u}$
. The unit vector in the
 $z$
direction is
 $\boldsymbol{e}_{\boldsymbol{z}}$
and
 $\mathbb{P}$
is the projection operator to solenoidal fields that in the examined triple-periodic domain can be written as
 $$\begin{eqnarray}\mathbb{P}[\boldsymbol{g}]\equiv -{\it\Delta}^{-1}\boldsymbol{{\rm\nabla}}\times \boldsymbol{{\rm\nabla}}\times \boldsymbol{g}=\boldsymbol{g}-\boldsymbol{{\rm\nabla}}{\it\Delta}^{-1}(\boldsymbol{{\rm\nabla}}\boldsymbol{\cdot }\boldsymbol{g})\end{eqnarray}$$
with
 ${\it\Delta}^{-1}$
being the inverse Laplace operator. The term
 $\boldsymbol{{\rm\nabla}}{\it\Delta}^{-1}(\boldsymbol{{\rm\nabla}}\boldsymbol{\cdot }\boldsymbol{g})$
in (1.2) is equivalent to a pressure gradient term
 $\boldsymbol{{\rm\nabla}}P$
that guarantees incompressibility. The two control parameters in (1.1) are given by
 $\mathit{Re}_{F}\equiv \sqrt{F_{0}L}/{\it\nu}$
a Reynolds number based on the forcing amplitude and
 $\mathit{Ro}_{F}\equiv \sqrt{F_{0}}/2{\it\Omega}\sqrt{L}$
a Rossby number based on the forcing amplitude. The square of
 $\mathit{Re}_{F}$
is sometimes referred as the Grashof number. A more common choice for non-dimensionalization is the space–time-averaged squared velocity
 $U=\langle \langle \boldsymbol{u}\boldsymbol{\cdot }\boldsymbol{u}\rangle _{V}\rangle _{T}^{1/2}$
, where the angular brackets stand for space and time average:
 $$\begin{eqnarray}\langle \,f\rangle _{V}\equiv \frac{1}{(2{\rm\pi})^{3}}\int _{0}^{2{\rm\pi}}\int _{0}^{2{\rm\pi}}\int _{0}^{2{\rm\pi}}f\text{d}x\text{d}y\text{d}z,\quad \langle \,f\rangle _{T}\equiv \lim _{T\rightarrow \infty }\frac{1}{T}\int _{0}^{T}f\text{d}t.\end{eqnarray}$$
Using
 $U$
we can obtain the usual definitions of the Reynolds
 $\mathit{Re}_{U}$
and Rossby
 $\mathit{Ro}_{U}$
number as
 $\mathit{Re}_{U}=\mathit{Re}_{F}U$
and
 $\mathit{Ro}_{U}=\mathit{Ro}_{F}U$
. We note however that
 $\mathit{Re}_{U}$
and
 $\mathit{Ro}_{U}$
are not true control parameters of the examined dynamical system, since they are measured a posteriori. They are connected to the true control parameters
 $\mathit{Re}_{F},\mathit{Ro}_{F}$
by a map that needs however to be determined. As it turns out the map from the pair (
 $\mathit{Re}_{F},\mathit{Ro}_{F}$
) to (
 $\mathit{Re}_{U},\mathit{Ro}_{U}$
) is neither unique (for the same (
 $\mathit{Re}_{F},\mathit{Ro}_{F}$
) two different states with different (
 $\mathit{Re}_{U},\mathit{Ro}_{U}$
) exist) nor onto (not all pairs of (
 $\mathit{Re}_{U},\mathit{Ro}_{U}$
) can be obtained by a suitable choice of (
 $\mathit{Re}_{F},\mathit{Ro}_{F}$
)).
A third choice for non-dimensionalization is the energy dissipation rate
 ${\it\epsilon}$
that is defined as
 $$\begin{eqnarray}{\it\epsilon}\equiv \mathit{Re}_{F}^{-1}\langle \langle \boldsymbol{w}\boldsymbol{\cdot }\boldsymbol{w}\rangle _{V}\rangle _{T}=\langle \langle \,\boldsymbol{f}\boldsymbol{\cdot }\boldsymbol{u}\rangle _{V}\rangle _{T}.\end{eqnarray}$$
The last equality is due to the energy conservation property of the nonlinear and the rotation term. The new parameters that can be defined are
 $\mathit{Re}_{D}=\mathit{Re}_{F}{\it\epsilon}^{1/3}$
and
 $\mathit{Ro}_{D}=\mathit{Ro}_{F}{\it\epsilon}^{1/3}$
. This choice of control parameters is mostly met in theoretical investigations (such as weak wave turbulence theory). As with the case of (
 $\mathit{Re}_{U},\mathit{Ro}_{U}$
), the parameters based on the energy dissipation (
 $\mathit{Re}_{D},\mathit{Ro}_{D}$
) can only be determined a posteriori and are not true control parameters. They do provide however a better measure of the strength of turbulence than the other two definitions. The three choices of control parameter pairs can be summarized as
 $\mathit{Re}=\mathscr{U}L/{\it\nu}$
,
 $\mathit{Ro}=\mathscr{U}/(2{\it\Omega}L)$
where the dimensional velocity
 $\mathscr{U}$
corresponds to the choice
 $\mathscr{U}=\sqrt{F_{0}L}$
for (
 $\mathit{Re}_{F},\mathit{Ro}_{F}$
),
 $\mathscr{U}=\langle \tilde{u} ^{2}\rangle _{V}^{1/2}$
for (
 $\mathit{Re}_{U},\mathit{Ro}_{U}$
) and
 $\mathscr{U}=(\tilde{{\it\epsilon}}L)^{1/3}$
for (
 $\mathit{Re}_{D},\mathit{Ro}_{D}$
), where
 $\tilde{u}$
and
 $\tilde{{\it\epsilon}}$
are the dimensional velocity and energy dissipation rate, respectively. A measure of the rotation rate in the small scales is given by the so-called micro-Rossby number defined as
 $\mathit{Ro}_{{\it\lambda}}\equiv \langle \langle \tilde{\boldsymbol{w}}\boldsymbol{\cdot }\tilde{\boldsymbol{w}}\rangle _{\boldsymbol{V}}\rangle _{\boldsymbol{T}}^{1/2}/2{\it\bf\Omega}$
where
 $\tilde{\boldsymbol{w}}$
is the dimensional vorticity field. Using the definition of
 $\mathit{Ro}_{D},\mathit{Re}_{D}$
and
 $\tilde{{\it\epsilon}}$
it can be shown that in our notation
 $\mathit{Ro}_{{\it\lambda}}=\mathit{Re}_{D}^{1/2}\mathit{Ro}_{D}$
.
The flow in this study is forced by the Taylor–Green (TG) vortex at wavenumber
 $q$
:
 $$\begin{eqnarray}\boldsymbol{f}=2\left\{\begin{array}{@{}ll@{}}\quad & \boldsymbol{e}_{\boldsymbol{x}}\sin (qx)\cos (qy)\sin (qz)\\ -\quad & \boldsymbol{e}_{\boldsymbol{y}}\cos (qx)\sin (qy)\sin (qz)\\ \quad & \boldsymbol{e}_{\boldsymbol{z}}\,0.\end{array}\right.\end{eqnarray}$$
It is normalized so that
 $\langle \,\boldsymbol{f}\boldsymbol{\cdot }\boldsymbol{f}\rangle _{V}^{1/2}=1$
. TG is a archetypal example of a non-helical flow that leads to a fast generation of small-scale structures and has been one of the first examples to study as a candidate for finite time singularity of the Euler equations (Brachet et al.
Reference Brachet, Meneguzzi, Vincent, Politano and Sulem1992). Owing to its simplicity it has served as a model of many laboratory flows (Maurer & Tabeling Reference Maurer and Tabeling1998; Monchaux et al.
Reference Monchaux, Berhanu, Bourgoin, Moulin, Odier, Pinton, Volk, Fauve, Mordant, Pétrélis, Chiffaudel, Daviaud, Dubrulle, Gasquet, Marié and Ravelet2007, Reference Monchaux, Berhanu, Aumaître, Chiffaudel, Daviaud, Dubrulle, Ravelet, Fauve, Mordant, Pétrélis, Bourgoin, Odier, Pinton, Plihon and Volk2009; Cortet et al.
Reference Cortet, Chiffaudel, Daviaud and Dubrulle2010; Salort et al.
Reference Salort, Baudet, Castaing, Chabaud, Daviaud, Didelot, Diribarne, Dubrulle, Gagne, Gauthier, Girard, Hébral, Rousset, Thibault and Roche2010). It has also been used as forcing in simulations for the study of non-helical hydrodynamic turbulent flows (Mininni, Alexakis & Pouquet Reference Mininni, Alexakis and Pouquet2006) and rotating flows (Mininni et al.
Reference Mininni, Alexakis and Pouquet2009; Mininni & Pouquet Reference Mininni and Pouquet2009; Teitelbaum & Mininni Reference Teitelbaum and Mininni2009). Finally it has been studied for its magnetic dynamo properties due to its similarities with laboratory dynamo experiments (Ponty et al.
Reference Ponty, Mininni, Laval, Alexakis, Baerenzung, Daviaud, Dubrulle, Pinton, Politano and Pouquet2008).
This study investigates the properties of a TG forced flow, for a fixed forcing wavenumber
 $q$
, varying both the rotation rate and the Reynolds number, covering the two-dimensional parameter space.
2. Parameter space: phase diagram
The numerical part of this study consists of 184 direct numerical simulations (DNS) of the Navier–Stokes equation (1.1) varying the values of the control parameters
 $\mathit{Re}_{F}$
and
 $\mathit{Ro}_{F}$
. For all runs the forcing wavenumber was kept fixed to
 $q=2$
. All runs were performed using a standard pseudo-spectral code, where each component of
 $\boldsymbol{u}$
and
 $\boldsymbol{b}$
is represented as truncated Galerkin expansion in terms of the Fourier basis. The nonlinear terms are initially computed in physical space and then transformed to spectral space using fast-Fourier transforms. Aliasing errors are removed using the
 $2/3$
de-aliasing rule. The temporal integration was performed using a fourth-order Runge–Kutta method. Further details on the code can be found in Gómez, Mininni & Dmitruk (Reference Gómez, Mininni and Dmitruk2005). The grid size varied depending on the value of
 $\mathit{Re}_{F}$
and
 $\mathit{Ro}_{F}$
from
 $64^{3}$
to
 $512^{3}$
. A run was considered well resolved if the value of enstrophy spectrum at the cutoff wavenumber was more than an order of magnitude smaller than its value at its peak. Each run started from random multi-mode initial conditions and was continued for sufficiently long time so that long time averages in the steady state were obtained.
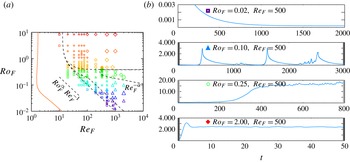
The location of all of the performed runs in the (
 $\mathit{Re}_{F},\mathit{Ro}_{F}$
) parameter space are shown in figure 1(a). The set of data with the largest value of
 $\mathit{Ro}_{F}$
are in reality non-rotating runs (
 $\mathit{Ro}_{F}=\infty$
) that have been shifted to the finite value
 $\mathit{Ro}_{F}=8$
so that they can appear in a logarithmic diagram. The different shades of grey (colours online) used are indicative of the magnitude of
 $\mathit{Ro}_{F}$
thus light colours (red online) imply slow rotation while dark colours (violet online) imply fast rotation. Large symbols imply larger value of
 $\mathit{Re}_{F}$
. The same symbols, sizes and shades (colours online) are used in all subsequent figures and thus the reader can always refer to figure 1 to estimate the value of
 $\mathit{Re}_{F}$
and
 $\mathit{Ro}_{F}$
. The different symbols indicate the four different behaviours that were observed in the numerical runs. Four representative cases of these behaviours are shown in figure 1(b). All cases have the same value of
 $\mathit{Re}_{F}$
but different values of
 $\mathit{Ro}_{F}$
. Note that the differences in values in the
 $y$
-axis indicate the different range of amplitude reached and the differences in values in
 $x$
-axis indicate the different timescales involved. The top subfigure displays the evolution of energy from a run that displayed laminar behaviour: after some transient period all energy is concentrated in the forcing scales and no fluctuations in the temporal behaviour are observed. This behaviour is observed in runs that occupy the lower and the left part of the shown parameter space and are indicated by squares. The second from the top subfigure displays a run for which the energy evolution displayed intermittent bursts. It consists of sudden bursts of energy followed by long relaxation periods reaching very small values of kinetic energy. In 1(a) they are marked by triangles. They are found for low values of
 $\mathit{Ro}_{F}$
and high
 $\mathit{Re}_{F}$
. Note that triangles and squares sometimes overlap indicating a bimodal behaviour of the flow. The third from the top subfigure shows the energy evolution from a run that formed quasi-2D condensates. The energy in these cases reaches very high values and it is concentrated in a few large-scale 2D modes (i.e.
 $k_{z}=0$
,
 $k_{x}\sim k_{y}\sim 1$
). They are represented in 1(a) by circles. They appear for intermediate values of
 $\mathit{Ro}_{F}$
and for large
 $\mathit{Re}_{F}$
. Finally the bottom subfigure in 1 displays the results from a weakly rotating flow. The behaviour of these flows as the name suggests weakly deviates from the non-rotating ones: energy saturates at order-one values and only weak anisotropy is observed. They are represented by diamonds in 1(a) and occupy the higher and right part of the parameter space.
(a) The parameter space (
 $\mathit{Ro}_{F},\mathit{Re}_{F}$
). Each point in this plane indicates a numerical simulation with this choice of parameters (
 $\mathit{Re}_{F},\mathit{Ro}_{F}$
). Different symbols indicate different behaviour: laminar flows are indicated by squares, intermittent bursts are indicated by triangles, quasi-2D condensates are indicated by circles, weakly rotating flows are indicated by diamonds. The different shades of grey (colours online) used are indicative of the magnitude of
 $\mathit{Ro}_{F}$
. Large symbols imply larger values of
 $\mathit{Re}_{F}$
. (b) Energy evolution for four representative cases.

The dashed lines in figure 1(a) separate the parameter space to the different phases that are observed. The parameter space is then split into five different regions: laminar, laminar and bursts, bursts, quasi-2D condensates and weakly rotating flow. For large values of
 $\mathit{Re}_{F}$
and
 $\mathit{Ro}_{F}$
these boundaries are expected to take the form of power laws. Indeed this assumption seems reasonable given the data. The scaling
 $\mathit{Ro}_{F}\propto \mathit{Re}_{F}^{-1}$
seems to determine the boundary that separates laminar region from the bursts and laminar bimodal behaviour. The region that exhibits quasi-2D condensates is bounded from below by a weak power law
 $\mathit{Ro}_{F}\propto \mathit{Re}_{F}^{-{\it\alpha}}$
. The value of
 ${\it\alpha}$
however cannot be determined by the present data. The difficulty in resolving both high
 $\mathit{Re}_{F}$
and high
 $\mathit{Ro}_{F}$
limits us only to a qualitative estimate of this lower boundary and prohibits us from measuring precisely
 ${\it\alpha}$
. We will attempt however to argue the origin of these power laws in the following sections using scaling arguments and asymptotic expansions. From above the quasi-2D condensates appear to be bounded by the value
 $\mathit{Ro}_{F}\simeq 0.4$
and appear only for
 $\mathit{Re}_{F}>240$
. For larger values of
 $\mathit{Ro}_{F}$
weakly rotating flows are observed.
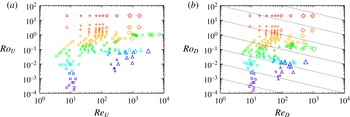
As mentioned in the previous section the definition of the Reynolds and Rossby number is more than just a conventional formality in rotating turbulence. In figure 2 we show the data in the parameter space
 $(\mathit{Re}_{U},\mathit{Ro}_{U})$
in 2(a) and in the parameter space
 $(\mathit{Re}_{D},\mathit{Ro}_{D})$
in 2(b). The dotted lines in 2(b) indicate constant values of the micro-Rossby number
 $\mathit{Ro}_{{\it\lambda}}=\mathit{Re}_{D}^{1/2}\mathit{Ro}_{D}$
. The presence of large-scale condensates and the suppression of turbulence by rotation drastically alters the range covered by the simulations for the different parameter choice. In the (
 $\mathit{Re}_{U}$
,
 $\mathit{Ro}_{U}$
) parameter space the data appear more scattered. In particular, the subcritical transition from laminar to intermittent bursts has lead to a region vacant of points around
 $\mathit{Ro}_{U}=10^{-2},\mathit{Re}_{U}=100$
and
 $\mathit{Ro}_{D}=10^{-2},\mathit{Re}_{D}=30$
. The quasi-2D condensates have also lead to extremely large values of
 $\mathit{Re}_{U}$
to be reached. On the other hand, in the (
 $\mathit{Re}_{D}$
,
 $\mathit{Ro}_{D}$
), the data seem to be much more concentrated and bounded on the right by
 $\mathit{Re}_{D}\simeq 1000$
. This only reflects the maximum grid size used
 $N=512^{3}$
. It is also worth noting that all of the quasi-2D condensates runs have a micro-Rossby number larger than unity (indicated by the fact that all points lie above the
 $\mathit{Ro}_{{\it\lambda}}=1$
line). Thus,
 $\mathit{Re}_{D},\mathit{Ro}_{D}$
provide the most informative indexes and the best measures for the range of scales excited and therefore on how turbulent the flow is. In the following sections however the data will be presented based on the parameters (
 $\mathit{Re}_{F}$
,
 $\mathit{Ro}_{F}$
) since these are the ones that are controlled in the numerical experiments.
The parameter space (
 $\mathit{Ro}_{U},\mathit{Re}_{U}$
) (a) and (
 $\mathit{Ro}_{D},\mathit{Re}_{D}$
) (b). Each point in this plane indicates a numerical simulation that resulted in that value of
 $(\mathit{Ro}_{U},\mathit{Re}_{U})$
and (
 $\mathit{Ro}_{D},\mathit{Re}_{D}$
). Same symbols are used for the same runs as in figure 1. The dotted lines in (b) indicate constant values of the micro-Rossby number
 $\mathit{Ro}_{{\it\lambda}}=\mathit{Re}_{D}^{1/2}\mathit{Ro}_{D}$
, with the
 $\mathit{Ro}_{{\it\lambda}}=1$
case marked by a thicker line.

3. Stationary solutions in the
 $\mathit{Ro}_{F}\rightarrow 0$
limit

The complex phase space observed can be disentangled by looking at the fast rotating limit in which the smallness of
 $\mathit{Ro}_{F}$
can be used to find asymptotic solutions. First stationary solutions are considered. For
 $\mathit{Ro}_{F}\ll 1$
the first-order term in (1.1) is linear and a solution can be obtained in terms of an expansion series treating the nonlinearity in a perturbative manner. We thus write
 $\boldsymbol{u}=\mathit{Ro}_{F}\boldsymbol{v}$
and expand
 $\boldsymbol{v}$
as
 $$\begin{eqnarray}\boldsymbol{v}=\boldsymbol{v}^{(0)}+\mathit{Ro}_{F}^{2}\boldsymbol{v}^{(1)}+\mathit{Ro}_{F}^{4}\,\,\boldsymbol{v}^{(2)}+\cdots .\end{eqnarray}$$
(The upper indexes in parentheses indicate the order of the expansion and not powers.) Expanding in powers of
 $\mathit{Ro}_{F}^{2}$
might seem unexpected but as we show later the relation
 $\mathit{Ro}_{U}\propto \mathit{Ro}_{F}^{2}$
holds for the laminar solutions and thus our expansion is in powers of
 $\mathit{Ro}_{U}$
. As a first step we look for stationary solutions to the problem and thus assume no time dependence. It is further assumed that the following scaling for the Reynolds number
 $\mathit{Re}_{F}^{-1}={\it\lambda}_{n}\mathit{Ro}_{F}^{2n-1}$
holds where now
 ${\it\lambda}_{n}$
is an order-one number and
 $n$
an integer to be specified. It determines the order at which the viscous term will appear in the expansion and thus it will be referred to as the ordering index. After substitution (1.1) becomes
 $$\begin{eqnarray}\mathbb{L}\left[\boldsymbol{v}\right]=\boldsymbol{f}+\mathit{Ro}_{F}^{2}\mathbb{P}\left[\boldsymbol{v}\times \boldsymbol{w}\right]+{\it\lambda}_{n}\mathit{Ro}_{F}^{2n}{\rm\Delta}\boldsymbol{u}\end{eqnarray}$$
where now
 $\boldsymbol{w}=\boldsymbol{{\rm\nabla}}\times \boldsymbol{v}$
. The linear operator
 $\mathbb{L}$
on the left-hand side expresses the effect of rotation and is defined as
 $$\begin{eqnarray}\mathbb{L}\left[\boldsymbol{v}\right]\equiv \mathbb{P}\left[\boldsymbol{e}_{\boldsymbol{z}}\times \boldsymbol{v}\right]\!.\end{eqnarray}$$
In the triple-periodic domain
 $\mathbb{L}$
can be written as
 $$\begin{eqnarray}\mathbb{L}[\,\boldsymbol{f}]={\it\Delta}^{-1}\partial _{z}\boldsymbol{{\rm\nabla}}\times \boldsymbol{f}.\end{eqnarray}$$
Its kernel is composed of all solenoidal vector fields
 $\boldsymbol{g}$
such that
 $\partial _{z}\boldsymbol{g}=0$
. These vector fields are going to be referred to as two-dimensional–three-component (2D3C) fields as they depend only on two coordinates but involve all three components. The projection to the 2D3C fields is just the vertical average that is denoted as
 $$\begin{eqnarray}\overline{\boldsymbol{g}}\equiv \frac{1}{2{\rm\pi}}\int _{0}^{2{\rm\pi}}\boldsymbol{g}\text{d}z.\end{eqnarray}$$
For any
 $\boldsymbol{f}$
that has zero projection in this set (i.e.
 $\overline{\boldsymbol{f}}=0$
) the general solution to the equation
 $\mathbb{L}\boldsymbol{g}=\boldsymbol{f}$
is
 $$\begin{eqnarray}\boldsymbol{g}=\mathbb{L}^{-1}\boldsymbol{f}+\boldsymbol{g}_{2D}=-\partial _{z}^{-1}\boldsymbol{{\rm\nabla}}\times \boldsymbol{f}+\boldsymbol{g}_{2D}\end{eqnarray}$$
where
 $\boldsymbol{g}_{2D}$
is an arbitrary (2D3C) field. If however
 $\overline{\boldsymbol{f}}\neq 0$
no solution exists.
Equation (3.2) can be treated perturbatively and a stationary
 $\boldsymbol{v}$
can in principle be found as a series expansion in
 $\mathit{Ro}_{F}^{2}$
. Since the TG flow is not a solution of the Euler equations at each order new wavenumbers will be excited. This procedure will terminate by viscosity that will introduce an exponential cutoff. It is not a surprise then that the ordering parameter
 $n$
that controls the relation between
 $\mathit{Re}_{F}$
and
 $\mathit{Ro}_{F}$
also controls the convergence of the expansion. Thus, the investigation begins by examining different possible values of the ordering parameter
 $n$
.
3.1.
$n=0$
,
$\mathit{Re}_{F}^{-1}={\it\lambda}_{0}\mathit{Ro}_{F}^{-1}$


For
 $n=0$
the viscous term is of the same order as the rotation term and the operator that needs to be inverted to obtain the first-order term in
 $\boldsymbol{v}$
is
 $(\mathbb{L}-{\it\lambda}_{0}{\it\Delta})$
. This operator is positive definite and can always be inverted to obtain the zeroth-order solution. In detail for the TG forcing (1.5) it is obtained that
 $$\begin{eqnarray}\boldsymbol{v}^{(0)}=\frac{2}{1+27{\it\lambda}_{0}^{2}q^{4}}\left\{\begin{array}{@{}l@{}}\boldsymbol{e}_{\boldsymbol{x}}(-\!\cos (qx)\sin (qy)\sin (qz)+9{\it\lambda}_{0}q^{2}\sin (qx)\cos (qy)\sin (qz))\quad \\ \boldsymbol{e}_{\boldsymbol{y}}(-\!\sin (qx)\cos (qy)\sin (qz)-9{\it\lambda}_{0}q^{2}\cos (qx)\sin (qy)\sin (qz))\quad \\ \boldsymbol{e}_{\boldsymbol{z}}(2\,\sin (qx)\sin (qy)\cos (qz)).\quad \end{array}\right.\end{eqnarray}$$
The next order correction follows in a similar manner without a qualitative change the of the flow behaviour. We note that the stationary solution in this limit follows the scaling
 $\langle \boldsymbol{u}\boldsymbol{\cdot }\boldsymbol{u}\rangle _{V}=\mathit{Ro}_{F}^{2}\langle \boldsymbol{v}\boldsymbol{\cdot }\boldsymbol{v}\rangle _{V}=3\mathit{Ro}_{F}^{2}(1+27{\it\lambda}_{0}^{2}q^{4})^{-1}$
. That implies that the relation between
 $(\mathit{Re}_{U},\mathit{Ro}_{U})$
and
 $(\mathit{Re}_{F},\mathit{Ro}_{F})$
for the laminar flow is given by
 $$\begin{eqnarray}\mathit{Re}_{U}=\frac{\sqrt{3}\,\mathit{Re}_{F}^{2}\mathit{Ro}_{F}}{\sqrt{\mathit{Re }_{F}^{2}+27\mathit{Ro }_{F}^{2}q^{4}}},\quad \mathit{Ro}_{U}=\frac{\sqrt{3}\,\mathit{Ro}_{F}^{2}\mathit{Re}_{F}}{\sqrt{\mathit{Re }_{F}^{2}+27\mathit{Ro }_{F}^{2}q^{4}}}.\end{eqnarray}$$
Furthermore,
 $\langle \boldsymbol{u}\boldsymbol{\cdot }\boldsymbol{f}\rangle =9q^{2}\mathit{Ro}_{F}{\it\lambda}_{0}(1+27{\it\lambda}_{0}^{2}q^{4})^{-1}$
and thus
 $$\begin{eqnarray}\mathit{Re}_{D}=\frac{3^{2/3}\,\mathit{Re}_{F}^{4/3}\mathit{Ro}_{F}^{1/3}}{(\mathit{Re}_{F}^{2}+27\mathit{Ro}_{F}^{2}q^{4})^{1/3}},\quad \mathit{Ro}_{D}=\frac{3^{2/3}\,\mathit{Ro}_{F}^{4/3}\mathit{Re}_{F}^{1/3}}{(\mathit{Re}_{F}^{2}+27\mathit{Ro}_{F}^{2}q^{4})^{1/3}}.\end{eqnarray}$$
These results (3.8), (3.9) provide the map from the
 $(\mathit{Re}_{U},\mathit{Ro}_{U})$
space (figure 1
a) to the
 $(\mathit{Re}_{U},\mathit{Ro}_{U})$
and
 $(\mathit{Re}_{D},\mathit{Ro}_{D})$
space shown in figure 2 but only for the laminar solutions.
3.2.
$n=1$
,
$\mathit{Re}_{F}^{-1}={\it\lambda}_{1}\mathit{Ro}_{F}^{1}$


For this value of the ordering index, equation (3.2) becomes
 $$\begin{eqnarray}\mathbb{L}\left[\boldsymbol{v}\right]=\boldsymbol{f}+\mathit{Ro}_{F}^{2}\,(\mathbb{P}\left[\boldsymbol{v}\times \boldsymbol{w}\right]+{\it\lambda}_{1}{\rm\Delta}\boldsymbol{u}).\end{eqnarray}$$
Since
 $\overline{\boldsymbol{f}}=0$
the zeroth-order solution can be written as
 $\boldsymbol{v}^{(0)}=\boldsymbol{v}_{\boldsymbol{f}}^{(0)}+\boldsymbol{v}_{2D}^{(0)}$
where
 $$\begin{eqnarray}\boldsymbol{v}_{\boldsymbol{f}}^{(0)}=\mathbb{L}^{-1}\boldsymbol{f}=2\left\{\begin{array}{@{}ll@{}}-\quad & \boldsymbol{e}_{\boldsymbol{x}}\cos (qx)\sin (qy)\sin (qz)\\ -\quad & \boldsymbol{e}_{\boldsymbol{y}}\sin (qx)\cos (qy)\sin (qz)\\ 2\quad & \boldsymbol{e}_{\boldsymbol{z}}\sin (qx)\sin (qy)\cos (qz),\end{array}\right.\end{eqnarray}$$
and
 $\boldsymbol{v}_{2D}^{(0)}$
is an arbitrary 2D3C field. The velocity field in (3.11) is the same as the one in (3.7) with
 ${\it\lambda}_{0}=0$
. The 2D3C field is determined at next order for which we have
 $$\begin{eqnarray}\mathbb{L}[\boldsymbol{v}^{(1)}]=\mathbb{P}\left[\boldsymbol{v}^{(0)}\times \boldsymbol{w}^{(0)}\right]+{\it\lambda}_{1}{\rm\Delta}\boldsymbol{v}^{(0)}.\end{eqnarray}$$
Averaging over the
 $z$
direction we obtain by detailed calculation that
 $$\begin{eqnarray}\overline{\mathbb{P}\left[\boldsymbol{v}_{\boldsymbol{f}}^{(0)}\times \boldsymbol{w}_{2D}^{(0)}\right]}=\overline{\mathbb{P}\left[\boldsymbol{v}_{2D}^{(0)}\times \boldsymbol{w}_{\boldsymbol{f}}^{(0)}\right]}=\overline{\mathbb{P}\left[\boldsymbol{v}_{\boldsymbol{f}}^{(0)}\times \boldsymbol{w}_{\boldsymbol{f}}^{(0)}\right]}=0\end{eqnarray}$$
where
 $\boldsymbol{w}_{2D}^{(0)}=\boldsymbol{{\rm\nabla}}\times \boldsymbol{v}_{2D}^{(0)}$
and
 $\boldsymbol{w}_{\boldsymbol{f}}^{(0)}=\boldsymbol{{\rm\nabla}}\times \boldsymbol{v}_{\boldsymbol{f}}^{(0)}$
. We are thus left with
 $$\begin{eqnarray}0=\mathbb{P}\left[\boldsymbol{v}_{2D}^{(0)}\times \boldsymbol{w}_{2D}^{(0)}\right]+{\it\lambda}_{1}{\rm\Delta}\boldsymbol{v}_{2D}^{(0)}.\end{eqnarray}$$
Multiplying by
 $\boldsymbol{v}_{2D}^{(0)}$
and horizontal averaging we get
 $\langle (\boldsymbol{{\rm\nabla}}\boldsymbol{v}_{2D}^{(0)})^{2}\rangle _{V}=0$
and thus the undetermined 2D3C field at first order becomes
 $\boldsymbol{v}_{2D}^{(0)}=0$
. A 2D3C flow can possibly appear at higher order but we will proceed no further than obtaining
 $\boldsymbol{v}^{(0)}$
.
The relations given in (3.8) simplify (by setting
 ${\it\lambda}_{0}=0$
) to
 $$\begin{eqnarray}\mathit{Re}_{U}=\sqrt{3}\,\mathit{Re}_{F}\mathit{Ro}_{F}\quad \text{and}\quad \mathit{Ro}_{U}=\sqrt{3}\,\mathit{Ro}_{F}^{2}\end{eqnarray}$$
for the Reynolds numbers based on the root-mean-square velocity. Similarly (3.9) simplify to
 $\mathit{Re}_{D}=3^{2/3}\,\mathit{Re}_{F}^{1/3}\mathit{Ro}_{F}^{2/3}$
and
 $\mathit{Ro}_{D}=3^{2/3}\,\mathit{Re}_{F}^{-1/3}\mathit{Ro}_{F}^{4/3}$
for the Reynolds numbers based on the energy injection rate.
3.3.
$n=2$
,
$\mathit{Re}_{F}^{-1}={\it\lambda}_{2}\mathit{Ro}_{F}^{3}$


For this ordering index the expansion follows as before but viscosity is not present at first order and the solvability condition obtained in (3.12) only restricts
 $\boldsymbol{v}_{2D}$
at being a solution of the Euler equations
 $\mathbb{P}[\boldsymbol{v}_{2D}^{(0)}\times \boldsymbol{w}_{2D}^{(0)}]=0$
. The first-order correction is then
 $$\begin{eqnarray}\boldsymbol{v}^{(1)}=\mathbb{L}^{-1}[\boldsymbol{v}^{(0)}\times \boldsymbol{w}^{(0)}]+\boldsymbol{v}_{2D}^{(1)}.\end{eqnarray}$$
To proceed at second order and simplify the mathematical complexity that increases rapidly with the order of the expansion we will assume at this point that
 $\boldsymbol{v}_{2D}=0$
and verify a posteriori the validity of this assumption. To the next order we obtain
 $$\begin{eqnarray}\mathbb{L}[\boldsymbol{v}^{(2)}]=\mathbb{P}\left[\boldsymbol{v}^{(1)}\times \boldsymbol{w}^{(0)}+\boldsymbol{v}^{(0)}\times \boldsymbol{w}^{(1)}\right]+{\it\lambda}_{2}{\rm\Delta}\boldsymbol{v}^{(0)}.\end{eqnarray}$$
Averaging over
 $z$
the nonlinear term drops to zero. This can be realized by noting that the zeroth-order components (
 $\boldsymbol{v}^{(0)},\boldsymbol{w}^{(0)}$
) only contain wavenumbers
 $\pm q$
in the
 $z$
direction while the first-order component (
 $\boldsymbol{v}^{(1)},\boldsymbol{w}^{(1)}$
) has only
 $\pm 2q$
wavenumbers. Their product will thus have only
 $\pm q$
and
 $\pm 3q$
wavenumbers and will thus average to zero. We obtain thus
 $\overline{{\rm\nabla}^{2}\boldsymbol{v}^{(0)}}=0$
in agreement with our original assumption that
 $\boldsymbol{v}_{2D}=0$
. Up to this scaling therefore the stationary solution obtained has zero projection to the 2D3C fields.
3.4.
$n=3$
,
$\mathit{Re}_{F}^{-1}={\it\lambda}_{3}\mathit{Ro}_{F}^{5}$


The assumption that
 $\boldsymbol{v}_{2D}=0$
ceases to be true for this ordering. If we assume that
 $\boldsymbol{v}_{2D}^{0}=0$
, then at third order where the dissipation term is present we will obtain
 $$\begin{eqnarray}\mathbb{L}[\boldsymbol{v}^{(3)}]=\mathbb{P}\left[\boldsymbol{v}^{(2)}\times \boldsymbol{w}^{(0)}+\boldsymbol{v}^{(0)}\times \boldsymbol{w}^{(2)}+\boldsymbol{v}^{(1)}\times \boldsymbol{w}^{(1)}\right]+{\it\lambda}_{3}{\rm\Delta}\boldsymbol{v}^{(0)}\end{eqnarray}$$
where
 $\boldsymbol{v}^{(0)}$
,
 $\boldsymbol{v}^{(1)}$
and
 $\boldsymbol{v}^{(2)}$
are obtained from (3.11), (3.16) and (3.17), respectively, with
 ${\it\lambda}_{2}=0$
. Averaging over
 $z$
the nonlinear term will not become zero and thus will need to be balanced by the viscosity:
 $$\begin{eqnarray}{\it\lambda}_{3}{\rm\nabla}^{2}\boldsymbol{v}_{2D}={\it\lambda}_{3}{\rm\nabla}^{2}\overline{\boldsymbol{v}^{(0)}}=-\overline{\mathbb{P}\left[\boldsymbol{v}^{(2)}\times \boldsymbol{w}^{(0)}+\boldsymbol{v}^{(0)}\times \boldsymbol{w}^{(2)}+\boldsymbol{v}^{(1)}\times \boldsymbol{w}^{(1)}\right]}\neq 0.\end{eqnarray}$$
Thus,
 $\boldsymbol{v}_{2D}=0$
is no longer an acceptable solution. Calculation of the nonlinear term (3.19) leads to
 $$\begin{eqnarray}\overline{\mathbb{P}\left[\boldsymbol{v}^{(2)}\times \boldsymbol{w}^{(0)}+\boldsymbol{v}^{(0)}\times \boldsymbol{w}^{(2)}+\boldsymbol{v}^{(1)}\times \boldsymbol{w}^{(1)}\right]}=\left\{\begin{array}{@{}c@{}}\partial _{y}{\it\Psi}\\ -\partial _{x}{\it\Psi}\\ 0\end{array}\right\}\end{eqnarray}$$
with
 $$\begin{eqnarray}{\it\Psi}=\frac{9q}{2}[\cos (2qx)-\cos (2qy)]\sin (2qx)\sin (2qy).\end{eqnarray}$$
Thus, even if the initial data have a zero projection to the 2D3C fields the nonlinearity at third order will force a 2D3C component to grow to zeroth-order amplitude.
3.5.
$n>4$
,
$O(\mathit{Re}_{F}^{-1})<O(\mathit{Ro}_{F}^{5})$


At higher values of
 $n$
the nonlinearity at the fourth-order term has non-zero projection to the 2D3C fields and viscosity is not present to provide a balance. Thus, no solution can be obtained by the expansion. Physically this would imply that even if initial conditions were prepared carefully to avoid any instabilities the 2D3C component of the flow would grow with time to values where the original scaling
 $\boldsymbol{u}=\mathit{Ro}_{F}\boldsymbol{v}\ll 1$
would not be valid and the expansion would fail. This also indicates that the quasi-2D condensates that were shown in figure 1 will show up at this order. This gives a lower bound on the unknown exponent
 ${\it\alpha}\geqslant 1/5$
since at this order there is direct injection of energy in the 2D3C flow.
4. Time evolution and stability in the
$\mathit{Ro}_{F}\rightarrow 0$
limit

The results in the previous section only imply the presence of stationary solutions. Their realizability however is not guaranteed since it can be unstable to infinitesimal or finite-amplitude perturbations that can lead the system to different time-dependent solutions. It is thus also important to investigate the stability of the calculated solutions. To follow the evolution of the flow we need to keep the time derivative term in (1.1). Since in rapidly rotating systems two distinct timescales exist, one given by the rotation rate and one by the nonlinearity, we introduce
 ${\it\tau}=\mathit{Ro}_{F}t$
as the slow eddy turnover time and
 $t^{\prime }=\mathit{Ro}_{F}^{-1}t$
as the fast timescale. Equation (1.1) then becomes
 $$\begin{eqnarray}\partial _{t^{\prime }}\boldsymbol{v}+\mathbb{L}\left[\boldsymbol{v}\right]=\boldsymbol{f}+\mathit{Ro}_{F}^{2}\,\,\mathbb{P}\left[-\partial _{{\it\tau}}\boldsymbol{v}+\boldsymbol{v}\times \boldsymbol{w}\right]+{\it\lambda}_{n}\mathit{Ro}_{F}^{2n}{\rm\Delta}\boldsymbol{v}.\end{eqnarray}$$
In principle, this expansion remains valid only on the timescale
 ${\it\tau}$
and could fail at longer timescales (Babin, Mahalov & Nicolaenko Reference Babin, Mahalov and Nicolaenko1969; Newell Reference Newell1969; Chen et al.
Reference Chen, Chen, Eyink and Holm2005). In practical terms however such expansions are expected to capture the long time dynamics (e.g. saturation amplitude, dissipation rates etc.) if slower timescale processes in the system do not become important. If such a third timescale exists, the expansion should be carried out at the next order and a new timescale to be defined.
In addition to the stationary solution that was found in the previous section, the time dependence allows for the existence of travelling inertial waves that propagate on the fast timescale
 $t^{\prime }$
and vary in amplitude on the slow dynamical timescale
 ${\it\tau}$
. The presence of the inertial waves (since they are not directly forced) depends on their stability properties. Similar the 2D3C flows that are absent in the stationary solution for
 $\mathit{Re}_{F}\leqslant O(\mathit{Ro}_{F}^{-3})$
can still be present as time-dependent solutions evolving on a slow timescale
 ${\it\tau}$
if an instability is present.
4.1. Energy stability
The energy stability method provides a sufficient criterion for stability of a stationary flow subject to perturbations of arbitrary amplitude. It is based on the energy evolution equation of the perturbation. Denoting the stationary solution as
 $\boldsymbol{u}_{f}$
and without taking any asymptotic limit yet we can write the velocity field
 $\boldsymbol{u}$
as the sum of the stationary solution
 $\boldsymbol{u}_{f}$
and a fluctuating part
 $\boldsymbol{u}_{p}$
. Multiplying (1.1) by the fluctuating part
 $\boldsymbol{u}_{p}$
and space averaging leads to the equation
 $$\begin{eqnarray}\frac{\text{d}}{\text{d}t}\left\langle \frac{1}{2}|\boldsymbol{u}_{p}|^{2}\right\rangle _{V}=\left\langle \boldsymbol{u}_{p}\boldsymbol{\cdot }\left(\boldsymbol{{\rm\nabla}}\boldsymbol{u}_{f}\right)\boldsymbol{u}_{p}\right\rangle _{V}-\mathit{Re}_{F}^{-1}\left\langle |\boldsymbol{{\rm\nabla}}\boldsymbol{u}_{p}|^{2}\right\rangle _{V}.\end{eqnarray}$$
The stationary solution is then called energy stable if the right-hand side is negative definite for all incompressible fields
 $\boldsymbol{u}_{p}$
. Note that the Coriolis term is absent in (4.2) and the same equation is obtained if
 $\mathit{Ro}_{F}=\infty$
. However, there is dependence on
 $\mathit{Ro}_{F}$
through the functional form of
 $\boldsymbol{u}_{f}$
. Stability of the stationary solution is then guaranteed if
 $$\begin{eqnarray}{\it\mu}(\mathit{Re}_{F},\mathit{Ro}_{F})=\sup _{\boldsymbol{u}_{p}}\frac{\left\langle \boldsymbol{u}_{p}\boldsymbol{\cdot }\left(\boldsymbol{{\rm\nabla}}\boldsymbol{u}_{f}\right)\boldsymbol{u}_{p}\right\rangle _{V}-\mathit{Re}_{F}^{-1}\left\langle |\boldsymbol{{\rm\nabla}}\boldsymbol{u}_{p}|^{2}\right\rangle _{V}}{\left\langle |\boldsymbol{u}_{p}|^{2}\right\rangle _{V}}\leqslant 0\end{eqnarray}$$
in which case the energy of the perturbation
 $\boldsymbol{u}_{p}$
is bounded by
 $$\begin{eqnarray}{\textstyle \frac{1}{2}}\langle |\boldsymbol{u}_{p}(t)|^{2}\rangle _{V}\leqslant {\textstyle \frac{1}{2}}\langle |\boldsymbol{u}_{p}(0)|^{2}\rangle _{V}\text{e}^{2{\it\mu}t}\end{eqnarray}$$
by Gronwall’s inequality. (Detailed derivations of the inequalities used in this section can be found in Doering & Gibbon (Reference Doering and Gibbon1995).) The energy stability analysis then reduces to solving the involved Euler–Lagrange equations and determining
 ${\it\mu}(\mathit{Re}_{F},\mathit{Ro}_{F})$
. The energy stability boundary is then determined by the
 ${\it\mu}(\mathit{Re}_{F},\mathit{Ro}_{F})=0$
curve in the parameter space. Here it is not attempted to solve the Euler–Lagrange equations that are beyond the point of this work but estimates are given based on simple inequalities and the previous approximations of steady-state flow.
We begin by noting that Poincaré’s inequality indicates that
 $\langle |\boldsymbol{{\rm\nabla}}\boldsymbol{u}_{p}|^{2}\rangle _{V}\geqslant \langle |\boldsymbol{u}_{p}|^{2}\rangle _{V}$
(where the fact that the flow is defined in a periodic box of non-dimensional size
 $2{\rm\pi}$
has been used). Hölder’s inequality also indicates that
 $$\begin{eqnarray}\left\langle \boldsymbol{u}_{p}\boldsymbol{\cdot }\left(\boldsymbol{{\rm\nabla}}\boldsymbol{u}_{f}\right)\boldsymbol{u}_{p}\right\rangle _{V}\leqslant \Vert \boldsymbol{{\rm\nabla}}\boldsymbol{u}_{f}\Vert _{\infty }\langle |\boldsymbol{u}_{p}|^{2}\rangle _{V}\end{eqnarray}$$
where by
 $\Vert \boldsymbol{{\rm\nabla}}\boldsymbol{u}_{f}\Vert _{\infty }$
we indicate the maximum of the modulus of the strain tensor
 $\boldsymbol{{\rm\nabla}}\boldsymbol{u}_{f}$
over space. These estimates together with the condition (4.3) indicate that stability of the flow
 $\boldsymbol{u}_{f}$
is guaranteed if
 $\Vert \boldsymbol{{\rm\nabla}}\boldsymbol{u}_{f}\Vert _{\infty }\leqslant \mathit{Re}_{F}^{-1}$
.
This criterion for stability can be calculated using the asymptotic solution we obtained in the previous section. The expression (3.7) gives
 $\boldsymbol{u}_{f}$
up to an order
 $\mathit{Ro}_{F}^{-2}$
correction. For
 ${\it\lambda}_{0}=0$
(3.7) reduces to the same zeroth-order solution as in the
 $n=1$
and
 $n=2$
case (see (3.11)), thus this choice is valid for all cases for which
 $\mathit{Re}_{F}^{-1}\leqslant O(\mathit{Ro}_{F}^{3})$
. For higher ordering the zeroth-order 2D3C field
 $\mathit{Ro}_{F}^{-1}\boldsymbol{v}_{2D}$
should also be included. Substituting thus (3.7) it is obtained
 $$\begin{eqnarray}\Vert \boldsymbol{{\rm\nabla}}\boldsymbol{u}_{f}\Vert _{\infty }=\mathit{Ro}_{F}q\frac{4+18{\it\lambda}_{0}q^{2}}{1+27{\it\lambda}_{0}^{2}q^{4}}+O(\mathit{Ro}_{F}^{3}).\end{eqnarray}$$
Substituting in
 $\Vert \boldsymbol{{\rm\nabla}}\boldsymbol{u}_{f}\Vert _{\infty }\leqslant \mathit{Re}_{F}^{-1}$
and using
 ${\it\lambda}_{0}=\mathit{Ro}_{F}/\mathit{Re}_{F}$
the stability of the flow calculated for the approximate solution (3.7) is guaranteed if
 $$\begin{eqnarray}\mathit{Ro}_{F}^{-2}-4q\mathit{Re}_{F}\mathit{Ro}_{F}^{-1}-(18q^{3}-27q^{4}\mathit{Re}_{F}^{-2})\geqslant 0.\end{eqnarray}$$
This leads to the following estimates that guarantee stability. The flow is stable if
 $$\begin{eqnarray}\left.\begin{array}{@{}l@{}}\mathit{Ro}_{F}^{-1}\geqslant 2q\mathit{Re}_{F}+q\sqrt{4\mathit{Re }_{F}^{2}+18q-27q^{2}\mathit{ Re }_{F}^{-2}}\quad \text{or}\\ \mathit{Ro}_{F}^{-1}\leqslant 2q\mathit{Re}_{F}-q\sqrt{4\mathit{Re }_{F}^{2}+18q-27q^{2}\mathit{ Re }_{F}^{-2}}\end{array}\right\}\end{eqnarray}$$
and for any value of
 $\mathit{Ro}_{F}$
stability is guaranteed if
 $$\begin{eqnarray}\mathit{Re}_{F}\leqslant \frac{\sqrt{q}}{2}\sqrt{(\sqrt{189}-9)}\simeq 1.08\dots \,\sqrt{q}.\end{eqnarray}$$
These conservatives estimates of the energy stability boundaries are shown in figure 1 with a solid grey (orange online) line. For
 $\mathit{Ro}_{F}\gg 1$
the estimate for stability is given by
 $\mathit{Re}_{F}\leqslant \sqrt{3q/2}$
while the numerical simulations indicate a critical value for
 $\mathit{Re}_{F}=14.0$
which is considerable larger than the value obtained in (4.9). For
 $\mathit{Ro}_{F}\ll 1$
(4.8) leads to the condition for stability
 $\mathit{Re}_{F}\leqslant (4q\mathit{Ro}_{F})^{-1}$
while from the numerical simulations stability is shown in the same limit for
 $q=2$
if
 $\mathit{Re}_{F}\lesssim 10\mathit{Ro}_{F}^{-1}$
. The analytical estimates for the stability boundaries (4.8) and (4.9) are thus very conservative which is expected for the rough estimates used here. These estimates however do not aim at obtaining the exact values but rather to give an understanding of the shape of the stability boundary that they clearly capture. They also prove that for any value of
 $\mathit{Re}_{F}$
, no mater how large, at sufficiently large
 $\mathit{Ro}_{F}$
the flow will re-laminarize.
4.2. Linear stability
The absence of energy stability does not necessarily imply instability. This is determined by linear stability theory that investigates the evolution of infinitesimal perturbations and is examined in this section. In contrast to energy stability, linear stability does not guarantee stability since a linearly stable system can still be unstable to finite-amplitude perturbations. However, absence of linear stability always guarantees instability. The two methods are thus complementary. For
 $\mathit{Ro}_{F}\rightarrow 0$
the energy stability indicates that stability is determined at
 $\mathit{Re}_{F}=O(\mathit{Ro}_{F}^{-1})$
. We thus begin the investigation of linear stability for this ordering. The linear equation for an infinitesimal fluctuation
 $\boldsymbol{v}_{p}$
on the basic stationary state
 $\boldsymbol{v}_{f}$
(given at this order by (3.11)) reads
 $$\begin{eqnarray}\partial _{t^{\prime }}\boldsymbol{v}_{p}+\mathbb{L}\left[\boldsymbol{v}_{p}\right]=\mathit{Ro}_{F}^{2}\left(\mathbb{P}\left[-\partial _{{\it\tau}}\boldsymbol{v}_{p}+\boldsymbol{v}_{p}\times \boldsymbol{w}_{f}+\boldsymbol{v}_{f}\times \boldsymbol{w}_{p}\right]+{\it\lambda}_{1}{\rm\Delta}\boldsymbol{v}_{p}\right)\!.\end{eqnarray}$$
Unlike in the energy stability method, in linear stability the effect of rotation is not removed and the smallness of
 $\mathit{Ro}_{F}$
can be used to find the growth rate of the perturbations in an asymptotic way. Like before we write
 $\boldsymbol{v}_{p}=\boldsymbol{v}_{p}^{(0)}+\mathit{Ro}_{F}^{2}\boldsymbol{v}_{p}^{(1)}+\cdots$
. At zeroth order we obtain
 $$\begin{eqnarray}\partial _{t^{\prime }}\boldsymbol{v}_{p}^{(0)}+\mathbb{L}[\boldsymbol{v}_{p}^{(0)}]=0.\end{eqnarray}$$
The general solution of (4.11) is then given by
 $$\begin{eqnarray}\boldsymbol{v}_{p}^{(0)}=\boldsymbol{v}_{2D}^{(0)}({\it\tau},x,y)+\boldsymbol{v}_{w}^{(0)}({\it\tau},t^{\prime },x,y,z)\end{eqnarray}$$
where
 $\boldsymbol{v}_{2D}$
is a 2D3C velocity field that depends only on the (
 $x,y$
) coordinates and on the slow dynamical time
 ${\it\tau}$
. Here
 $\boldsymbol{v}_{w}^{(0)}$
are inertial waves whose amplitudes also vary on the long timescale. The general expression for the inertial waves in triple periodic boxes is given by
 $$\begin{eqnarray}\boldsymbol{v}_{w}^{(0)}=\mathop{\sum }_{s,\boldsymbol{k},k_{z}>0}\left[H_{\boldsymbol{k}}^{s}({\it\tau})\boldsymbol{h}_{\boldsymbol{ k}}^{s}\text{e}^{(\text{i}\boldsymbol{k}\boldsymbol{x}+\text{i}{\it\omega}_{\boldsymbol{k}}^{s}t^{\prime })}+\text{c.c.}\right]\end{eqnarray}$$
where
 $s=\pm 1$
,
 $\text{c.c.}$
stands for complex conjugate and represents the wavenumbers with negative
 $k_{z}$
. Here
 $\boldsymbol{h}_{\boldsymbol{k}}^{s}$
are the helical basis in Fourier space described by Cambon & Jacquin (Reference Cambon and Jacquin1989) and Waleffe (Reference Waleffe1992, Reference Waleffe1993) and
 $\boldsymbol{h}_{\boldsymbol{k}}^{s}$
are eigenfunctions of the curl operator with
 $\text{i}\boldsymbol{k}\times \boldsymbol{h}_{\boldsymbol{k}}^{s}=s|\boldsymbol{k}|\boldsymbol{h}_{\boldsymbol{k}}^{s}$
and thus the index
 $s$
determines the sign of the helicity of the mode. According to (3.4) then
 $$\begin{eqnarray}\mathbb{L}[\boldsymbol{h}_{\boldsymbol{k}}^{\boldsymbol{s}}\text{e}^{\text{i}\boldsymbol{k}\boldsymbol{x}}]=-\text{i}{\it\omega}_{\boldsymbol{ k}}^{s}\boldsymbol{h}_{\boldsymbol{ k}}^{\boldsymbol{s}}\text{e}^{\text{i}\boldsymbol{k}\boldsymbol{x}}\quad \text{with}~{\it\omega}_{\boldsymbol{ k}}^{s}=s\frac{k_{z}}{|\boldsymbol{k}|}.\end{eqnarray}$$
On the periodic box used here for any wavevector
 $\boldsymbol{k}=[k_{x},k_{y},k_{z}]$
with
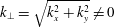 $k_{\bot }=\sqrt{k_{x}^{2}+k_{y}^{2}}\neq 0$
,
 $\boldsymbol{h}_{\boldsymbol{k}}^{s}$
is defined as
 $$\begin{eqnarray}h_{\boldsymbol{k}}^{s}=\frac{1}{\sqrt{2}\,|k|k_{\bot }}\left[\begin{array}{@{}c@{}}k_{x}k_{z}\\ k_{y}k_{z}\\ -k_{\bot }^{2}\end{array}\right]+\frac{\text{i}s}{\sqrt{2}\,k_{\bot }}\left[\begin{array}{@{}c@{}}-k_{y}\\ \,k_{x}\\ 0\end{array}\right],\quad \text{while}~h_{\boldsymbol{k}}^{s}=\frac{1}{\sqrt{2}}\left[\begin{array}{@{}r@{}}1\\ \text{i}s\\ 0\end{array}\right]\end{eqnarray}$$
for the
 $k_{\bot }=0$
case.
On the fast timescale no instability exists since rotation cannot transfer energy to the perturbation field. The slow timescale evolution of the two fields
 $\boldsymbol{v}_{2D}^{(0)}$
and
 $\boldsymbol{v}_{w}^{(0)}$
is obtained by a solvability condition at the next order
 $$\begin{eqnarray}\partial _{t^{\prime }}\boldsymbol{v}^{(1)}+\mathbb{L}[\boldsymbol{v}^{(1)}]=-\partial _{{\it\tau}}\boldsymbol{v}_{p}^{(0)}+\mathbb{P}[\boldsymbol{v}_{p}^{(0)}\times \boldsymbol{w}_{f}+\boldsymbol{v}_{f}\times \boldsymbol{w}_{p}^{(0)}]+{\it\lambda}_{1}{\rm\Delta}\boldsymbol{v}_{p}^{(0)}.\end{eqnarray}$$
At this point we need to define the short time average
 $\langle g\rangle _{{\it\tau}}$
as
 $$\begin{eqnarray}\langle g(t)\rangle _{{\it\tau}}\equiv \frac{\mathit{Ro}_{F}^{{\it\sigma}}}{2}\int _{-1/\mathit{Ro}_{F}^{{\it\sigma}}}^{+1/\mathit{Ro}_{F}^{{\it\sigma}}}g\text{d}t\end{eqnarray}$$
with
 $-1\leqslant {\it\sigma}<1$
(i.e. the time average is over a timescale much smaller than
 ${\it\tau}$
and much bigger than
 $t^{\prime }$
). With this definition the short time average of a fast oscillating function
 $g(t)=\text{e}^{\text{i}t^{\prime }}=\text{e}^{\text{i}t/\mathit{Ro}_{F}}$
becomes
 $\langle g\rangle _{{\it\tau}}=O(\mathit{Ro}_{F}^{1+{\it\sigma}})\ll 1$
and the short time average of a slow oscillating function
 $g(t)=\text{e}^{\text{i}{\it\tau}}=\text{e}^{\text{i}t\mathit{Ro}_{F}}$
becomes the identity
 $\langle g\rangle _{{\it\tau}}=1$
. Note that the result is independent of the choice of
 ${\it\sigma}$
.
To obtain then the evolution of
 $\boldsymbol{v}_{2D}^{(0)}$
we perform a short time average and an average over the
 $z$
direction. The left-hand side, and the advection term on the right averages to zero. The vorticity advection term also averages to zero because the vertical average will eliminate all Fourier modes of
 $\boldsymbol{v}_{p}$
with
 $k_{z}$
different from that of the forcing
 $k_{z}\neq q$
. The remaining terms oscillate with frequency
 $\pm k_{z}/|\boldsymbol{k}|\neq 0$
and will be eliminated by the time average. We are thus left with
 $$\begin{eqnarray}\partial _{{\it\tau}}\boldsymbol{v}_{2D}^{(0)}={\it\lambda}_{1}{\rm\Delta}\boldsymbol{v}_{2D}^{(0)}\end{eqnarray}$$
which is a diffusion equation and thus any 2D3C perturbation will decay. Therefore, at this order the stationary flow is linearly stable to two-dimensional perturbations.
To obtain the evolution of
 $\boldsymbol{v}_{w}^{(0)}$
we multiply (4.16) with
 $\boldsymbol{h}_{\boldsymbol{k}}^{-s_{k}}\text{e}^{-\text{i}(\boldsymbol{k}\boldsymbol{x}+{\it\omega}_{\boldsymbol{k}}t^{\prime })}$
space average and short time average over to obtain the evolution equation for complex amplitude
 $H_{\boldsymbol{k}}^{s_{k}}$
:
 $$\begin{eqnarray}\partial _{{\it\tau}}H_{\boldsymbol{k}}^{s_{k}}({\it\tau})=2\mathop{\sum }_{s_{q},s_{p},\boldsymbol{q},\boldsymbol{p}\atop \boldsymbol{q}+\boldsymbol{p}=\boldsymbol{k}}\left\langle \text{e}^{\text{i}({\it\omega}_{p}-{\it\omega}_{k})t^{\prime }}\right\rangle _{{\it\tau}}\unicode[STIX]{x1D60A}_{\boldsymbol{k},\boldsymbol{q},\boldsymbol{p}}^{s_{k},s_{q},s_{p}}V_{\boldsymbol{q}}^{s_{q}}H_{\boldsymbol{p}}^{s_{p}}({\it\tau})-{\it\lambda}_{1}|\boldsymbol{k}|^{2}H_{\boldsymbol{ k}}^{s_{k}}({\it\tau}).\end{eqnarray}$$
Here
 $V_{\boldsymbol{q}}^{s_{q}}$
is the complex amplitude of the helical modes of the stationary flow (3.11). It is defined as
 $V_{\boldsymbol{q}}^{s_{q}}=\langle \text{e}^{-\text{i}\boldsymbol{q}\boldsymbol{x}}\boldsymbol{h}_{\boldsymbol{q}}^{-s_{q}}\boldsymbol{v}_{f}\rangle _{V}$
where
 $\boldsymbol{q}=(\pm q,\pm q,\pm q)$
is one of the eight forcing wavenumbers. The summation is over all wavenumbers
 $\boldsymbol{p}\in \mathbb{Z}^{3}$
and
 $\boldsymbol{q}$
such that
 $\boldsymbol{k}=\boldsymbol{q}+\boldsymbol{p}$
. The coupling tensor
 $\unicode[STIX]{x1D60A}_{\boldsymbol{k},\boldsymbol{p},\boldsymbol{q}}^{s_{k},s_{q},s_{p}}$
is given by
 $$\begin{eqnarray}\unicode[STIX]{x1D60A}_{\boldsymbol{k},\boldsymbol{q},\boldsymbol{p}}^{s_{k},s_{q},s_{p}}={\textstyle \frac{1}{2}}(s_{q}|\boldsymbol{q}|-s_{p}|\boldsymbol{p}|)[\boldsymbol{h}_{\boldsymbol{k}}^{-\boldsymbol{s}_{\boldsymbol{k}}}\boldsymbol{\cdot }(\boldsymbol{h}_{\boldsymbol{q}}^{\boldsymbol{s}_{\boldsymbol{q}}}\times \boldsymbol{h}_{\boldsymbol{p}}^{\boldsymbol{s}_{\boldsymbol{p}}})].\end{eqnarray}$$
The short time average leads to different possibilities that we discuss here in some detail. First if
 $|{\it\omega}_{p}-{\it\omega}_{k}|=O(1)$
, then the averaged term
 $\langle \text{e}^{\text{i}({\it\omega}_{p}-{\it\omega}_{k})t^{\prime }}\rangle _{{\it\tau}}$
, becomes of smaller order and thus can be neglected. We refer to these terms as non-resonant terms. If
 $|{\it\omega}_{p}-{\it\omega}_{k}|=0$
, then the averaged term leads to an order-one contribution
 $\langle \text{e}^{\text{i}({\it\omega}_{p}-{\it\omega}_{k})t^{\prime }}\rangle _{{\it\tau}}=1$
and needs to be taken into account.
The third intermediate option is when the frequency difference is very small but non-zero. For
 ${\rm\Delta}{\it\omega}=|{\it\omega}_{p}-{\it\omega}_{k}|=O(\mathit{Ro}_{F}^{2})$
, then the average
 $\langle \text{e}^{\text{i}({\it\omega}_{p}-{\it\omega}_{k})t^{\prime }}\rangle _{{\it\tau}}$
still remains an order-one quantity. Here two conflicting arguments can be put forward for the role of these quasi-resonances. On the one hand since the value of
 ${\rm\Delta}{\it\omega}$
for any two wavenumbers
 $\boldsymbol{p},\boldsymbol{q}$
is fixed and independent of
 $\mathit{Ro}_{F}$
in the limit
 $\mathit{Ro}_{F}\rightarrow 0$
the quasi-resonances can be neglected. On the other hand, from the infinity of possible pairs
 $(\boldsymbol{k},\boldsymbol{p})\in \mathbb{Z}^{6}$
one can always find a pair of wavenumbers
 $\boldsymbol{k},\boldsymbol{p}$
such that
 ${\rm\Delta}{\it\omega}=O(\mathit{Ro}_{F}^{2})$
for any value of
 $\mathit{Ro}_{F}$
. Thus, there are always wavenumbers for which quasi-resonances are important. The resolution of course comes from the fact that not all wavenumbers are available. Any finite value of
 ${\it\lambda}_{1}$
will introduce a cutoff wavenumber
 $k_{{\it\lambda}}$
such that all wavenumbers
 $\boldsymbol{k}$
with
 $|\boldsymbol{k}|>k_{{\it\lambda}}$
will be damped by viscosity. Thus, pairs from all remaining wavenumbers
 $|\boldsymbol{k}|\leqslant k_{{\it\lambda}}$
will have finite quasi-resonance frequency
 ${\rm\Delta}{\it\omega}$
and in the limit
 $\mathit{Ro}_{F}\rightarrow 0$
can be neglected. Note the importance in this argument that
 ${\it\lambda}_{1}$
is finite. If the viscous term appeared at next order (i.e.
 $\mathit{Re}_{F}=O(\mathit{Ro}_{F})^{-3}$
) this argument would break down and quasi-resonances that appear for large enough
 $|\boldsymbol{k}|$
would need to be taken into account.
The cutoff wavenumber
 $k_{{\it\lambda}}$
can be estimated by the balance of the shear of the basic flow
 $\langle (\boldsymbol{{\rm\nabla}}\boldsymbol{v}_{f})^{2}\rangle _{V}^{1/2}\propto q$
with the viscous damping
 ${\it\lambda}_{1}k_{{\it\lambda}}^{2}$
that leads to the estimate
 $$\begin{eqnarray}k_{{\it\lambda}}\propto \sqrt{\frac{q}{{\it\lambda}_{1}}}\propto \sqrt{\mathit{Re }_{F}\mathit{ Ro }_{F}q}.\end{eqnarray}$$
Thus, for small values of
 $\mathit{Ro}_{F}$
quasi-resonances can be neglected if
 ${\rm\Delta}{\it\omega}\gg O(\mathit{Ro}_{F}^{2})$
for all Fourier wavenumbers in a sphere of radius
 $k_{{\it\lambda}}$
. In what follows we give estimates for
 ${\rm\Delta}{\it\omega}$
and the density of the quasi-resonances as well as solutions for the exact resonances to estimate the validity of these assumptions in our simulations.
For exact resonances of (4.19) the following resonance conditions need to be satisfied for the wavenumbers
 $\boldsymbol{k},\boldsymbol{p},\boldsymbol{q}$
:
 $$\begin{eqnarray}\boldsymbol{k}=\boldsymbol{p}+\boldsymbol{q}\quad \text{and}\quad \frac{k_{z}}{|\boldsymbol{k}|}=s\frac{p_{z}}{|\boldsymbol{p}|}\end{eqnarray}$$
where
 $\boldsymbol{q}$
is one of the eight forcing wavevectors
 $(\pm q,\pm q,\pm q)$
that are located at the corners of a
 $2q$
-length cube centred at the origin. The sign
 $s=s_{p}s_{k}=\pm 1$
in (4.21b
) indicates whether the coupling is between waves travelling in the same direction (
 $s=+1$
) or opposite direction (
 $s=-1$
). Waves travelling in the same direction implies that the two wavenumbers lie in the same cone
 $\boldsymbol{k},\boldsymbol{p}$
of opening angle
 ${\it\theta}$
such that
 $\tan ({\it\theta})=k_{z}/|k|=p_{z}/|p|={\it\omega}$
while for opposite travelling waves the coupling is between wavenumbers
 $\boldsymbol{k},\boldsymbol{p}$
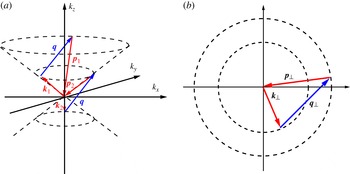
that are on opposite cones. Figure 3(a) indicates two such couplings. The projection of the three vectors
 $\boldsymbol{k},\boldsymbol{q},\boldsymbol{p}$
in the plane perpendicular to the rotation axis is shown in figure 3(b). It is obvious that the three projected vectors
 $\boldsymbol{k}_{\bot },\boldsymbol{q}_{\bot },\boldsymbol{p}_{\bot }$
can satisfy (4.21a
) if the following triangle inequalities hold
 $|\,|\boldsymbol{p}_{\bot }|-|\boldsymbol{k}_{\bot }|\,|\leqslant |\boldsymbol{q}_{\bot }|\leqslant |\boldsymbol{k}_{\bot }|+|\boldsymbol{p}_{\bot }|$
. The extreme cases being when
 $\boldsymbol{k}_{\bot },\boldsymbol{p}_{\bot }$
are parallel or antiparallel to
 $\boldsymbol{q}_{\bot }$
. Using (4.21b
) we then end up with the following bounds for the allowed wavenumbers lying on the same cone:
 $$\begin{eqnarray}\frac{\sqrt{2}q|k_{z}|}{q+2|k_{z}|}\leqslant k_{\bot }\leqslant \sqrt{2}|k_{z}|,\end{eqnarray}$$
while for opposite cones the bounds are
 $$\begin{eqnarray}\sqrt{2}|k_{z}|\leqslant k_{\bot }\quad \text{and}\quad \frac{qk_{\bot }}{2k_{\bot }+\sqrt{2}q}\leqslant |k_{z}|\leqslant \frac{qk_{\bot }}{2k_{\bot }-\sqrt{2}q}.\end{eqnarray}$$
(a) Two possible couplings of the wavevectors
 $\boldsymbol{k},\boldsymbol{p}$
(red online) with the forcing wavenumber
 $\boldsymbol{q}$
(blue online). (b) The
 $(k_{x},k_{y})$
-plane where two circles of radius
 $|\boldsymbol{p}_{\bot }|$
and
 $|\boldsymbol{q}_{\bot }|$
have been drawn. In order for the forcing wavevector
 $\boldsymbol{q}_{\bot }=(q,q,0)$
to be able to form a triangle with two wavenumbers
 $\boldsymbol{p}_{\bot }$
and
 $\boldsymbol{k}_{\bot }$
its two ends need to be placed at the edges of the two circles as shown by the (blue online) arrow. Thus,
 $\boldsymbol{q}_{\bot }$
needs to be longer than the distance
 $|p_{\bot }-k_{\bot }|$
and shorter than the distance
 $|p_{\bot }+k_{\bot }|$
.

The triangle inequalities however do not guarantee the existence of resonances because the wavenumbers,
 $\boldsymbol{k},\boldsymbol{q},\boldsymbol{p}$
are discrete and the (4.22) need to be solved on a discrete lattice. General solutions of such problems however are non-trivial and have been solved but for very few cases (Bustamante & Hayat Reference Bustamante and Hayat2013). However, there are two simple solutions that can be found by simple inspection. The first is simply when
 $\boldsymbol{p}=m\boldsymbol{q}/q$
for any integer
 $m\in \mathbb{Z}$
. Then
 $\boldsymbol{k}$
lies in the same cone as
 $\boldsymbol{p}$
and is given by
 $\boldsymbol{k}=(m\pm 1)\boldsymbol{q}/q$
and the resonance condition (4.22b
) is satisfied exactly. This condition however leads to zero nonlinearity as it corresponds to coupling of parallel shear layers that are exact solutions of the Euler equations. The second type of exact resonances is obtained for
 $$\begin{eqnarray}\displaystyle \boldsymbol{k}=\left[\begin{array}{@{}c@{}}-s_{x}\,m\,q\\ s_{y}\,(m+1)\,q\\ s_{z}\,q/2\end{array}\right]\quad \text{and}\quad \boldsymbol{p}=\left[\begin{array}{@{}c@{}}-s_{x}\,(m+1)\,q\\ s_{y}\,m\,q\\ -s_{z}q/2\end{array}\right],\quad \text{for}\;\boldsymbol{q}=\left[\begin{array}{@{}c@{}}s_{x}q\\ s_{y}q\\ s_{z}q\end{array}\right]\!, & & \displaystyle\end{eqnarray}$$
true for every
 $s_{x},s_{y},s_{z}=\pm 1$
and
 $m\in \mathbb{Z}$
. This solution couples modes in opposite cones and results in non-zero coupling. Note that these modes only exist when
 $q$
is even since
 $q/2$
that appears in (4.25) has to be an integer. For
 $q=2$
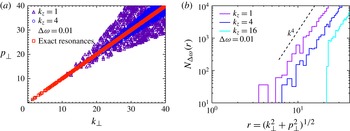
, that is examined here, these two solutions were the only exact solutions found by numerically solving (4.22). For larger values of
 $q$
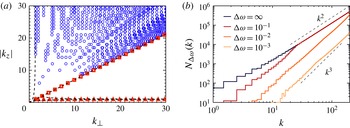
more exact solutions were found but not a simple analytical formula for them. Figure 4(a) shows in the plane
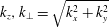 $k_{z},k_{\bot }=\sqrt{k_{x}^{2}+k_{y}^{2}}$
and for
 $q=2$
the location of the exact resonances of the first type
 $\boldsymbol{k}=m\boldsymbol{q}/q$
by (red online) squares and of the second type (4.25) by (red online) triangles. The dashed lines indicate the bounds (4.23) and (4.24).
(a) The location of the exact resonances
 $\boldsymbol{k}=m\boldsymbol{q}/q$
by (red online) squares, the exact resonances (4.25) by (red online) triangles, quasi-resonances by (blue online) circles for a frequency tolerance
 ${\rm\Delta}{\it\omega}=10^{-3}$
in the plane
 $k_{z},k_{\bot }=\sqrt{k_{x}^{2}+k_{y}^{2}}$
. The dashed lines indicate the bounds (4.23) and (4.24). (b) Number of modes
 $N_{{\rm\Delta}{\it\omega}}(k)$
that satisfy the quasi-resonance conditions up to a frequency ambiguity
 ${\rm\Delta}{\it\omega}$
on the spherical shell
 $k<|\boldsymbol{k}|\leqslant k+1$
.

The modes with the smallest value of
 $|\boldsymbol{k}|$
and
 $|\boldsymbol{p}|$
that fall in the set (4.25) for
 $q=2$
are obtained for
 $m=0$
and
 $m=-1$
. For example, a simple pair of coupled modes is given by
 $\boldsymbol{k}=(2,0,1)$
and
 $\boldsymbol{p}=(0,-2,-1)$
for
 $\boldsymbol{q}=(2,2,2)$
. Keeping only these modes we can write a minimal model for their linear evolution:
 $$\begin{eqnarray}\left.\begin{array}{@{}l@{}}\partial _{{\it\tau}}H_{\boldsymbol{k}}^{+}=\mathscr{M}_{k}H_{\boldsymbol{p}}^{-}-|\boldsymbol{p}|^{2}{\it\lambda}_{1}H_{\boldsymbol{k}}^{+}\\ \partial _{{\it\tau}}H_{\boldsymbol{p}}^{-}=\mathscr{M}_{p}H_{\boldsymbol{k}}^{+}-|\boldsymbol{k}|^{2}{\it\lambda}_{1}H_{\boldsymbol{p}}^{+}\end{array}\right\}\end{eqnarray}$$
where
 $\mathscr{M}_{k}=\unicode[STIX]{x1D60A}_{\boldsymbol{k},\boldsymbol{q},\boldsymbol{p}}^{+,+,-}V_{\boldsymbol{q}}^{+}+\unicode[STIX]{x1D60A}_{\boldsymbol{k},\boldsymbol{q},\boldsymbol{p}}^{+,-,-}V_{\boldsymbol{q}}^{-}$
and
 $\mathscr{M}_{p}=\unicode[STIX]{x1D60A}_{\boldsymbol{p},\boldsymbol{q},\boldsymbol{k}}^{-,+,+}V_{\boldsymbol{q}}^{+}+\unicode[STIX]{x1D60A}_{\boldsymbol{p},\boldsymbol{q},\boldsymbol{k}}^{-,-,+}V_{\boldsymbol{q}}^{-}$
. This type of three-mode model was used by Waleffe (Reference Waleffe1993) to predict the transfer of energy in Fourier space. Note however that in this case one of the three modes is always the non-oscillating forced mode. The model predicts instability when
 ${\it\lambda}_{1}$
is smaller than a critical value
 ${\it\lambda}_{1c}=3/20\sqrt{5}\simeq 0.065\dots$
implying instability for
 $\mathit{Re}_{F}\geqslant 14.9\dots \mathit{Ro}_{F}^{-1}$
. The stability from the numerical was estimated closer to
 $\mathit{Re}_{F}\geqslant 20\mathit{Ro}_{F}^{-1}$
indicating that ignoring the higher exact resonances underestimated the stability boundary and/or that sufficiently large
 $\mathit{Ro}_{F}$
(so that quasi-resonances can be neglected) has not be reached yet in our simulations.
As discussed before in the
 $\mathit{Ro}_{F}\rightarrow 0$
limit only the exact resonances need to be retained. However, since numerical simulations always operate on finite values of
 $\mathit{Ro}_{F}$
beside the exact resonances we also need to consider quasi-resonances for which (4.22b
) is satisfied up to an
 ${\rm\Delta}{\it\omega}=O(\mathit{Ro}_{F}^{2})$
accuracy. The resonance conditions (4.22) define a surface embedded in the
 $\mathbb{R}^{3}$
space of
 $\boldsymbol{k}$
where they are satisfied. Allowing for a
 ${\rm\Delta}{\it\omega}$
ambiguity implies that modes within a distance
 ${\rm\Delta}k$
normal to the resonance surface should also be considered. Here
 ${\rm\Delta}k$
is estimated by Taylor expansion
 ${\rm\Delta}{\it\omega}\simeq ({\rm\Delta}\boldsymbol{k})\boldsymbol{\cdot }\boldsymbol{{\rm\nabla}}_{\boldsymbol{k}}({\it\omega}_{\boldsymbol{k}}-{\it\omega}_{\boldsymbol{k}+\boldsymbol{q}})\propto ({\rm\Delta}k)q/k^{2}$
, where the last relation is valid in the
 $q\ll |\boldsymbol{k}|$
limit. The volume
 $V_{k}$
in Fourier space occupied by these allowed wavenumbers inside a sphere of radius
 $k$
is then proportional the area of the resonance surface times the thickness
 ${\rm\Delta}k$
, thus
 $V_{k}\propto k^{2}{\rm\Delta}k$
. The total number of quasi-resonances on a spherical shell of radius
 $k$
and width
 ${\it\delta}k=1$
will scale as
 $N_{{\rm\Delta}{\it\omega}}(k)=n_{k}\partial _{k}V_{k}$
thus
 $$\begin{eqnarray}N_{{\rm\Delta}{\it\omega}}(k)\propto k{\rm\Delta}k\propto k^{3}{\rm\Delta}{\it\omega}.\end{eqnarray}$$
This scaling is valid provided that
 ${\rm\Delta}k\simeq {\rm\Delta}{\it\omega}k^{2}/q$
remains small. For large values of
 $k$
however,
 ${\rm\Delta}k$
becomes so large that all of the modes inside the spherical shell satisfy the resonance conditions (4.22). The scaling will thus transition to
 $N_{{\rm\Delta}{\it\omega}}(k)=4{\rm\pi}k^{2}$
. Quasi-resonances were sought for numerically and the results are shown in figure 4. Figure 4(a) shows the location of the quasi-resonances by (blue online) circles for a frequency tolerance
 ${\rm\Delta}{\it\omega}=10^{-3}$
. Figure 4(b) indicates number of modes that satisfy the quasi-resonance conditions up to a frequency ambiguity
 ${\rm\Delta}{\it\omega}$
on the spherical shell
 $k<|\boldsymbol{k}|\leqslant k+1$
. The notation
 ${\rm\Delta}{\it\omega}=\infty$
implies all pairs of modes in this spherical shell are counted independent of resonances. The scalings
 $k^{2}$
and
 $k^{3}$
predicted in the previous paragraph are shown as a reference. It is clear that quasi-resonances increase very rapidly and unless the viscous cutoff wavenumber
 $k_{{\it\lambda}}$
is sufficiently small, very high rotation rates will be required to justify their neglect.
5. Nonlinear behaviour
5.1. Reduced equations
The previous section determined the values of the parameters for which a dynamical behaviour will be observed in the fast rotating limit. The properties of this dynamical behaviour however can only be determined when nonlinearities are taken into account. To understand the nonlinear behaviour the asymptotic expansion in the fast rotating limit is examined including the nonlinear terms. Following the same steps as we did in the previous section we begin from (4.1) with
 $n=1$
and expand
 $\boldsymbol{v}=\boldsymbol{v}^{(0)}+\mathit{Ro}_{F}^{2}\boldsymbol{v}^{(1)}+\cdots$
. At zeroth order we obtain the same linear equation for
 $\boldsymbol{v}$
as we did for
 $\boldsymbol{v}_{p}$
in (4.11). The general solution of which is then given by
 $$\begin{eqnarray}\boldsymbol{v}^{(0)}=\boldsymbol{v}_{f}^{(0)}(x,y,z)+\boldsymbol{v}_{2D}^{(0)}({\it\tau},x,y)+\boldsymbol{v}_{w}^{(0)}({\it\tau},t,x,y,z).\end{eqnarray}$$
As before
 $\boldsymbol{v}_{f}^{(0)}$
is the zeroth-order stationary solution (3.11),
 $\boldsymbol{v}_{2D}^{(0)}$
is a velocity field that depends only on the (
 $x,y$
) coordinates and on the slow dynamical time
 ${\it\tau}$
,
 $\boldsymbol{v}_{w}^{(0)}$
are inertial waves whose amplitude also varies on the long timescale and their exact form is given by (4.13).
To next order we then have
 $$\begin{eqnarray}\partial _{t}\boldsymbol{v}^{(1)}+\mathbb{L}[\boldsymbol{v}^{(1)}]=-\partial _{{\it\tau}}\boldsymbol{v}^{(0)}+\mathbb{P}[\boldsymbol{v}^{(0)}\times \boldsymbol{w}^{(0)}]+{\it\lambda}_{1}{\rm\Delta}\boldsymbol{v}^{(0)}.\end{eqnarray}$$
To obtain then the evolution of
 $\boldsymbol{v}_{2D}^{(0)}$
we perform a short time average and an average over the
 $z$
direction. The left-hand side averages to zero and we are left with
 $$\begin{eqnarray}\displaystyle \partial _{{\it\tau}}\boldsymbol{v}_{2D}^{(0)} & = & \displaystyle \left\langle \overline{\mathbb{P}[\boldsymbol{v}^{(0)}\times \boldsymbol{w}^{(0)}]}\right\rangle _{{\it\tau}}+{\it\lambda}_{1}{\rm\Delta}\boldsymbol{v}_{2D}^{(0)}\nonumber\\ \displaystyle & = & \displaystyle \left\langle \overline{\mathbb{P}[\boldsymbol{v}_{f}^{(0)}\times \boldsymbol{w}_{f}^{(0)}]}\right\rangle _{{\it\tau}}+\left\langle \overline{\mathbb{P}[\boldsymbol{v}_{f}^{(0)}\times \boldsymbol{w}_{w}^{(0)}]}\right\rangle _{{\it\tau}}+\left\langle \overline{\mathbb{P}[\boldsymbol{v}_{f}^{(0)}\times \boldsymbol{w}_{2D}^{(0)}]}\right\rangle _{{\it\tau}}\nonumber\\ \displaystyle & & \displaystyle +\,\left\langle \overline{\mathbb{P}[\boldsymbol{v}_{w}^{(0)}\times \boldsymbol{w}_{f}^{(0)}]}\right\rangle _{{\it\tau}}+\left\langle \overline{\mathbb{P}[\boldsymbol{v}_{w}^{(0)}\times \boldsymbol{w}_{w}^{(0)}]}\right\rangle _{{\it\tau}}+\left\langle \overline{\mathbb{P}[\boldsymbol{v}_{w}^{(0)}\times \boldsymbol{w}_{2D}^{(0)}]}\right\rangle _{{\it\tau}}\nonumber\\ \displaystyle & & \displaystyle +\,\left\langle \overline{\mathbb{P}[\boldsymbol{v}_{2D}^{(0)}\times \boldsymbol{w}_{f}^{(0)}]}\right\rangle _{{\it\tau}}+\left\langle \overline{\mathbb{P}[\boldsymbol{v}_{2D}^{(0)}\times \boldsymbol{w}_{w}^{(0)}]}\right\rangle _{{\it\tau}}+\left\langle \overline{\mathbb{P}[\boldsymbol{v}_{2D}^{(0)}\times \boldsymbol{w}_{2D}^{(0)}]}\right\rangle _{{\it\tau}}\nonumber\\ \displaystyle & & \displaystyle +\,{\it\lambda}_{1}{\rm\Delta}\boldsymbol{v}_{2D}^{(0)}.\end{eqnarray}$$
The only quadratic terms that remain non-zero after the vertical average are
 $$\begin{eqnarray}\left\langle \overline{\mathbb{P}[\boldsymbol{v}_{f}^{(0)}\times \boldsymbol{w}_{w}^{(0)}]}\right\rangle _{{\it\tau}},\quad \left\langle \overline{\mathbb{P}[\boldsymbol{v}_{w}^{(0)}\times \boldsymbol{w}_{f}^{(0)}]}\right\rangle _{{\it\tau}},\quad \left\langle \overline{\mathbb{P}[\boldsymbol{v}_{w}^{(0)}\times \boldsymbol{w}_{w}^{(0)}]}\right\rangle _{{\it\tau}}\quad \text{and}\quad \left\langle \overline{\mathbb{P}[\boldsymbol{v}_{2D}^{(0)}\times \boldsymbol{w}_{2D}^{(0)}]}\right\rangle _{{\it\tau}}.\end{eqnarray}$$
The first two correspond to the terms that appear in linear theory and we have already shown that lead to zero contribution after the short time average. The third term can be written using the helical mode expansion (4.13) as
 $$\begin{eqnarray}\left\langle \overline{\mathbb{P}[\boldsymbol{v}_{w}^{(0)}\times \boldsymbol{w}_{w}^{(0)}]}\right\rangle _{{\it\tau}}=\mathop{\sum }_{s_{k},s_{p},\boldsymbol{k},\boldsymbol{p}\atop k_{z}+p_{z}=0}\left(\left\langle \text{e}^{\text{i}({\it\omega}_{k}+{\it\omega}_{p})t}\right\rangle _{{\it\tau}}\text{e}^{\text{i}(\boldsymbol{k}+\boldsymbol{p})\boldsymbol{\cdot }\boldsymbol{x}}\boldsymbol{D}_{\boldsymbol{ k},\boldsymbol{p}}^{s_{k},s_{p}}H_{\boldsymbol{k}}^{s_{k}}H_{\boldsymbol{q}}^{s_{q}}\right).\end{eqnarray}$$
The vector
 $\boldsymbol{D}_{\boldsymbol{k},\boldsymbol{p}}^{s_{k},s_{p}}$
is given by
 $$\begin{eqnarray}\boldsymbol{D}_{\boldsymbol{k},\boldsymbol{p}}^{s_{k},s_{p}}={\textstyle \frac{1}{2}}(s_{k}|\boldsymbol{k}|-s_{p}|\boldsymbol{p}|)\mathbb{P}_{\boldsymbol{r}}[\boldsymbol{h}_{\boldsymbol{k}}^{\boldsymbol{s}_{\boldsymbol{k}}}\times \boldsymbol{h}_{\boldsymbol{p}}^{\boldsymbol{s}_{\boldsymbol{p}}}]=\unicode[STIX]{x1D60A}_{\boldsymbol{r},\boldsymbol{k},\boldsymbol{p}}^{\boldsymbol{s}_{\boldsymbol{r}},\boldsymbol{s}_{\boldsymbol{k}},\boldsymbol{s}_{\boldsymbol{p}}}h_{\boldsymbol{r}}^{\boldsymbol{s}_{\boldsymbol{r}}}\end{eqnarray}$$
(where
 $\boldsymbol{r}=\boldsymbol{k}+\boldsymbol{p}$
and
 $\mathbb{P}_{\boldsymbol{k}}[\boldsymbol{g}_{\boldsymbol{k}}]=\boldsymbol{k}\times \boldsymbol{k}\times \boldsymbol{g}_{\boldsymbol{k}}/|\boldsymbol{k}^{2}|$
is the projection operator
 $\mathbb{P}$
in Fourier space). A remarkable result of Waleffe (Reference Waleffe1993) was that for exact resonances
 ${\it\omega}_{k}+{\it\omega}_{p}=0$
this term (5.5) also averages to zero. This can be realized by noting that
 $k_{z}+p_{z}=0$
and
 ${\it\omega}_{k}+{\it\omega}_{p}=0$
implies that
 $|\boldsymbol{k}|=|\boldsymbol{p}|$
and
 $s_{p}=s_{k}$
and therefore the vector
 $\boldsymbol{D}_{\boldsymbol{k},\boldsymbol{p}}^{s_{k},s_{p}}$
in (5.6) becomes zero and does not effect the 2D3C flow. At this order then the only nonlinear term left for the evolution of the 2D3C flow is the coupling with itself, that leads to
 $$\begin{eqnarray}\partial _{{\it\tau}}\boldsymbol{v}_{2D}^{(0)}=\mathbb{P}[\boldsymbol{v}_{2D}^{(0)}\times \boldsymbol{w}_{2D}^{(0)}]+{\it\lambda}_{1}{\rm\nabla}^{2}\boldsymbol{v}_{2D}^{(0)}\end{eqnarray}$$
which is the unforced 2D Navier–Stokes equation. As result at this order the nonlinear evolution equation for the 2D3C flow completely decouples from the rest of the flow, and since there is no forcing term in (5.7),
 $\boldsymbol{v}_{2D}^{(0)}$
will decay to zero at long times.
In the simulations however for all dynamical regimes a 2D3C flow was present. In order to explain the presence of a 2D3C flow in the simulation we have to evoke either quasi-resonances and higher-order terms in the expansion or a breakdown of the fast rotating limit. We consider then quasi-resonances that could lead to the generation of a quasi-2D flow and allow for a frequency tolerance
 ${\rm\Delta}{\it\omega}\ll 1$
over which a violation of the resonance condition is allowed. For fixed
 $k_{z}=-p_{z}$
the coupling triads reside in the four-dimensional space defined by
 $(k_{x},k_{y},p_{x},p_{y})$
. In this space a four spherical shell of unit thickness and of radius
 $r=(k_{\bot }^{2}+p_{\bot }^{2})^{1/2}$
, has
 $N\propto r^{3}$
triads out of which the quasi-resonance condition confines the allowed triads to reside in a subspace of thickness
 ${\rm\Delta}k_{\bot }$
that limits their number to
 $N_{{\rm\Delta}{\it\omega}}\propto r^{2}{\rm\Delta}k$
. The thickness
 ${\rm\Delta}k$
is obtained from the dispersion relation
 ${\rm\Delta}{\it\omega}\simeq {\rm\Delta}k_{\bot }\partial _{k_{\bot }}{\it\omega}=-{\rm\Delta}k_{\bot }k_{z}k_{\bot }/k^{3}$
. Thus,
 ${\rm\Delta}k_{\bot }\propto {\rm\Delta}{\it\omega}k^{3}/k_{z}k_{\bot }\simeq {\rm\Delta}{\it\omega}r^{2}/k_{z}$
for
 $k_{\bot }\gg k_{z}$
. The number of these allowed modes then will scale as
 $N_{{\rm\Delta}{\it\omega}}(r)\propto r^{2}{\rm\Delta}k\propto r^{4}/k_{z}{\rm\Delta}{\it\omega}$
(where locality between the modes
 $k_{\bot }\sim p_{\bot }\sim r$
has been assumed). The number of quasi-resonances therefore grows with
 $k$
even faster than the quasi-resonances of the linear term in the previous section. Another noteworthy point is that the smallest values of
 $k_{z}$
have the largest number quasi-resonances (
 $k_{z}=1$
for our case).
At figure 5(a) we plot the exact resonances, and the quasi-resonances for
 $k_{z}=1,4$
and
 ${\rm\Delta}{\it\omega}=0.01$
on the
 $k_{\bot },p_{\bot }$
plane. Owing to their large number only 1 in 100 points has been plotted. Figure 5(b) of the same figure shows the density
 $N_{{\rm\Delta}{\it\omega}}(r)$
for different values of
 $k_{z}$
. These modes however will contribute to the 2D3C dynamics with coupling coefficients of the order
 $\boldsymbol{D}_{\boldsymbol{k},\boldsymbol{p}}^{s_{k},s_{p}}=O({\rm\Delta}k)=O({\rm\Delta}{\it\omega})$
. Their contribution to the
 $\boldsymbol{v}_{2D}^{(0)}$
evolution will be of the order of
 $N_{{\rm\Delta}{\it\omega}}\boldsymbol{D}_{\boldsymbol{k},\boldsymbol{p}}^{s_{k},s_{p}}=O({\rm\Delta}{\it\omega}^{2})$
, and thus the same order as the next-order term in the expansion.
(a) The location of resonances for the modes
 $\boldsymbol{k},\boldsymbol{p}$
. Exact resonances are shown by (red online) squares, and the quasi-resonances by (blue online) circles (
 $k_{z}=-p_{z}=4$
) and (purple online) triangles (
 $k_{z}=-p_{z}=1$
) for a frequency tolerance
 ${\rm\Delta}{\it\omega}=10^{-2}$
. (b) Number of modes
 $N_{{\rm\Delta}{\it\omega}}(r)$
that satisfy the quasi-resonance conditions up to a frequency ambiguity
 ${\rm\Delta}{\it\omega}$
on the spherical shell
 $r<\sqrt{k_{\bot }^{2}+p_{\bot }^{2}}|\leqslant r+1$
.

In order thus to capture this contribution the expansion will need to be carried at next order introducing a second slow timescale and increasing
 $\mathit{Re}_{F}$
to the scaling
 $\mathit{Re}_{F}={\it\lambda}_{2}\mathit{Ro}_{F}^{3}$
. The process that ‘lives’ on this second timescale although slower, on the long time limit that we investigate here could be dominant and explain the 2D3C dynamics observed in the simulations.
To obtain the evolution equation for the amplitude
 $H_{\boldsymbol{k}}^{s_{k}}$
of the inertial waves we multiply (5.2) with
 $\boldsymbol{h}_{\boldsymbol{k}}^{-s_{k}}\text{e}^{-\text{i}(\boldsymbol{k}\boldsymbol{\cdot }\boldsymbol{x}+{\it\omega}_{k}t)}$
and space–time average. The right-hand side will then drop out and we are going to be left with the evolution equation for the complex amplitude:
 $$\begin{eqnarray}\displaystyle \partial _{{\it\tau}}H_{\boldsymbol{k}}^{s_{k}}({\it\tau}) & = & \displaystyle \left\langle \left\langle \boldsymbol{h}_{\boldsymbol{ k}}^{-s_{k}}\text{e}^{-\text{i}(\boldsymbol{k}\boldsymbol{\cdot }\boldsymbol{x}+{\it\omega}_{k}t)}\mathbb{P}[\boldsymbol{v}^{(0)}\times \boldsymbol{w}^{(0)}]\right\rangle _{V}\right\rangle _{{\it\tau}}-{\it\lambda}_{1}|\boldsymbol{k}|^{2}H_{\boldsymbol{ k}}^{s_{k}}({\it\tau})\nonumber\\ \displaystyle & = & \displaystyle \left\langle \left\langle \boldsymbol{h}_{\boldsymbol{k}}^{-s_{k}}\text{e}^{-\text{i}(\boldsymbol{k}\boldsymbol{\cdot }\boldsymbol{x}+{\it\omega}_{k}t)}\mathbb{P}[\boldsymbol{v}_{f}^{(0)}\times \boldsymbol{w}_{w}^{(0)}+\boldsymbol{v}_{w}^{(0)}\times \boldsymbol{w}_{f}^{(0)}]\right\rangle _{V}\right\rangle _{{\it\tau}}\nonumber\\ \displaystyle & & \displaystyle +\,\left\langle \left\langle \boldsymbol{h}_{\boldsymbol{k}}^{-s_{k}}\text{e}^{-\text{i}(\boldsymbol{k}\boldsymbol{\cdot }\boldsymbol{x}+{\it\omega}_{k}t)}\mathbb{P}[\boldsymbol{v}_{2D}^{(0)}\times \boldsymbol{w}_{w}^{(0)}+\boldsymbol{v}_{w}^{(0)}\times \boldsymbol{w}_{2D}^{(0)}]\right\rangle _{V}\right\rangle _{{\it\tau}}\nonumber\\ \displaystyle & & \displaystyle +\,\left\langle \left\langle \boldsymbol{h}_{\boldsymbol{k}}^{-s_{k}}\text{e}^{-\text{i}(\boldsymbol{k}\boldsymbol{\cdot }\boldsymbol{x}+{\it\omega}_{k}t)}\mathbb{P}[\boldsymbol{v}_{w}^{(0)}\times \boldsymbol{w}_{w}^{(0)}]\right\rangle _{V}\right\rangle _{{\it\tau}}-{\it\lambda}_{1}|\boldsymbol{k}|^{2}H_{\boldsymbol{ k}}^{s_{k}}({\it\tau}).\end{eqnarray}$$
The first term couples the inertial waves to the stationary flow. It is the same term that was studied in the linear stability section and is the term that injects energy into inertial waves. The second term corresponds to the term that couples the 2D3C flow to the inertial waves. This coupling term does not exchange energy with the 2D3C part of the flow as was discussed before. It can, however, redistribute the energy among the inertial wave modes modes
 $\boldsymbol{k},\boldsymbol{p}$
with
 $k_{z}=p_{z}$
and
 $k_{\bot }=p_{\bot }$
(see Waleffe Reference Waleffe1993). The third term couples all of the inertial waves with each other. In the fast rotating limit only exact resonances with will survive at this order after the short time average. For the wavenumbers
 $\boldsymbol{k}_{1},\boldsymbol{k}_{2},\boldsymbol{k}_{3}$
the following resonance conditions hold:
 $$\begin{eqnarray}\boldsymbol{k}_{3}=\boldsymbol{k}_{1}+\boldsymbol{k}_{2}\quad \text{and}\quad s_{3}\frac{k_{3z}}{|\boldsymbol{k}_{3}|}=s_{1}\frac{k_{1z}}{|\boldsymbol{k}_{1}|}+s_{2}\frac{k_{2z}}{|\boldsymbol{k}_{2}|}.\end{eqnarray}$$
Analysing the statistical properties of the flow through these exact resonances is the subject of weak wave turbulence theory that has been discussed in Galtier (Reference Galtier2003) and leads to the prediction for the energy spectrum
 $E(k_{\bot })\propto k_{\bot }^{-5/2}$
(with the possibility of less steep spectra when the helicity flux dominates (Galtier Reference Galtier2014)).
5.2. Intermittent bursts
Given the theoretical background discussed in the previous section we can try to interpret the observed results in the simulations. As discussed in § 2 the striking feature of the flow close to the linear stability boundary is bursts of energy followed by a slow decay. The flow during this slow decay phase is dominated by a large 2D3C component. Figure 6(a) shows a series of such burst for a typical run in this range (
 $\mathit{Re}_{F}=1000,\mathit{Ro}_{F}=0.125$
). The dark (blue online) curve shows the evolution of the total energy and the light grey (red online) line shows the evolution of the energy of the 2D3C component of the flow. Figure 6(b) shows the same signal focused on a single burst that has been shifted to
 $t=0$
. It can be seen that at the birth of the burst the inertial waves (the non-2D3C component of the flow) become unstable and increase to a high amplitude. The inertial waves then drive the increase of the 2D3C component that follows after. After the burst the 2D3C flow dominates and slowly decays exponentially by a rate proportional to the viscosity. As a result for large values of
 $\mathit{Re}_{F}$
the decay is slow. Thus, in order to get well-converged averages, runs of long durations are needed.
More detail on the energy distribution during a burst can be seen in figure 7 where a greyscale (colour online) image of the energy spectrum on the
 $k_{\bot },k_{z}$
plane is shown. The four images correspond to the four times indicated by the vertical dashed lines in figure 6(b). The forcing wavenumber on these plots (
 $k_{z}=2,k_{\bot }=2\sqrt{2}\simeq 3$
) is indicated by a square while the first unstable mode predicted by the linear theory (
 $k_{z}=1,k_{x}=2,k_{y}=0,\rightarrow k_{\bot }=2$
, see (4.26)) is denoted by the diamond. The evolution of the burst can then be described as follows: during the decay phase most of the energy is in the
 $k_{z}=0$
plane (2D3C flow) and a small part on the forcing wavenumber. As the amplitude of the 2D3C flow decays the amplitude of the forcing mode increases approaching the solution (3.11). As this solution is approached a point is reached that the
 $(2,0,1),(0,-2,-1)$
modes becomes unstable and starts to grow. When their amplitude becomes large enough (peak of the burst) the system becomes strongly nonlinear and allows for the violation of the resonant conditions. It thus couples to a large number of modes including modes with
 $k_{z}=0$
. The energy of the unstable mode is transferred in all of these modes and cascades to the dissipation scales. This is true for all but the 2D3C modes that due to their quasi-two-dimensionality do not cascade their energy to the small scales but in the large scales. They thus form a large-scale condensate at
 $k_{z}=0$
,
 $k_{\bot }=1$
that suppresses the instability. Afterwards it decays on the slow diffusive timescale since there is no further injection of energy to sustain it. This process is then repeated.
(a) A series of bursts for (
 $\mathit{Re}_{F}=1000,\mathit{Ro}_{F}=0.125$
). The dark (blue online) curve shows the evolution of the total energy and the light grey (red online) line shows the evolution of the energy of the 2D3C component of the flow. (b) The same signal focused on a single burst that has been shifted to
 $t=0$
.

Greyscale images of the energy spectrum on the
 $k_{\bot },k_{z}$
plane. The four images correspond to the four times indicated by the vertical dashed lines in figure 6(b).

This behaviour of a fast increase followed by a slow decay is typical in dynamical systems that pass through a hyperbolic point for which the rate of attraction at the attracting manifold is small. The simplest version perhaps of such a model is written as
 $$\begin{eqnarray}\left.\begin{array}{@{}l@{}}\dot{x}=x-y^{2}x\\ \dot{y}=-{\it\epsilon}y+x^{2}y\end{array}\right\}\end{eqnarray}$$
where
 ${\it\epsilon}\ll 1$
. This model has closed flow lines given by
 $C=\ln (yx^{{\it\epsilon}})-(x^{2}+y^{2})/2$
shown in figure 8, with
 $x=y=0$
being a hyperbolic unstable point and
 $x=\sqrt{{\it\epsilon}}$
and
 $y=1$
a neutrally stable point. Trajectories passing near the unstable point
 $(0,0)$
slowly approach it along the
 $y$
-axis, until the
 $x$
-mode becomes unstable leading a sudden increase of energy followed again by the slow decay. This procedure leads to the bursts shown in figure 8(b).
(a) Phase-space trajectories of the model (5.10) and (b) time evolution of a particular solution of the same model.

A more realistic model can perhaps be written taking into account the dynamically most relevant modes in the system. Based on the results of the linear study we consider two complex amplitudes
 $x,y$
that represent the two unstable modes
 $(2,0,1)$
and
 $(0,-2,-1)$
, respectively, with frequency
 ${\it\omega}_{x}={\it\omega}_{y}={\it\omega}$
one complex amplitude
 $z$
for the forcing mode
 $(2,2,2)$
with frequency
 ${\it\omega}_{z}\neq {\it\omega}$
and one real amplitude
 $u$
representing the 2D3C field not affected by rotation:
 $$\begin{eqnarray}\left.\begin{array}{@{}l@{}}\displaystyle {\dot{x}}=\frac{\text{i}{\it\omega}}{{\it\epsilon}}x+z\,\,y-{\it\epsilon}|u|^{2}x-{\it\lambda}x\\ \displaystyle {\dot{y}}=\frac{\text{i}{\it\omega}}{{\it\epsilon}}y+z^{\ast }x-{\it\epsilon}|u|^{2}y-{\it\lambda}y\\ \displaystyle {\dot{z}}=\frac{\text{i}{\it\omega}_{z}}{{\it\epsilon}}z-2y^{\ast }x-{\it\lambda}z+\frac{f_{0}}{{\it\epsilon}}\\ \displaystyle \dot{u}={\it\epsilon}u(|x|^{2}+|y^{2}|)-{\it\lambda}u\end{array}\right\}.\end{eqnarray}$$
The coupling of the modes
 $x,y,z$
follows the coupling of the
 $(2,0,1)$
,
 $(0,-2,-1)$
,
 $(2,2,2)$
modes from the Navier–Stokes equation while the coupling with 2D3C mode
 $u$
that is through strong multi-mode interaction is modelled as a higher-order nonlinearity. The nonlinear term conserves the energy
 $|z|^{2}+|x|^{2}+|y|^{2}+|u|^{2}$
. In the absence of the modes
 $x=y=u=0$
the
 $z$
-mode saturates at the value
 $z=\text{i}\,f_{0}/{\it\omega}_{z}=O(1)$
. However, it is an unstable solution to the two resonant modes
 $x,y$
when
 ${\it\lambda}<|\,f_{0}/{\it\omega}_{z}|$
. The different frequencies of the
 $z$
-mode and
 $x,y$
modes will make the nonlinear term
 $zy$
and
 $z^{\ast }x$
fast oscillating and thus ineffective to saturate the instability at
 $x,y=O(1)$
values. Saturation comes at order
 $x,y=O(1/{\it\epsilon})$
, but before this happens at order
 $1/\sqrt{{\it\epsilon}}$
the mode
 $u$
becomes unstable that absorbs almost all energy and decays on a timescale
 $1/{\it\lambda}$
as observed in the simulations.
A comparison of the results of the model with the DNS can be seen by comparing figure 9 that shows the evolution of the energy of the model with figure 6 that shows the results from DNS. Although the full complexity of the DNS is not recovered due to the simplicity of the coupling to the 2D3C modes in the model, the basic features are reproduced. It is mentioned here that the results of the simulations can be reproduced qualitatively by a finite-mode model because a finite box size is considered (i.e.
 $q=2=O(1)$
). In the case of long boxes different two-scale asymptotic expansions could be considered that would lead to reduced partial differential equations as found in many different set-ups in rotating convection (see for example Julien, Knobloch & Werne Reference Julien, Knobloch and Werne1998; Julien et al.
Reference Julien, Knobloch, Milliff and Werne2006a
,Reference Julien, Knobloch, Rubio and Vasil
b
).
The evolution of different components of the energy of the model (5.11).

5.3. Two-dimensional condensates and fully turbulent flows
As discussed in § 2 in the parameter space for
 $\mathit{Re}_{F}>300$
and
 $1\geqslant \mathit{Ro}_{F}\geqslant \mathit{Re}_{F}^{-{\it\alpha}}$
the flow forms 2D3C condensates. This class of flows describes the fate of rotating turbulence obtained in the limit
 $\mathit{Re}_{F}\rightarrow \infty$
for any fixed value of
 $\mathit{Ro}_{F}$
with
 $\mathit{Ro}_{F}<0.4$
. The value of
 ${\it\alpha}$
depends on which order an injection of energy to the 2D3C flow first appears. Here
 ${\it\alpha}<1$
(i.e.
 $n=1$
) for which case the bursts are observed. If second-order terms couple inertial waves with the 2D3C flow and inject to it energy, then
 ${\it\alpha}=1/3$
(i.e.
 $n=2$
). If not,
 ${\it\alpha}=1/5$
(i.e.
 $n=3$
) in which case the stationary flow alone injects energy into the 2D3C component.
Flows in this state are characterized by large values of energy that is concentrated in the largest scales with
 $k_{z}=0$
. The evolution of the total energy and of the 2D3C component of the energy for the run with
 $\mathit{Ro}_{F}=0.25$
and
 $\mathit{Re}_{F}=500$
is shown in figure 10(a). After a short time (
 $t<100$
) during which the energy appears to saturate at a value close to unity the 2D3C flow starts to grow linearly until saturation is reached at very large values of energy. The non-2D3C part of the energy that consist of the energy of the inertial waves and the forced modes comprises only a small part of the energy. This behaviour was observed for all runs that showed a quasi-2D condensate behaviour.
The saturation amplitude is much larger than unity. Figure 10(b) shows the saturation level of the
 $U^{2}=\langle \langle \boldsymbol{u}\boldsymbol{\cdot }\boldsymbol{u}\rangle _{V}\rangle _{T}$
as a function of the Rossby
 $\mathit{Ro}_{F}$
for a fixed value of the Reynolds number
 $\mathit{Re}_{F}=333$
. Here
 $U^{2}$
varies discontinuously as
 $\mathit{Ro}_{F}$
is increased, both at the critical value that it transitions from isotropic turbulence to the condensate state at
 $\mathit{Ro}_{F}=0.39$
and at the critical value that it transitions from the condensate state to the intermittent bursts behaviour at
 $\mathit{Ro}_{F}=0.22$
. Thus, the transition from the isotropic turbulent state to this condensate state is found to be subcritical.
(a) The evolution of the total energy and of the 2D3C component of the energy for the run with
 $\mathit{Ro}_{F}=0.25$
and
 $\mathit{Re}_{F}=500$
. (b) The saturation level of the
 $U^{2}$
as a function of the Rossby
 $\mathit{Ro}_{F}$
for a fixed value of the Reynolds number
 $\mathit{Re}_{F}=333$
.

The quasi-2D3C behaviour of the flow can also be seen by looking at the energy spectra. In figure 11 we show the 2D energy spectrum
 $E_{2D}(k_{z},k_{\bot })$
(a) and the 1D energy spectrum
 $E_{1D}$
(b) compensated by
 $k^{5/3}$
defined as
 $$\begin{eqnarray}E_{2D}(k_{z},k_{\bot })=\mathop{\sum }_{k_{z}\leqslant p_{z}<k_{z}+1\atop k_{\bot }\leqslant p_{\bot }<k_{\bot }+1}|\boldsymbol{u}_{\boldsymbol{p}}|^{2},\quad E_{1D}(k)=\mathop{\sum }_{k\leqslant |\boldsymbol{p}|<k+1}|\boldsymbol{u}_{\boldsymbol{p}}|^{2}\end{eqnarray}$$
of the run with
 $\mathit{Ro}_{F}=0.20$
and
 $\mathit{Re}_{F}=2000$
that corresponds to the run with the largest
 $\mathit{Re}_{F}$
and smallest
 $\mathit{Ro}_{F}$
that displayed the quasi-2D3C condensate behaviour. The square in 11(a) indicates the location of the forcing. The dashed lines indicate the location of the circles
 $k_{z}^{2}+k_{\bot }^{2}=10,20,40,80$
. An isotropic spectrum would be constant along these lines. In the large scales the
 $k_{z}=0$
modes have significantly larger amplitude and energy is concentrated in
 $k_{\bot }=\sqrt{2}$
. The small scales appear more isotropic with the exception of the
 $k_{z}\gg k_{\bot }$
modes that appear to be quenched and deviate stronger from isotropy. The dominance of the large-scale modes can be observed in the 1D energy spectrum. A large amount of energy is concentrated at small wavenumbers followed by a steep drop. The small scales on the other hand display a power-law behaviour with an index slightly smaller than the Kolmogorov prediction
 $-5/3$
, and much bigger than the wave turbulence prediction
 $-5/2$
. The inset in 11(b) shows the time-averaged energy flux with the dark solid line, while the grey lines show the instantaneous energy flux. The flux is positive (forward) and almost constant for the wavenumbers
 $\boldsymbol{k}$
in the range
 $\sqrt{3}q<|\boldsymbol{k}|\lesssim 30$
, while it is slightly negative for the small wavenumbers (
 $|\boldsymbol{k}|<\sqrt{3}q$
), but with large fluctuations of both signs. It is expected that at even higher values of
 $\mathit{Re}_{F}$
the isotropic Kolmogorov spectrum will be even better established in the small scales.
The 2D energy spectrum
 $E_{2D}(k_{z},k_{\bot })$
(a) and the 1D energy spectrum
 $E_{1D}$
(b). The inset shows the time-averaged energy flux with the dark solid line, while the grey lines show the instantaneous energy flux.

A visualization of the flow in the condensate state is depicted in figure 12 where the
 $z$
-component of the vorticity is shown. Figure 12(a) shows the computational box viewed from the top, while the same result is shown viewed from the side in figure 12(b) where the opacity has been reduced so that the structures inside the computational box can be seen. The blue color indicates that vorticity is parallel to the rotation (the flow corotates) while the red color indicates that the vorticity is antiparallel to the rotation. Clearly both large and small scales coexist in the flow. A large-scale, 2D corotating columnar structure can be seen. Opposite to this columnar structure a second columnar structure rotating in the opposite direction can be seen. This second structure (best seen in figure 12(b)) is fluctuating strongly having more small scales. The persistence of corotating structures in rotating turbulence has been observed in experiments (Hopfinger et al.
Reference Hopfinger, Gagne and Browand1982; Morize et al.
Reference Morize, Moisy and Rabaud2005; Gallet et al.
Reference Gallet, Campagne, Cortet and Moisy2014) and has been discussed in various works (Hopfinger & van Heijst Reference Hopfinger and van Heijst1993; Bartello et al.
Reference Bartello, Metais and Lesieur1994; Gence & Frick Reference Gence and Frick2001; Sreenivasan & Davidson Reference Sreenivasan and Davidson2008; Staplehurst et al.
Reference Staplehurst, Davidson and Dalziel2008; Gallet et al.
Reference Gallet, Campagne, Cortet and Moisy2014). Perhaps it is not surprising that structures with vorticity anti-aligned to rotation are more responsive to 3D perturbations. Following Bartello et al. (Reference Bartello, Metais and Lesieur1994) the local Rossby number
 $\mathit{Ro}_{loc}(\boldsymbol{x})$
(defined by the local rotation rate
 $2{\it\Omega}_{local}=2{\it\bf\Omega}+\boldsymbol{w}(\boldsymbol{x},t)$
) will be increased and thus are less likely to show a quasi-2D3C behaviour.
A visualization of the flow where the
 $z$
-component of the vorticity is shown. (a) The computational box viewed from the top and (b) the same flow shown viewed from the side where the opacity has been reduced so that the structures inside the computational box can be seen.

With this observation one can easily understand how saturation is reached in the large scales. The fast rotation leads to a quasi-two-dimensionalization of the system that leads to an inverse cascade of energy. As energy of the 2D3C part of the flow increases it reaches the largest scale of the system where it forms two counter-rotating vortexes. As the amplitude of these two vortices is increased a point is reached that the vertical vorticity of the counter-rotating vortex will cancel the effect of rotation locally when an order-one value of the local Rossby number is reached. Then the Taylor–Proudman constrain that leads to quasi-2D flows, the inverse cascade and the pile-up of energy to the large scales is broken and energy starts to flow back to the small scales. Such a mechanism of course implies that saturation is reached when the eddy turnover time of the condensate is the same order with the rotation period or more simply
 $\mathit{Ro}_{U}\sim 1$
. Indeed in figure 13 we plot
 $\mathit{Ro}_{U}$
from all of the runs that showed a condensate behaviour as a function of
 $\mathit{Ro}_{F}$
(figure 13
a) and as a function of
 $\mathit{Re}_{F}$
(figure 13
a). The value of
 $\mathit{Ro}_{U}$
appears to be independent of both
 $\mathit{Ro}_{F}$
and
 $\mathit{Re}_{F}$
, thus the scaling
 $\mathit{Ro}_{U}\sim 1$
is verified. This result implies that this state is unlikely to be described by an
 $\mathit{Ro}_{U}\rightarrow 0$
expansion as the eddy turnover time is the same order as the rotation period. It also implies that condensates saturate by reaching a state of marginal inverse cascade (Seshasayanan, Benavides & Alexakis Reference Seshasayanan, Benavides and Alexakis2014).
Plots of
 $\mathit{Ro}_{U}$
as a function of
 $\mathit{Ro}_{F}$
(a) and
 $\mathit{Re}_{F}$
(b) for all of the runs that lead to a quasi-2D condensate. The
 $\mathit{Ro}_{U}=1$
behaviour shown here can also be seen in figure 2(a).

6. Large
$\mathit{Re}_{F}$
, small
$\mathit{Ro}_{F}$
asymptotic behaviour of turbulence


The results so far have shown that different behaviours are present for large
 $\mathit{Re}_{F}$
and small
 $\mathit{Ro}_{F}$
depending on the ordering of these parameters. It is thus also expected that the basic energy balance relations that link the forcing amplitude and the velocity amplitude with the energy injection/dissipation rate will differ for the different states of the system. Knowledge of the relation of these quantities allows the map between the control parameter pairs
 $(\mathit{Ro}_{F},\mathit{Re}_{F})$
,
 $(\mathit{Ro}_{U},\mathit{Re}_{U})$
and
 $(\mathit{Ro}_{D},\mathit{Re}_{D})$
to be determined.
In non-rotating turbulence in the high
 $\mathit{Re}_{F}$
limit it is expected that the role of viscosity is unimportant in the large scales. With this assumption the relation between the forcing amplitude, the velocity fluctuations amplitude
 $U$
and the energy dissipation rate can be derived by dimensional analysis. It results in the following two relations:
 $$\begin{eqnarray}U\propto C_{U}^{T},\quad {\it\epsilon}\propto C_{D}^{T}U^{3}q,\end{eqnarray}$$
where the proportionality coefficients
 $C_{U}^{T},C_{D}^{T}$
are order-one numbers. (Here we remind the reader that
 $U$
stands for the root-mean-square velocity non-dimensionalized by
 $\sqrt{F_{0}L}$
. Thus, the first part of (6.1) simply implies the dimensional velocity amplitude is proportional to
 $\sqrt{F_{0}L}$
.) In the other limit for which
 $\mathit{Re}_{F}$
is very small, then the nonlinearity can be neglected and obtain the laminar scaling
 $$\begin{eqnarray}U\propto C_{U}^{^{L}}\mathit{Re}_{F}q^{-2},\quad {\it\epsilon}\propto C_{U}^{^{L}}\mathit{Re}_{U}^{-1}U^{3}q\propto \mathit{Re}_{F}^{-1}q^{-2}\end{eqnarray}$$
by balancing the forcing with the viscous term. These scalings are expected to be also valid for weakly rotating flows
 $\mathit{Ro}_{F}\gg 1$
where the effect of rotation can be neglected.
For
 $\mathit{Ro}_{F}\lesssim 1$
however the rotation cannot be neglected and this makes the energy balance relations for the high
 $\mathit{Re}_{F}$
limit less straightforward. The increase in complexity stems from the fact that, first, even if
 $\mathit{Re}_{F}$
is large we cannot conclude independence on the viscosity without also specifying the value of
 $\mathit{Ro}_{F}$
. This limitation exists because in general rotation diminishes the energy cascade, thus for any value of
 $\mathit{Re}_{U}$
there would exist a value of
 $\mathit{Ro}_{U}$
small enough so that energy cascade flux is comparable to the dissipation. Second even if viscosity is neglected in the large
 $\mathit{Re}_{F}$
limit, we are still left with one non-dimensional parameter, the Rossby number, making the derivation of scaling laws by simple dimensional analysis require further physically motivated arguments.
For the TG flow we have already shown that the flow is guaranteed to be laminar when the relations (4.8) and (4.9) hold. Thus, in this range the desired relations can be obtained directly from the laminar solutions that for
 $\mathit{Ro}_{F}\ll 1$
and
 $\mathit{Re}_{F}\propto \mathit{Ro}_{F}^{-1}$
become
 $$\begin{eqnarray}U\simeq \sqrt{3}\mathit{Ro}_{F},\quad {\it\epsilon}\simeq 3q^{2}U^{3}\mathit{Re}_{U}^{-1}\simeq 9q^{2}\mathit{Ro}_{F}^{2}/\mathit{Re}_{F}.\end{eqnarray}$$
For large
 $\mathit{Re}_{F}$
and fast rotation rate wave–turbulence arguments based on three wave interactions (see Chapter 3 of Nazarenko Reference Nazarenko2011) suggest that energy cascade rate to the small scales will be decreased by a factor
 $\mathit{Ro}_{U}$
. This reasoning leads to the relations
 $$\begin{eqnarray}U\propto C_{U}^{^{WT}}\mathit{Ro}_{F},\quad {\it\epsilon}\propto C_{D}^{^{WT}}\mathit{Ro}_{U}U^{3}q\end{eqnarray}$$
will hold. The first relation comes from a balance of the Coriolis term in the Navier–Stokes equation with the forcing while the second relation is a weak turbulence estimate that is derived assuming an ensemble of random travelling waves whose fast decorrelation time leads to the reduction in the energy cascade rate by a factor proportional to their inverse speed (here
 $\mathit{Ro}_{F}$
). These arguments however assume uniform and isotropic forcing and do not take into account the formation of condensates. Thus, are not necessarily expected to hold for a structured forcing such as the TG.
Plots of (a)
 $U^{2}$
and (b)
 ${\it\epsilon}$
as a function of
 $\mathit{Ro}_{F}$
for all runs. Same symbols, colours and sizes are used as in figure 1.

In figure 14 we plot the basic quantities
 $U^{2}$
(figure 14
a) and
 ${\it\epsilon}$
(figure 14
b) as a function of
 $\mathit{Ro}_{F}$
. We remind the reader that the same symbols were used as in figure 1, thus large symbols imply larger
 $\mathit{Re}_{F}$
while dark (violet online) symbols imply small
 $\mathit{Ro}_{F}$
. Clearly different phases in the flow follow different scaling laws. For large
 $\mathit{Ro}_{F}$
the effect of rotation is not felt and thus the turbulent scaling (6.1) is recovered with both
 $U^{2}$
and
 ${\it\epsilon}$
being independent from
 $\mathit{Ro}_{F}\geqslant 1$
and independent from
 $\mathit{Re}_{F}$
for sufficiently large
 $\mathit{Re}_{F}$
. As
 $\mathit{Ro}_{F}$
is decreased, different behaviours are observed. The laminar runs reproduce the relation (6.3) with a clear scaling
 $U^{2}\propto \mathit{Ro}_{F}^{2}$
. Since most of the laminar states examined are close to the stability boundary
 $\mathit{Ro}_{F}\propto \mathit{Re}_{F}^{-1}$
, the
 ${\it\epsilon}\propto \mathit{Ro}_{F}^{2}/\mathit{Re}_{F}$
scaling appears as
 ${\it\epsilon}\propto \mathit{Ro}_{F}^{3}$
. Note that
 ${\it\epsilon}\propto \mathit{Ro}_{F}^{3}$
is not a true scaling for the laminar flows. It originates from a bias in the choice of runs. Such biases are commonly met in numerical simulations where computational costs put strong restrictions, and sometimes are misinterpreted as physical scaling laws. This however provides only an upper limit for the dissipation of the laminar states. The quasi-2D condensate states result in the scaling
 $U^{2}\propto \mathit{Ro}_{F}^{-2}$
in accordance with the results shown in figure 13. Note also the discontinuous change in
 $U^{2}$
that is a direct result of the subcritical behaviour of the condensate modes. The energy dissipation rate for these runs decreases initially as
 $\mathit{Ro}_{F}$
is decreased but then it seems to saturate at the smallest values of
 $\mathit{Ro}_{F}$
attained. This however will need to be verified at smaller
 $\mathit{Ro}_{F}$
. A similar behaviour is also observed for the runs that displayed a bursting behaviour. The scaling
 $U^{2}\propto \mathit{Ro}_{F}^{-2}$
and
 ${\it\epsilon}\propto \mathit{Ro}_{F}^{0}$
is also observed for these modes for some range of
 $\mathit{Ro}_{F}$
. This behaviour however transitions to a laminar behaviour at even smaller
 $\mathit{Ro}_{F}$
probably because not large enough
 $\mathit{Re}_{F}$
has been reached for these runs.
Plots of
 ${\it\epsilon}L/U^{3}$
as a function of (a)
 $\mathit{Re}_{U}$
and (b)
 $\mathit{Ro}_{U}$
for all runs. Same symbols, colours and sizes are used as in figure 1.

This section is concluded by discussing the properties of the energy dissipation rate as a function of the more commonly used control parameters
 $\mathit{Re}_{U}$
and
 $\mathit{Ro}_{U}$
. Figure 15 displays
 ${\it\epsilon}L/U^{3}$
as a function of
 $\mathit{Re}_{U}$
(figure 15
a) and
 $\mathit{Ro}_{U}$
(figure 15
b). Figure 15(b) serves mostly to demonstrate that although some of the data points are grouped together in figure 15(a) they correspond to different processes as can be realized by the different values of
 $\mathit{Ro}_{U}$
they occupy in the parameter space. The ratio
 ${\it\epsilon}L/U^{3}$
for non-rotating turbulence based on (6.1) is expected to scale like
 $\mathit{Re}_{U}^{-1}$
for small values of
 $\mathit{Re}_{U}$
while an asymptotic value (independent of
 $\mathit{Re}_{U}$
) is expected to be reached at large enough
 $\mathit{Re}_{U}$
. Reaching this asymptotic value indicates that the system has reached a turbulent state for which large-scale properties do not depend on viscosity and energy injection is balanced only by the energy flux to the small scales due to the nonlinearity (Kaneda et al.
Reference Kaneda, Ishihara, Yokokawa, Itakura and Uno2003). Indeed such a state is reached for our weakly rotating runs for
 $\mathit{Re}_{U}\gtrsim 800$
and
 $\mathit{Ro}_{F}\geqslant 0.4$
(i.e. diamond runs). For the fast rotating runs however (including both bursts and condensates) such a state is not reached and the ratio
 ${\it\epsilon}L/U^{3}$
continues to decrease as
 $\mathit{Re}_{U}^{-1}$
even at
 $\mathit{Re}_{U}\sim 10^{4}$
. For these states most of the energy (and vorticity) is concentrated in a few large-scale modes and thus they have a laminar scaling. However, since the saturation amplitude at the large scale is viscosity-independent but depends only on
 ${\it\Omega}$
, it is expected that at even larger
 $\mathit{Re}_{U}$
the vorticity at small scales will grow enough so that despite the large energy concentration in the large-scale modes, vorticity will be dominated by the small scales and not the large and a viscosity-free scaling will be obtained. This can be explained best by looking at the 1D energy spectrum in figure 11(b). As
 $\mathit{Re}_{F}$
is increased the amplitude of energy in the large scales will remain fixed (so that
 $\mathit{Ro}_{U}=1$
) but the large-wavenumber viscous cutoff
 $k_{c}$
will extend to larger wavenumbers. Since the spectrum is sufficiently flat (less flat than
 $k^{-3}$
) at large
 $\mathit{Re}_{F}$
the dissipation (
 $\propto \mathit{Re}_{F}^{-1}\int k^{2}E_{1D}\text{d}k$
) will be dominated by the small scales provided that
 $k_{c}$
is sufficiently large. Thus, a viscosity-independent scaling is expected to be obtained in the
 $\mathit{Re}_{F}\rightarrow \infty$
limit. To demonstrate this, however, would require resolutions not attainable in the present study.
7. Summary and conclusions
Perhaps the most intriguing result of the present work is the demonstration that a simple two-parameter system like the one under study here can display such richness and complexity of behaviour. Depending on the location in the parameter space the system can display laminar behaviour, intermittent bursts, quasi-2D condensate states, and weakly rotating turbulence. All of these behaviours can be obtained in the
 $\mathit{Re}_{F}\rightarrow \infty$
limit provided that the appropriate scaling of
 $\mathit{Ro}_{F}$
with
 $\mathit{Re}_{F}$
is considered.
For high rotation rates laminar solutions can be found in terms of an asymptotic expansion. Up to the ordering
 $\mathit{Ro}_{F}\propto \mathit{Re}_{F}^{-1/3}$
the laminar solution has no zeroth-order projection to the 2D3C flows. For
 $\mathit{Ro}_{F}\propto \mathit{Re}_{F}^{-1/5}$
the flow has an order-one projection to 2D3C flows and for even larger values of
 $\mathit{Re}_{F}$
no laminar solution that can be captured by the expansion exists. The realizability of the laminar flows is determined by their stability properties.
When
 $\mathit{Re}_{F}$
is increased and the conditions for stability are violated the system transitions subcritically to a time-dependent flow that exhibits intermittent bursts. The unstable modes involved can be predicted by an asymptotic theory, that takes into account exact resonances and is valid in the limit
 $\mathit{Ro}_{F}\rightarrow 0$
. The existence of exact resonances at the first order of the expansion that can drive the system unstable implies that the linear instability boundary is along the
 $\mathit{Ro}_{F}\propto \mathit{Re}_{F}^{-1}$
line. These modes drive the system on the dynamical timescale to high levels of energy where the asymptotic expansion fails and the resonance conditions are violated. After the burst the remaining energy is concentrated in a 2D3C flow that condensates in the largest available scale and decays on the viscous timescale. These bursts can be described by a low-dimensional dynamical system, and thus do not describe a truly turbulent state.
As
 $\mathit{Re}_{F}$
is increased with respect to
 $\mathit{Ro}_{F}^{-1}$
and a relation
 $\mathit{Ro}_{F}\leqslant c\mathit{Re}_{F}^{-{\it\alpha}}$
is satisfied the system transitions again subcritically to a quasi-2D condensate. This state represents the rotating turbulence regime for the TG flow as that obtained in the limit
 $\mathit{Re}_{F}\rightarrow \infty$
for any value of
 $\mathit{Ro}_{F}\leqslant 0.4$
. The flow at this state is composed of a quasi-2D condensate of vertical vorticity at the large scales and only weakly anisotropic small-scale turbulence. Saturation of the large-scale condensate comes from reaching values of
 $\mathit{Ro}_{U}=1$
at which point the counter-rotating vortex from the pair of vortices that formed becomes unstable and cascades the energy to the small scales. The value of the exponent
 ${\it\alpha}$
is either
 $1/3$
or
 $1/5$
. If energy injection is achieved by the coupling of inertial waves at second order, then
 ${\it\alpha}=1/3$
. If not, then at third order it has already been shown that the forcing alone is capable of injecting energy into the flow and
 ${\it\alpha}=1/5$
. The numerical simulations give more support to the scaling
 $\mathit{Ro}_{F}^{-1}\propto \mathit{Re}_{F}^{1/3}$
without however being decisive. Finally, the energy dissipation rate has not reached the viscosity-independent scaling in this regime due to the large amplitude of the condensates, but it is expected to be reached at higher values of
 $\mathit{Re}_{F}$
.
From these results there are a few points that are worth pointing out. First of all the first-order expansion fails to describe the evolution of the 2D3C part of the flow. The small
 $\mathit{Ro}_{F}$
expansion that predicts independence of the 2D3C part of the flow cannot predict the increase of the 2D3C flow that was observed both during the intermittent bursts stage and during to the quasi-2D state. Thus, to describe the flow higher terms in the expansion need to be kept.
It was also found that for any value of the parameters examined (
 $\mathit{Re}_{F},\mathit{Ro}_{F}$
) a phase that could be described as weak wave turbulence was not met. Fast rotating flows were either dominated by condensates or intermittent bursts. Possibly this is the case because only the value
 $q=2$
was used. For larger values of
 $q$
both the number of exact resonances and quasi-resonances would increase and the system would come closer to a continuous Fourier space where the assumptions of the weak-wave-turbulence theory better hold. Another effect that increasing
 $q$
will have is to allow more ‘space’ for an inverse cascade to develop. This effect could also alter some of the observed scalings of the present work. Signs of an inverse cascade can be seen in the spectrum and the flux of the quasi-2D condensates states (see figure 11) but clearly there is not enough scale separation to make any precise statement. It is noted that weak-wave-turbulence theory in unbounded domains does not predict an inverse cascade. In domains confined in the direction of rotation however the 2D3C modes contain finite energy and being decoupled from the wave modes they follow the 2D Navier–Stokes equation and lead to an inverse cascade. Confined wave turbulence has recently been studied by Scott (Reference Scott2014) where the independence of the 2D3C modes has been demonstrated. The presence of the inverse cascade thus strictly depends in the order that the limits
 $q\rightarrow \infty$
,
 $\mathit{Re}_{F}\rightarrow \infty$
,
 $\mathit{Ro}_{F}\rightarrow 0$
are taken. Taking first the limit
 $q\rightarrow \infty$
corresponds to the unbounded weak-wave-turbulence result, while taking first the
 $\mathit{Ro}_{F}\rightarrow 0$
limit results in quasi-2D behaviour and inverse cascade. Computational costs did not allow to investigate in this work all three limits and the investigation was limited to only fixed values of
 $q$
.
A property of the turbulent quasi-2D flows was the formation of condensates that reduced all flows to
 $\mathit{Ro}_{U}=1$
. This property is expected to persist even in the case that there is enough scale separation for an inverse cascade to develop, since there is no other mechanism to saturate the inverse cascade. This last point raises an interesting aspect for systems with inverse cascade in general. In the absence of a large-scale dissipative mechanisms, the need to saturate the inverse cascade will drive the system to marginality of the inverse cascade by reaching in the present case
 $\mathit{Ro}_{U}=1$
. At this state there is a very weak inverse energy transfer just sufficient to sustain the large-scale flow against viscosity. Aspects of such marginal states of inverse cascades have been recently investigated in more simplified models (Seshasayanan et al.
Reference Seshasayanan, Benavides and Alexakis2014).
A further point worth pointing out in the present work is that referring to the large-Reynolds–small-Rossby-number limit without specifically prescribing the limiting procedure is meaningless, since different behaviours can be obtained for different scaling of the Reynolds number with the Rossby number. Different ordering of
 $\mathit{Re}_{F}$
with
 $\mathit{Ro}_{F}$
leads to different behaviours and scalings. Also the velocity amplitude used in the definition of the Reynolds and Rossby number is more than just a conventional formality in rotating turbulence. Thus, one needs to be precise on the definitions used and the limiting procedure considered. From the present results the
 $\mathit{Ro}_{D},\mathit{Re}_{D}$
were shown to best describe the level of turbulence with respect to the rotation rate and the viscosity.
Finally, it is pointed out the necessity of numerical studies to cover systematically the parameter space in order to draw any general conclusions.
Acknowledgements
I would like to thank M. Schrinner for motivating this work, as the initial steps were thoroughly discussed with him. I would also like to thank the members of the Nonlinear Physics Group at LPS/ENS for their very useful comments. The present work benefited from the computational support of the HPC resources of GENCI-TGCC-CURIE & GENCI-CINES-JADE (project numbers x2014056421, x2013056421 and 2012026421) and MesoPSL financed by the Region Ile de France and the project EquipMeso (reference ANR-10-EQPX-29-01) where the present numerical simulations have been performed in the last three years.