I. INTRODUCTION
Micro(nano)electromechanical systems [M(N)EMS] belong to a rapidly expanding field of semiconductor fabrication technologies for producing micro- and nanoscale mechanical, electric, optical, fluidic, and other devices.Reference Elwenspoek and Jansen1 The submicron structures typically found in microelectronics components can only be economically produced using different plasma processes.Reference Ostrikov2–Reference Mariotti and Sankaran5 The nonequilibrium generation of reactants by plasmas enables the selective etching, deposition, implantation, removal, and cleaning of materialsReference Akbulut and Inal6, Reference Zhang, Yoon and Yu7 and surfaces required to fabricate microelectronics devices.Reference Lieberman and Lichtenberg8–Reference Ehiasarian, Andersson and Anders11 Scaling down of device feature sizes together with increased complexity requiring a number of interconnect layers has brought out the need to develop plasma processes able to etch small features with very high aspect ratio (10–100).Reference Kiihamaki12, Reference Wang, Zeng, Lu, Russo and Eisenbraun13
Standard reactive ion etching (RIE) of Si is widely used in the Integrated Circuits (IC) industry. It utilizes a synergistic balance of chemical etching and physical etching to produce Si trenches and structures with aspect ratios on the order of 5:1.Reference Yunkin, Fischer and Voges14 However, MEMS devices may require extremely tall structures or extremely deep trenches. Standard RIE is incapable of meeting this requirement. The group of processes used to create deep trenches or high-aspect-ratio structures are called deep RIE (DRIE).Reference Fu, Colli, Fasoli, Luo, Flewitt, Ferrari and Milne15 Two leading technologies for high-rate DRIE are Bosch process and cryogenic process; although, the Bosch process is the only recognized production technique.Reference Cherukov, Grigoras, Peltonen, Franssila and Tottonen16, Reference Bakhtazad, Huo and Sabarinathan17
The Bosch process consists of multiple cycles of alternating etches and depositions, advancing the trenches formed in small increments until the desired aspect ratio is reached.Reference Roxhed, Griss and Stemme18, Reference Abdolvand and Ayazi19 Each phase lasts several seconds. The deposition serves to protect the sidewalls during etching step, which causes the trench bottom to be selectively etched to extend the aspect ratio. During the etching phase, the directional ions that bombard the substrate attack the passivation layer at the bottom of the trench (but not along the sides). They collide with it and sputter it off, exposing the substrate to the chemical etchant. These etching/deposition steps are repeated many times over resulting in a large number of very small etching steps taking place only at the bottom of the etched pits. The cycle time can be adjusted: short cycles yield smoother walls and long cycles yield a higher etch rate. The Bosch process has an overall deep anisotropic profile, although each individual etch step may be more or less isotropic depending on the process conditions.Reference Lindroos, Tilli, Lehto and Matooka20
The inherently multiphysical and multidisciplinary design of M(N)EMS devices requires new design methodologies including the integration of modeling, design, and simulations. Since the quality of Bosch process strongly affects the device’s performance, control and prediction of various parameters that characterize the process are very important. Several simulators have been developed and applied to the Bosch process in the past. A two-dimensional (2D) simulator using a string-cell hybrid method for tracking surface evolution with simplified model for the particle transport was developed by Zhou et al.Reference Zhou, Zhang, Hao and Wang21 Etching was modeled assuming constant etching rate and a perfect conformal deposition for the passivation cycle. Our approach is similar in spirit with this concept. Another 2D simulations where the particle fluxes on the profile surface are calculated using conventional integral methods are published in Ref. Reference Hössinger, Djurić and Babayan22 Recently, some three-dimensional (3D) simulations of the Bosch processes have been reported.Reference Kokkoris, Tserepi, Boidouvis and Gogolides23 Later on, the most comprehensive 3D Bosch process simulations have been carried out.Reference Ertl and Selberherr24 Monte Carlo method, accelerated by ray tracing algorithms, is used to calculate local particle fluxes and etching and deposition rates. This is computationally the most demanding part of the simulation. Advanced level set technique is then applied to describe the movement of the profile surfaces have been carried out.
Here we present a simplified 3D model of the Bosch process with the aim to provide the tool that can be used to optimize process parameters by means of computer simulations. The article is organized as follows: in Section II the essence of the model is described. Also, some elements of the level set method are shortly reviewed. Section III contains simulation results illustrating the application of the Bosch process. Finally, based on the obtained results, some conclusion will be given.
II. BOSCH PROCESS MODEL
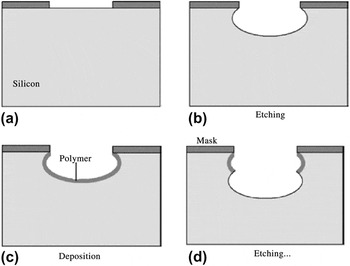
As already pointed out, the Bosch process consists of multiple cycles of alternating etches and depositions, advancing the trenches formed in small increments until the desired aspect ratio is reached. The basic principle of a Bosch process is shown in Fig. 1. In the Bosch process, superposition of physical (directional) and chemical (isotropic) etching is used. This leads to a faster removal of the passivation layer at the bottom of the trench compared to the sidewalls due to the additional sputtering by the directional ions.
Schematic illustration of the Bosch process (see, for example, Ref. Reference Zhou, Zhang, Hao and Wang21). (a) Opening of etch mask layer for Bosch deep reactive ion etching. (b) Isotropic–anisotropic etching of silicon substrate. (c) Isotropic polymer formation. (d) Etching of silicon and polymer.

After uncovering the substrate at the bottom, depending on plasma conditions, chemical or anisotropic etching can be dominant. Hence, in each cycle, an etching process is initiated at the bottom of the trench. In each cycle, a chemically inert polymer layer is uniformly deposited using fluorocarbon gases. This passivation layer prevents the sidewalls from being attacked in the subsequent etching step. After many iterations, profiles with high aspect ratios can be obtained. The Bosch process thus has an overall deep anisotropic profile, although each individual etch step may be more or less isotropic depending on the process conditions.
To study the time evolution of the profile during the Bosch process, we built the following model. Every Bosch cycle is divided into two steps: etching and deposition, lasting t etch and t dep, respectively. Etching of polymers and silicon is modeled by an isotropic etch rate superposed by additional directional term attributed to anisotropic etch process:


where θ is the angle between the surface normal and the direction of the incoming particles and subscripts Si and P refer to the silicon and polymer, respectively.
For the passivation step, a perfect conformal deposition is assumed, meaning a constant surface velocity  . Thickness of the polymer (TP) can be estimated from the rate V dep and time of the deposition t dep : TP = V dep ⋅ t dep.
If the vertical coordinate is denoted by z, then z = Z pb will represent the height of the profile bottom. This value is recalculated after each process cycle as a part of the profile surface generation. In the next cycle, for z ≥ Z pb, above the profile bottom, the etching rate is determined by:

Equation (3) means that the polymer layer will be etched (with the polymer etching rate) first. After that, the silicon substrate is etched isotropically. It seems reasonable to suppose that there is no anisotropic etching above the profile bottom.
For z < Z pb, below the profile bottom, etching rate is given by:

In accordance with Eq. (4), the etching of the passivation layer, in this case both isotropically and anisotropically, is followed by the etching of silicon. At t etch, etching stops and passivation step begins and last until t etch + t dep.
For optimal processing, the passivation and etching cycle times must be balanced. If the deposited passivation layer is too thin, the process time for the etching cycle must be smaller to avoid the corrosion of the sidewalls, increasing the number of required iterations. If the layer is too thick, the etching duration must be increased, resulting in a longer total process time. The choice of the process times also has an influence on the undulation of the sidewalls caused by the two-phase procedure. Computer simulations enable us to study parameter variations to optimize the process.
Beside simplicity, the proposed model offers other advantages. First, etching rates are the model input parameters leading to significantly speedup the calculations, since determination of the etching rates by Monte Carlo or any other technique is very time consuming. For example, although simulation results published in Ref. Reference Ertl and Selberherr24 were obtained on eight cores of AMD Opteron 222 processor (Advanced Micro Devices, Sunnyvale, CA), their computations took several days. Our model reduces computational time for one set of parameters to several tens of minutes. All parameters included in the model have transparent physical meaning. The model is also applicable for predicting the feature profile characteristics of the complex structure etching, also. Furthermore, variation of the process parameters provides us with clear insight of their influence on the final profile.
III. LEVEL SET METHOD
With known local velocities, several methods can be used to follow surface evolution. In this study, we use the level set method. In the level set method, the surface of interest at a certain time t is considered as the zero level set (with respect to the space variables) of the level set function ϕ(t, x).Reference Sethian25 The evolution of the surface in time is caused by “forces” or fluxes of particles reaching the surface. The velocity function R(t, x) represents the velocity of the point on the surface normal to the surface and depends on the time and space variables and is defined on the whole simulation domain. For the points on the surface, this function is determined by physical models of the ongoing processes. At a later time t >0, the surface is defined as a set of points {x ∈ ℛn | ϕ(t, x) = 0}, leading to the level set equation:

This equation links the time change to the gradient via the velocity function. In the numerical implementation procedure, the level set function is represented by its values on grid nodes and the current surface must be extracted from this grid, while a suitable initial function ϕ(0, x) has to be defined first. As already stated, the values of the velocity function depend on the physical models. In the actual numerical implementation, spatial derivatives of ϕ are represented using the Engquist-Osher upwind finite difference scheme. The resulting semidiscrete equations can be solved using explicit Euler method.
Several approaches for solving level set equations exist, which increase accuracy while decreasing computational effort. They are all based on using some sort of adaptive schemes. The most important are narrow band level set method, widely used in etching process modeling toolsReference Sethian and Adalsteinsson26, Reference Sethian27 and recently developed sparse-field method,Reference Whitaker28 implemented in medical image processing Insight Segmentation and Registration Toolkit (ITK) library.29 The sparse-field method is based on an approximation to the distance function that makes it feasible to recompute the neighborhood of the zero level set at each time step. In that way, it involves the narrow band strategy to the extreme computing updates on a band of grid points that is only one point wide. The width of the neighborhood is such that derivatives for the next time step can be calculated. Such approach has several advantages. The algorithm does precisely the number of calculation needed to compute the next position of the zero level set surface.Reference Radjenović, Lee and Radmilović-Radjenović30
IV. RESULTS AND DISCUSSION
The actual shapes of the initial surfaces, for the examples considered here, are described using simple geometrical abstractions. In the beginning of the calculations, these descriptions are transformed into the initial level set functions using the fast marching method.Reference Sethian27 If the initial profile is defined with a bitmap mask, a special routine is used to generate corresponding initial level set function starting from the mask file. Our implementation is based on ITK library.29 All the calculations were carried out on 128 × 128 × 584 rectangular grid. The process parameters in our calculations are quite artificial and are not related to the particular conditions of any plasma reactor. Instead, they are chosen just to illustrate some characteristic points of our model. Connecting of the model parameters with some concrete plasma reactors will require some sort of calibration in the sense it is described in Ref. Reference Zhou, Zhang, Hao and Wang21 By calibration, we mean the determination of the model parameters in accordance with the experimental results. The parameters used in actual calculations are listed in the figure captions.
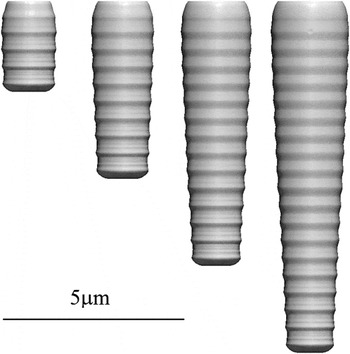
One of the most common applications of the Bosch process is creation of the high-aspect-ratio cylindrical holes and such an example is shown in Fig. 2. The profiles are captured after 5, 10, 15, and 20 Bosh steps (etching+deposition), respectively. The process parameters are chosen in such a way to obtain deep hole with regular vertical walls with minimal positive tapering. Amplitude of the sidewall scalloping is proportional to the ratio of the isotropic and anisotropic components of the etching rates. The higher isotropic components lead to higher profile ripples. On the other hand, the amplitudes of the profile ripples could be reduced by decreasing the duration and increasing the number of the process steps. First, we can say that the profile evolution with time is as expected (see, for example, Fig. 8 in Ref. Reference Ertl and Selberherr24). Although the only reliable method to verify the obtained results is to compare them with the experimental results or with the predictions of some other proven similar simulations of other authors, here we, because the lack of both, shall present some estimates based on chosen model parameters and the dimension changes that can be observed in Fig. 2. The initial radius of the circular aperture is r 0 = 0.6 μm, while the maximal radius after 20 steps is r max = 1.1 μm due to mask undercutting, meaning that the widening of the aperture is Δr = 0.5 μm. This value can be estimated from the model parameters using formula

Feature profiles in the case of circular aperture mask with radius of 0.6 μm after 5, 10, 15, and 20 Bosch steps. (V dep = 10 nm/s,  6 nm/s,
 5.47 nm/s,
 13.5 nm/s,
 59.1 nm/s, t dep = 6 s, and t etch = 12 s.)

Similarly, Fig. 2 shows that the etching depth after 20 steps is D = 9.74 μm. The corresponding estimation formula is
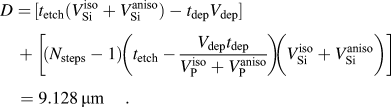
Although the agreement is not perfect, it should be considered as satisfactory, taking into account very complex numerical procedure involved in 3D sparse-field level set method.
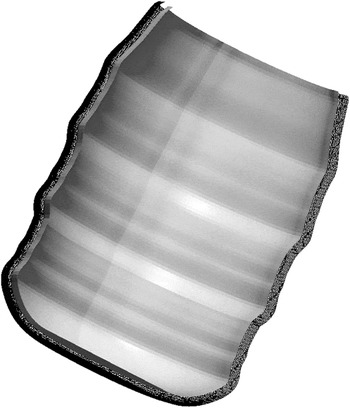
Feature profile after 4 cycles of the Bosch process is depicted in Fig. 3. In addition, wireframe represents the profile after the etching step, but before deposition. Thickness of the polymer layer (between these two surfaces) is proportional to the deposition rate and deposition step duration.
Feature profile after four cycles of the Bosch process. Wireframe shows the profile surface after the etching phase (before deposition).

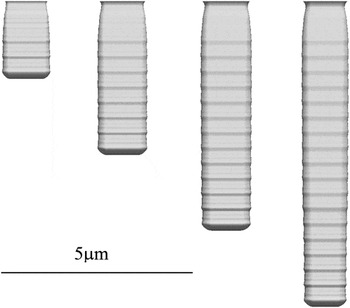
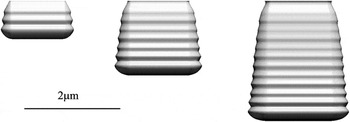
Results of the Bosch process simulations in the case of square aperture mask are shown in Fig. 4. Process parameters are adjusted to obtain almost ideally vertical sidewalls.
The time evolution of the feature profile in the case of square aperture mask after 5, 10, 15 and 20 Bosch steps. (V dep = 10 nm/s,  4.5 nm/s,
 5.47 nm/s,
 9 nm/s,
 59.1 nm/s, t dep = 6 s and t etch = 12 s.)

In this case, the anisotropic etching rate is much higher than the isotropic, so the amplitude of sidewalls scalloping is relatively small.
When the process parameters are not appropriate, it is not possible to get satisfactory profile shape as illustrated in Fig. 5. Imbalance between isotropic components of the etching rates of silicon and passivation layer results in negative tapering.
Parameters imbalance leading to negative tapering. (V dep = 10 nm/s,  6 nm/s,
 5.47 nm/s,
 40 nm/s,
 40 nm/s, t dep = 4 s and t etch = 6 s.)

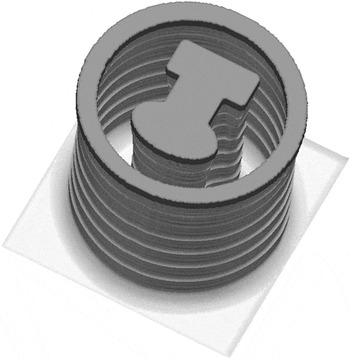
The model can be used for the profile simulations in the case of the complex pillar structure as demonstrated by the Fig. 6. The mask is shown on top in dark gray.
Complex pillar structure produced by the Bosch process. (V dep = 10 nm/s,  4.5 nm/s,
 5.47 nm/s,
 9 nm/s,
 59.1 nm/s, t dep = 6 s and t etch = 12 s.)

V. CONCLUSIONS
The Bosch DRIE process allows the creation of high-aspect-ratio nanostructures. In general, models of the Bosch process that include calculations of the etching and deposition rates based on local particle fluxes demand long computation time and memory consumption. Furthermore, the statistical accuracy of the final profiles strongly depends on the total number of particles, which are calculated during the whole simulation expanding the computational time. On the other hand, the method proposed here uses the etching rates of silicon and polymer as input parameters, significantly reducing computational time. All parameters in the model have transparent physical meaning, while variation of the process parameters clearly demonstrates their influence on the final profile. Additional advantage of the model is the fact that only one level set function is used in contrast to the procedure described in Ref. Reference Ertl and Selberherr24 This reduces the memory consumption that can be very important in the cases of complex geometry structures.
ACKNOWLEDGMENT
The present work has been performed under Ministry of Education and Science 171037 project.