The Italian Renaissance was an extraordinary period of artistic creativity and innovation. Its origins and its artistic evolution have been widely studied in historical and art historical studies,Footnote 1 but limited emphasis has been given to the economic determinants of such exceptional achievements in Florence, Venice, and Rome. In this work I present and analyze a unique dataset on the primary commissions of paintings in Italy between 1285 to 1550 to investigate the determinants of art pricing and the competitiveness of the art market, explore the evolution of the compensation of painters, and argue that the latter had a crucial role in fostering artistic creativity and innovations.Footnote 2
A standard view in art history (as well as in the popular imagination about artists) suggests that the price of paintings during Renaissance was a matter of honor, prestige, and status, independent of the quantifiable features of the paintings or from the rules of a competitive market where price differentials reflect quality differentials between painters as perceived by the buyers (for instance, see O’Malley Reference O’Malley2005, Reference O’Malley2013). I challenge this view analyzing hedonic regressions for the price of paintings, adjusted for purchasing power, and using information on the objective characteristics of the artworks (such as the surface area of the paintings or the number of figures depicted), of the commissions (such as their destination) and of the painters (such as their artistic school or the execution age). The purpose is to provide some empirical evidence that (a) the art market was to a large extent competitive, and that (b) an important determinant of the artistic innovations of Renaissance was of economic nature.
I argue that the market for paintings was characterized by monopolistic competition and free entry in the sense of Edward H. Chamberlin (Reference Chamberlin1933) and Avinash Dixit and Joseph E. Stiglitz (Reference Dixit and Stiglitz1977). In particular, entry in the artistic guild of a town required an initial investment (namely a training of a few years and the payment of a yearly fee) and this allowed the most talented painters to sell their works in an integrated inter-regional market in direct competition with each other, and therefore beyond the control of any local guild. Each painter developed a highly personal style, generating some market power from such product differentiation. I show that pricing changed with quantifiable characteristics of the paintings. However, since this is potentially consistent with both regulated pricing (by the guilds) and competitive pricing, I check whether prices were variable in the quality as perceived at the time, which is what a competitive market would imply. For this purpose I employ a proxy for the quality of painters based on the space dedicated to their biographies in the Lives of the Most Excellent Painters, Sculptors, and Architects by the Florentine art critic Giorgio Vasari (1511–1574); a book published (in its second edition) in 1568 right after the end of my period. This “Vasari index” is highly significant in predicting prices, except for a well-known bias (of Vasari) toward Florentine artists, and confirms that the art market was pricing quality differentials in a direction that was consistent with the preferences of the time. I then advance new evidence in support of the strength of interregional competition between painters. In particular, I show that the price of paintings was equalized between different regional destinations after controlling for both the characteristics of the paintings and painter fixed effects. This suggests that trade did not leave unexploited relevant profit opportunities for Renaissance painters, as expected under monopolistic competition with free entry.
To examine the role of economic forces in driving the artistic innovations of Renaissance, I check whether the data are consistent with two theses. First is a “partial equilibrium” thesis; painters had a reputational rationale in their investment aimed at creating artistic innovation and product differentiation. As noticed by Michelle O’Malley (Reference O’Malley2013) in line with modern signaling theories of reputation (Mailath and Samuelson Reference Mailath and Samuelson2001), artists had strong incentives to intensify their innovative efforts at the beginning of their careers to gradually build a reputation as high-quality artists deserving higher compensation than their competitors. Such a reputation could be exploited in the late part of their careers by reducing effort, for instance, repeating successful figures in their compositions or delegating more work to the assistants. The empirical prediction is that the age-price profile of painters should follow an inverse-U relation. I find strong support for this thesis and show that prices were increasing in the early career of Renaissance painters, reaching a peak in the early forties, and then gradually declining.Footnote 3
The second thesis has a more “general equilibrium” flavor, since it is based on the hypothesis that the impressive development of artistic innovations during Renaissance, such as the introduction of linear perspective with a unique vanishing point and of oil colors, or an unprecedented differentiation of styles, may be due to increasing profitability of the profession, associated, in turn, with an increasing demand. To verify whether the data are consistent with this hypothesis, I build a hedonic price index for paintings and show that the real price (adjusted for the purchasing power of unskilled work) of a representative painting exhibits a substantial increase from the 1420s onward, reaching unprecedented levels by the early 1500s. While this correlation cannot necessarily be regarded as causal, it suggests that part of the explosion of creativity of Renaissance painters exactly in this period could have been driven by profitability.
This research relates to multiple fields of interdisciplinary work. Art historical studies have analyzed the social role of painters in their market from the investigations of Martin Wackernagel (Reference Wackernagel1938) and Frederick Antal (Reference Antal1944), which were indeed focused on Renaissance Florence. Arnold Hauser (Reference Hauser1951) has applied a sociological approach to analyze various artistic periods and fields, Michael Baxandall (Reference Baxandall1972) has introduced the concept of the “period eye” emerging from the relation between painters and patrons, and Francis Haskell (Reference Haskell1982) has investigated the circumstances in which paintings were commissioned, collected, and displayed. However, the focus of this “social theory of art” and its applications is mainly on the social position of painters and patrons and on the implications for subject and style of the artistic production. Hauser (Reference Hauser1951) emphasizes the evolution of the status of the painter from a craftsman of humble origins, such as, Andrea del Castagno, Paolo Uccello, Filippo Lippi, or the Pollaiuolo brothers, to a master of large workshops engaged in multiple collaborative artistic activities, as those of Squarcione in Padua, Verrocchio in Florence, Perugino in Perugia, or Bellini in Venice, and to wealthy and honored geniuses recognized by kings and popes, as in case of Mantegna, Leonardo, Raphael, and Titian. The final achievement in terms of status is reached by Michelangelo, who accumulated wealth unprecedented for his profession, worked without assistants, and behaved like an intellectual. However, such an evolution is analyzed as a sociological phenomenon, not as the result of market mechanisms or economic incentives.
More recently, art historians including Salvatore Settis (Reference Settis1981), O’Malley (Reference O’Malley2005, Reference O’Malley2013), and Richard E. Spear and Philip Sohm (Reference Spear and Sohm2010) have analyzed contracts between painters and their patrons to investigate common patterns in art commissions and art pricing, the structure of the bargaining process (on price, subject matter, and preliminary models and drawings), and the main determinants of the earnings of painters during Renaissance and the Baroque age. Similarly, economic historians such as Isabella Cecchini (Reference Cecchini2000) and Valeria Pinchera (Reference Pinchera2014) have analyzed prices emerging from inventories in Venice and Florence during the seventeenth century. None of these works, however, have adopted econometric techniques. A quantitative approach to the analysis of art historical issues has been introduced by Federico Etro and Laura Pagani (Reference Etro and Pagani2012, Reference Etro and Pagani2013) looking at primary commissions in Italy from 1550 to 1750 with econometric techniques.Footnote 4 Here I investigate real prices in the earlier period from 1285 to 1550 and provide new tests of theoretical predictions concerning the relation of prices with quality and age of the painters.
The Art Market in Italian Renaissance
In the twelfth–thirteen centuries, fresco paintings started to replace mosaics in Italy as the main mural decoration in churches and religious institutions. The art of painting was initially practiced by groups of artists moving between towns to paint frescoes for a daily wage, as previously had been the case for the mosaics. Such an organization of artistic labor was efficient in implementing repetitive tasks and reproducing images following traditional iconography, but was not conducive to frequent artistic innovations and was preserving the humble conditions of the artists as manual workers.
This situation gradually changed when the demand for artistic decoration increased as a consequence of the accumulation of wealth in the politically fragmented towns of medieval Italy. These were characterized by many independent public commissioners, often competing for prestige, and also by various decentralized religious orders (e.g., Franciscans, Dominicans, Augustinians, and Benedictines) and confraternities which needed to decorate their new churches. The initial consequence of the increased demand for religious art was to generate some competition for the best artists and introduce incentive-based systems.Footnote 5 By the end of the thirteenth century, masters such as Duccio, Cimabue, and Giotto started to organize workshops in an entrepreneurial way and to be paid differentiated fees for each commission, as opposed to daily wages. The case of the “Maestà” commissioned from Duccio in 1308 seems to be a turning point for the introduction of incentive-based mechanisms. At the beginning of this major enterprise, Duccio was paid a daily wage for painting the front of the altarpiece, which took a couple of years; then he was offered a fixed price for painting the back of the panel, which took nine and a half months. Such a payment mechanism would become entirely natural for subsequent commissions of altarpieces, mostly painted with tempera colors on wood panel, whose execution could be slower compared to frescoes and, therefore, could be improved with effort under appropriate incentives. The transition from payment per day to payment per work was a key step in fostering efforts to pursue increasing realism, as well as in the same evolution of the modern figure of artist as an innovative entrepreneur. During the first half of the fourteenth century leading Sienese and Florentine painters were becoming well paid stars: Ambrogio Lorenzetti was paid about 113 gold florins for the fresco on the “Allegories of the Good and Bad Government” in the Town Hall of Siena,Footnote 6 Simone Martini was paid 100 florins for a small polyptych (1323) painted for a church of Orvieto (between his services for the Anjou court of Neaples and the Papal court of Avignon), and Giotto was commissioned the “Stefaneschi triptych” (1320) for St. Peter’s in Rome at the unprecedented price of 800 florins.Footnote 7
The first artistic communities of Renaissance developed in what are now regions of Tuscany, Umbria, and Veneto. Artists, as other craftsmen, enrolled in guilds organized at the town level, the first being formalized in Perugia (1286), Venice (1290), Verona (1303), Florence (1314), and Siena (1355).Footnote 8 These guilds played an important role in regulating apprenticeship and enrollment during the phase where the rapid increase of artistic commissions was attracting a growing number of artists. However, there is no evidence of any direct interference on the prices charged by masters at the town level, and, a fortiori, on the competition for the frequent commissions from other towns.Footnote 9 The strengthening of competition between artists at the beginning of the fifteenth century emerges with another key event of Renaissance art. This was the contest organized in 1401 by the guild of wool merchants of Florence (Arte di Calimala) for the commission for the bronze reliefs of a door of the Baptistery of St. John. Seven sculptors in the competition were asked to prepare a bronze panel of identical size, weight, shape, border design, depth of relief, and subject (Abraham’s sacrifice of Isaac). The best reliefs were judged to be those of the Lorenzo Ghiberti and Filippo Brunelleschi. Ghiberti won the commission, but Brunelleschi, a multidisciplinary intellectual, became soon a central figure of Renaissance art: probably around 1416 he derived heuristically the principles of linear perspective, painting two panels with exact views of Piazza della Signoria and the Baptistery of St. John. His new application of a unique vanishing point would affect the future reliefs of Ghiberti and Donatello, and would change painting forever.Footnote 10 The importance of competition and economic incentives for the promotion of artistic innovations was clearly recognized by Florentine humanists of the period, such as Leon Battista Alberti (a major architect who formalized mathematically the laws of perspective in De Pictura, 1435) and Poggio Bracciolini (who rediscovered Vitruvius’ De Architectura).Footnote 11
The increasing demand for artistic decorations during Renaissance characterized not only Tuscany, but all the rest of Italy (Goldthwaite Reference Goldthwaite1993), especially Umbria, the Marche, the courts of Mantua and Ferrara, the Venetian Republic, and Rome. In the competition for the most remunerative commissions, the artists started to differentiate their styles and then to sign artworks to gain market power for the production of their own workshop; the same assistants were so specialized in reproducing works “in the style” of the master that precise attributions remain the main concern of modern art historians.Footnote 12 Entry in the market was free, once having borne the sunk cost related to apprenticeship, including the opportunity cost of a long investment in artistic capital (as well as the uncertainty on the future productivity as painter). Fixed costs of production were the yearly fees for the enrollment in the guild at the town level and the payments for the maintenance of the workshop. Competition between the best artists was open in the interregional market: painters were regularly moving between regions to paint frescoes or could easily send altarpieces executed in their own workshop to other places. From an economic point of view the primary market for paintings was characterized by a typical form of monopolistic competition with free entry for an integrated interregional market.Footnote 13 In addition, an embryonic international secondary art market was emerging: in 1372, Francesco di Marco Datini was writing from Avignon to Florentine merchants to order small Madonna’s paintings for 5.5–6.5 florins each, and in the 1430s we know that Giovanni Battista della Palla was ordinarily engaged in trading paintings.Footnote 14 Nevertheless, almost all the primary trade, on which we focus our empirical investigation, was taking place at the interregional level within the Italian peninsula.
In early Renaissance, the main typology of religious painting was the altarpiece (pala or ancona), which was structured in a complex polyptych (polittico) with multiple parts surrounded by carved and gilded frames (alla greca). Only during the fifteenth century was this simplified into a unique large panel (all’antica) of a rectangular or compact form (usually with a semicircular upper portion, the lunetta) depicting the main religious subject.Footnote 15 Smaller additional panels were added at the bottom, depicting more detailed histories (the predella), but they were also considered an integral part of the altarpiece. Over time canvases replaced panels. Oil colours were introduced (and for a while coexisted with tempera) only in the late fifteenth century, probably due to Antonello da Messina, who imported the practice from Flemish artists.Footnote 16
Art historians, even when carefully examining artistic commissions, as in O’Malley (Reference O’Malley2005, Reference O’Malley2013), tend to view art pricing during Renaissance as a matter of honor, prestige and status of the parts, independent from quantifiable features (O’Malley and Welch Reference O’Malley and Welch2007) or from the rules of a competitive market where price differentials reflect quality differentials between painters as perceived by the buyers. According to O’Malley (Reference O’Malley2013, pp. 3–5), “prices had a social basis: they were set with regard to human relationships, to expressing social virtues, such as magnificence, and sometimes to attracting a new strand of patronage… While it might be assumed that painters whose work was in high demand consistently earned large fees, this was not the case. Painters whose talent was recognized and admired generally earned more for individual works of art than did painters of the second rank, but their prices were not consistent within their individual careers. Prices were not generally predictable with regard to a measurable quantity such as size or the number of figures in the composition, they did not rise over the course of their careers.” Such a view is in contradiction with an efficient primary market where we would expect prices to reflect not only differences in quantifiable characteristics of the paintings related to costs and dynamic incentives (the supply side), but also differences in quality as perceived at the time (the demand side). I argue that art pricing was related to quantifiable features of the paintings, reflecting basic incentive mechanisms, was related to quality as we would expect under monopolistic competition, and tended to be equalized across regions as we would expect from an interregional market with free entry.Footnote 17
To understand art pricing during Renaissance, we need to consider the contractual stage between artists and patrons. The subject matter, size, and the price of artistic commissions were typically agreed ex ante and notarized. Even the number of human figures to be depicted was agreed upon many occasions, at least implicitly, and these agreements could be quite effective (indeed, even in the absence of enforcement an implicit relational contract can be self-enforcing in a long-lasting relation).Footnote 18 Occasionally, the payment was partially defined ex post through an appraisal (lodo) by arbitrators, as was the case for the “Virgin of the Rocks,” commissioned in 1483 from Leonardo and Ambrogio and Evangelista de Predis, and re-evaluated in 1506 after a long-lasting dispute. The final payment was recorded in 1508.Footnote 19
These complex processes could determine incentives to exert effort to create quality, and could limit the moral hazard associated with the problem of contracting directly on effort or quality. From standard principal-agent theory (Holmstrom Reference Holmstrom1979), we can conjecture that another way to reduce moral hazard was related to (implicit or explicit) agreements on the quantifiable features of the paintings that were correlated with quality. One was the number of figures depicted in religious altarpieces: for instance, increasing the number of saints and angels surrounding a Madonna was not strictly necessary, but represented a commitment to exert effort and to deliver quality in the composition because figurative subjects were considered more important and were executed by the master, as opposed to his assistants.Footnote 20 If this incentive mechanism was relevant, I would expect not only that prices increase with the number of figures depicted, but that prices per meter square will also.
An implicit incentive mechanism present in a dynamic setting was associated with reputation building, created over time and exploited at an older age (O’Malley Reference O’Malley2013). Such a theory of reputation matches well with the model of Mailath and Samuelson (Reference Mailath and Samuelson2001): reputation as a high-quality producer is built by exerting extra effort in artistic creativity at the beginning of a career to benefit from separation in the market from low-quality competitors, and can be exploited reducing effort toward the end of the career.Footnote 21 As argued in O’Malley (Reference O’Malley2013, p. 142), “Perugino established his career in the 1470s with high effort and achieved widespread fame early in the 1480s. In the 1490s, therefore, he was able to develop his production techniques and organize his workshop so that it was possible for him to put what might be termed medium effort into the design phase of a work.” If we accept the hypothesis that market prices reflect the quality of paintings as perceived at the time, the main implication of such a reputational mechanism is that the relation between price of paintings and age of execution should follow an inverse-U pattern.Footnote 22 In practice, price-age profiles may differ between artists or categories of artists. For instance, David Galenson (Reference Galenson2002, Reference Galenson2006) has emphasized a general distinction between conceptual innovators, who tend to reach their main achievements early in life as the result of new approaches to artistic problems, and experimental innovators, who keep searching for new developments over their careers reaching their main achievements only late in life. For this reason it will be important to control for artist fixed effects when analyzing the age-price relation.
Secular commissions started to be produced for the élite in the fifteenth century, mainly with historical and mythological decorations for cassoni (marriage chests) and portraits.Footnote 23 These commissions were destined to private use, as were small paintings of religious subject used for private devotion.Footnote 24 Soon, rich families started to decorate their own chapels in churches with altarpieces commissioned directly from the painter. The purpose was to invest in the “next” life or just to signal their “magnificence” to the community (Nelson and Zeckhauser Reference Nelson and Zeckhauser2008). This created a multiplier of artistic production as new churches were built, with new chapels to be sold to private families who then commissioned new altarpieces and tombs, stimulating imitative behavior by others. Such a laicization of religion made it possible for the demand of art to increase rapidly during this period. Part of this was because paintings were capital goods whose value was increasing during Renaissance: altarpieces for private chapels were repeatedly seen and enjoyed by the entire local community, generating benefits for their commissioners.Footnote 25 The essential consequence of this, for my purposes, is that the new social benefits associated with art increased the willingness to pay for paintings.
A well-known thesis associated with Robert S. Lopez (Reference Lopez1953) is that the low marginal productivity of capital following a period of sustained wealth accumulation contributes to high investment in artFootnote 26: this may have happened in Italy during the fifteenth and sixteenth centuries. Judith C. Brown (Reference Brown1989) has contested the Lopez thesis arguing that there was not any economic depression during the Italian Renaissance. Alternative theories suggest that “the Black Death and successive devastating plagues of the fourteenth century produced an ‘inheritance effect’ of hedonistic spending as a result of the greater wealth enjoyed by the survivors” (Goldthwaite Reference Goldthwaite1993, p. 14) and this exerted its effects during at least the fifteenth century. In either case, the main implication of the increasing demand for art is that the real price of paintings should increase and profitability of the profession should increase as well.Footnote 27 I will analyze whether this was the case, and whether this attracted more painters or more innovative painters to the artistic profession.
The Dataset
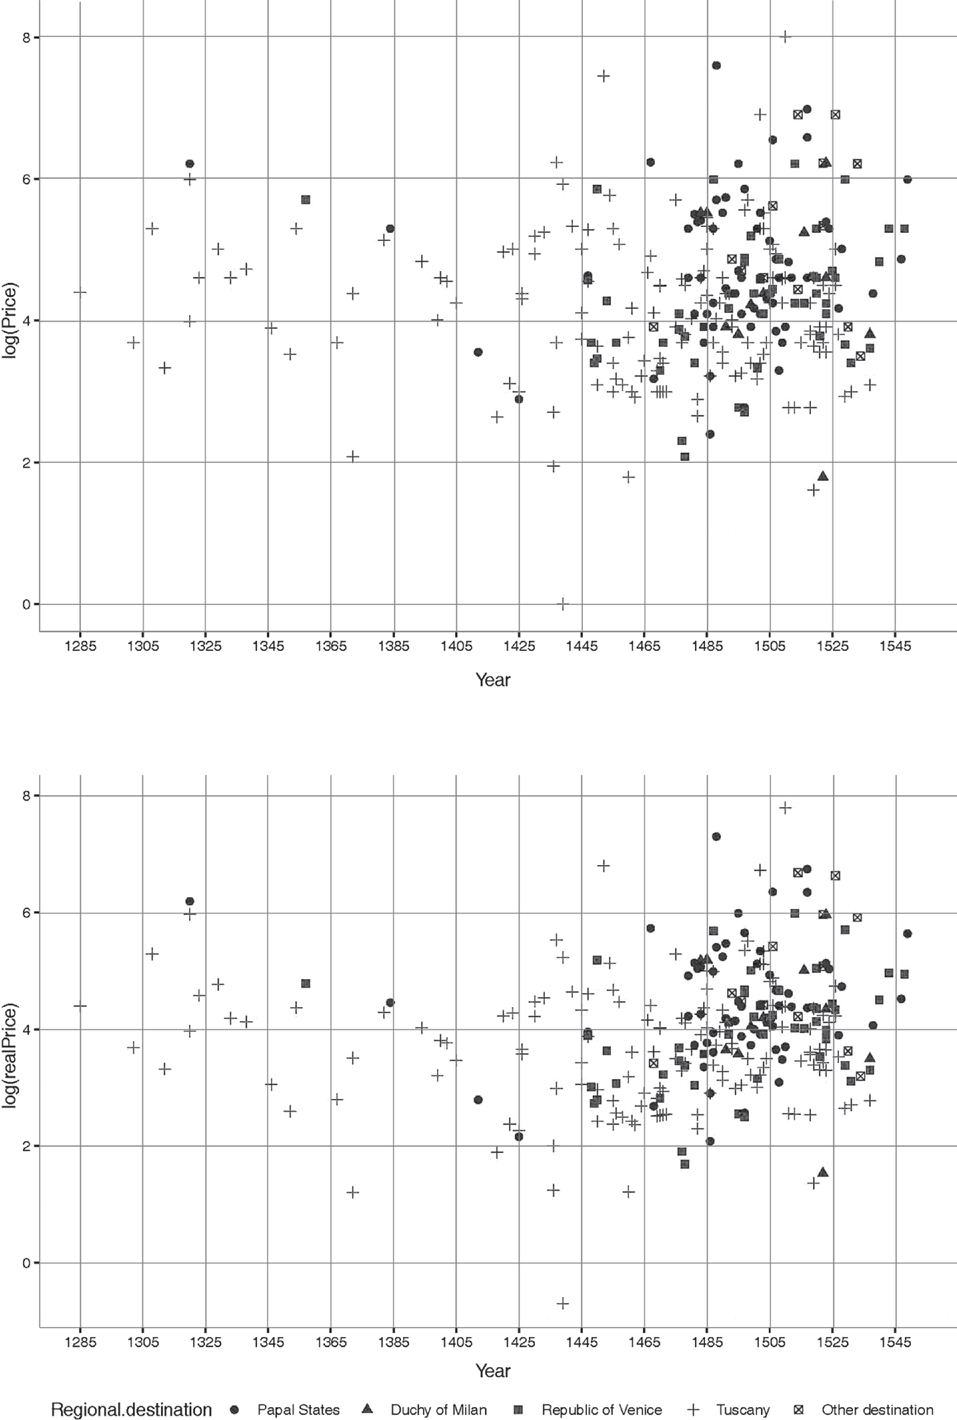
I analyze primary commissions of paintings from 1285 (when Duccio’s “Madonna Rucellai” was commissioned for S. Maria Novella in Florence for 81 florins) to 1550, putting together a dataset with more than 300 paintings (see Figure 1) by more than a hundred artists. The dataset has 248 observations on price, surface area, and other basic features for the econometric analysis. About half of the observations concern famous documented commissions reported in early art historical texts on the Renaissance art market by Wackernagel (Reference Wackernagel1938), Antal (Reference Antal1944), and Baxandall (Reference Baxandall1972), and in the list of contracts analyzed by O’Malley (Reference O’Malley2005).Footnote 28 I directly collected half of the observations from the most updated monographs for each artist. In one case, the price of 140 florins for the “Tondo Doni” of Michelangelo derives from an anecdote in the biography of Vasari (Reference Vasari1568).Footnote 29
Prices of Paintings Over Time by Destination: (Log) Nominal Price (Above) and Real Price (Below)

For each painting I have the year of the commission, the price, the name of the artist, and the age at which the artist executed the work, the total surface area of the painting, the number of figures depicted (as established in agreements when possible, otherwise as directly counted from the painting, if still existing), the destination town, the regional school of the master, whether the commission included multiple works, if it was a fresco or a painting on panel or canvas with tempera or oil colours.
I divide regional destinations according to a broad classification. Tuscany includes Florence, Siena and Lucca with their respective territories, the Duchy of Milan and the Republic of Venice were independent states during all Renaissance, and the Papal States included Rome and nearby towns as well as most of Umbria and Marche. Remaining locations are included in a residual category for all empirical analysis. To test whether larger towns could command different prices compared to commissions from small towns in the countryside and whether special relations between town and painter could affect pricing, I build a dummy “Minor destinations,” which has value one for small towns without a relevant local artistic communityFootnote 30 and zero for large towns, and a dummy “Hometown commission” with value one when a painter from a small town active elsewhere is commissioned an altarpiece in his native town and zero otherwise.
Prices of commissions were typically recorded in units of fiorino d’oro (gold florin) which at this time was widely recognized as the dominant trade coin, not just in Italy, but also in the entire Western Europe for large-scale transactions.Footnote 31 The conversion of the florin into the unit of account, the lira, changed over timeFootnote 32 and the real value of the florin changed only slowly over time. Therefore, I have translated nominal prices into real prices on the basis of the widely recognized index of Richard A. Goldthwaite (Reference Goldthwaite1980, Reference Goldthwaite2009). This index employs information on the purchasing power of the florin in terms of unskilled work.Footnote 33 This measure has three advantages: first, there are reliable data on unskilled wages at least between the mid 1300s and the early 1500s; second, unskilled work is a better deflator compared to an alternative index of the cost of living based on fragmentary data on the prices of different goods; and third, the index allows me to directly compare the compensation for painting with the compensation for unskilled work.Footnote 34 Regardless, changes in the real value of the florin were limited: what one could buy in Florence around 1300 with one gold florin required 1.03 florins in 1325, 2.56 in 1350, 2.38 in 1375, 2.22 in 1400, 2.08 in 1425, 1.96 in 1475, 1.19 in 1500 and 1525, and 1.43 in 1550 (I used linear interpolation to obtain an annual index). Figure 1 reports the logged real prices of paintings, showing that there are no different patterns compared to the case of nominal prices.
The real price of paintings is a good proxy for the gross profitability of a commission. Part of the net price, of course, was covering variable costs of production, but these were rather limited. Most of the colours were rather cheap and their cost was negligible compared to the revenues of the painters, with the notable exception of gold (often used for the background in the early phase) and blue, whose most expensive version was “ultramarine” derived from the purple-blue mineral of lapis lazuli imported from the middle East.Footnote 35 However, the cost of these two colors was usually paid directly by the patrons.
For the econometric analysis I use dummy variables with a unitary value when the painting is known to be painted with tempera and when it is known to belong to a polyptych alla greca. I also use a dummy variable for commissions whose price is explicitly mentioned in the sources as a net price (separating compensations for additional works, such as gilding or woodcuts): the purpose is to test that the other prices were indeed net prices. Finally, I count the number of commissions, which is one for a single painting, but, for instance, was seven when Piero Pollaiuolo was commissioned by the Tribunale della Mercatanzia, the Florentine court for economic crimes, to paint the “Seven Virtues” (1469–1472) for 20 florins each (one was actually painted by Botticelli).Footnote 36
The dataset used in the regressions includes 92 painters and covers most of the main painters active in Florence during this period, and representative groups from the other main schools, such as the Senese, Umbrian, Venetian, and Milanese. I use a dummy variable for each of these schools.Footnote 37 The painters with the largest number of observations in the dataset are famous artists such as Perugino (with 23 known prices), Filippino, Lotto, Pollaiuolo, Titian, Signorelli, Botticelli, and Cima da Conegliano. There is no doubt that the abundance of information on some is due to the larger amount of research by art historians. However, the dataset includes sales by a fringe of minor painters virtually forgotten today, or for which we have only fragmentary records, but that must have been active professionists at the time.
An interesting quantitative measure of the quality of painters as perceived at the time can be obtained from the first art historical text, The Lives, written by art critic, as well as painter, Giorgio Vasari, right after the end of our period of investigation, in a first edition in 1550 and in a second in 1568. The text contains a series of biographies dedicated to all the main Italian painters and their works. I assume that the space dedicated to each painter is a proxy of the quality of the painter as perceived by Vasari and by his contemporaries. I have measured this Vasari index as the number of rows per painter from the second edition (Vasari, Reference Vasari1568, written after the death of all the painters in the dataset, except for Titian who was about 80 years old and already widely recognized).Footnote 38 As well known, Vasari believed in the primacy of the Florentine school (and his work was also funded by the Medici), therefore we may expect some bias in the space dedicated to Florentine painters. Despite this, the Vasari index represents a good and independent proxy for the quality of painters as perceived at the time. To give a general idea, the ranking of the index starts with Michelangelo, who is followed by Raphael, Andrea del Sarto, Titian, Perugino, Ghirlandaio, Rosso Fiorentino, Parmigianino, Beato Angelico, Spinello Aretino, Fra Bartolomeo, Paolo Uccello, Filippo Lippi, Masaccio, Simone Martini, Botticelli, and Mantegna. I use this index to implement a weak efficiency test for the Renaissance market. A competitive and efficient market should generate price differentials related to (or predicted by) quality differentials as perceived at the time.Footnote 39 Therefore, if, after controlling for quantifiable characteristics of the paintings, prices are indeed correlated with the Vasari index in a significant way, I take this as evidence of a competitive market.
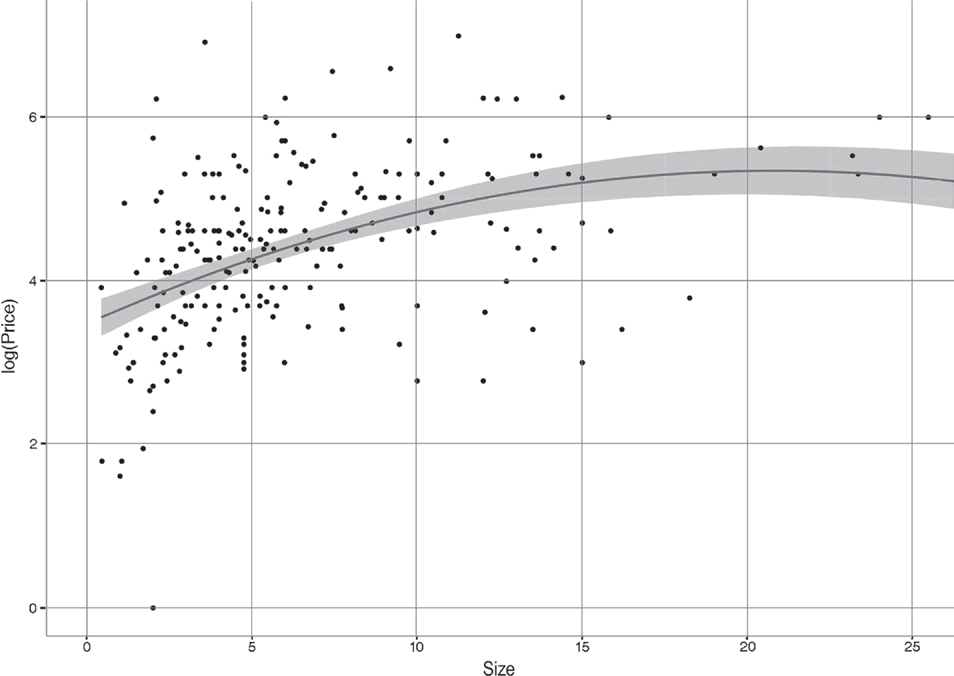
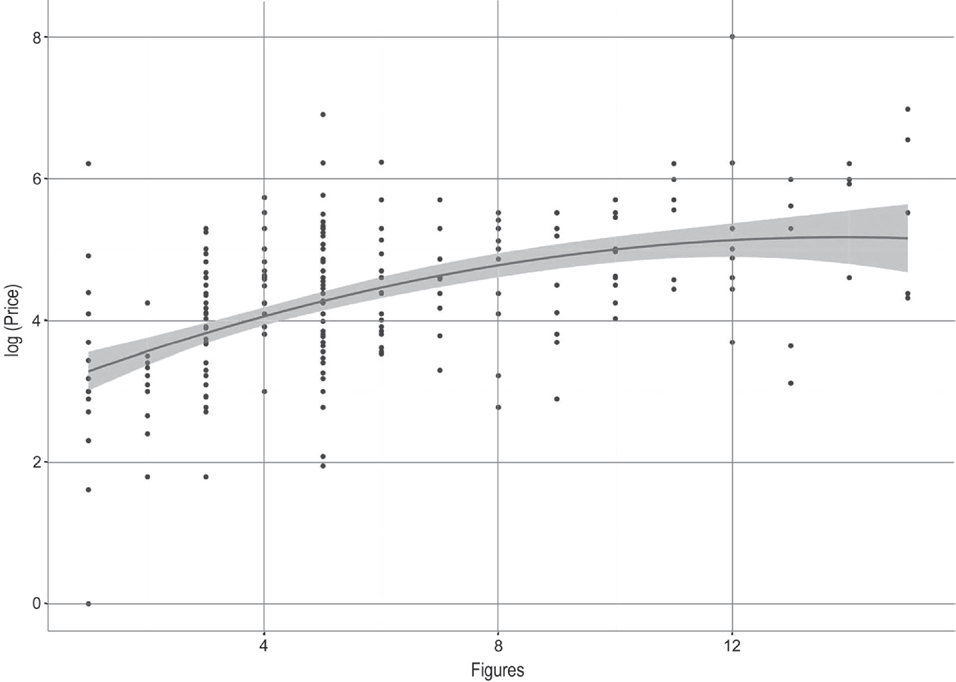
Some descriptive statistics for the paintings with known price are reported in Table 1 with divisions by centuries and by destinations. The average (nominal) price of the commissions is 146 florins and the median is 80 florins, but with a distribution from a minimum of one florin, for a minor work of Benozzo,Footnote 40 to a maximum of 3,000 florins, the price paid for the fresco of the “Sistine Chapel” by Michelangelo in 1510. The average surface area is almost 19 square meters, but the distribution is highly skewed toward smaller size, with a median of 5.44 square meters, and huge surfaces for frescoes of cupolas and ceilings. The simple correlation between prices and areas is above 60 percent, as shown in the plot of Figure 2 (where I omitted few outliers of abnormal size, which were all frescoes). The median number of figures depicted in a painting is five and the correlation with prices is 34 percent. In Figure 3 I plot the log nominal price in relation with the number of figures depicted (again omitting outliers), and a positive and concave relation is evident in spite of large variability.
Descriptive Statistics (Nominal Prices in Gold Florins)

Note: Data on the Vasari index refer only to painters actually cited by Vasari.
Source: See the text.
Relation Between Size of Paintings (in Square Meters) and (Log) Nominal Price. The Solid Line is a Quadratic Polynomial Regression and the Gray Belt is a 5 Percent Confidence Band

Relation Between Number of Figures Depicted and (Log) Nominal Price. The Solid Line is a Quadratic Polynomial Regression and the Gray Belt is a 5 Percent Confidence Band

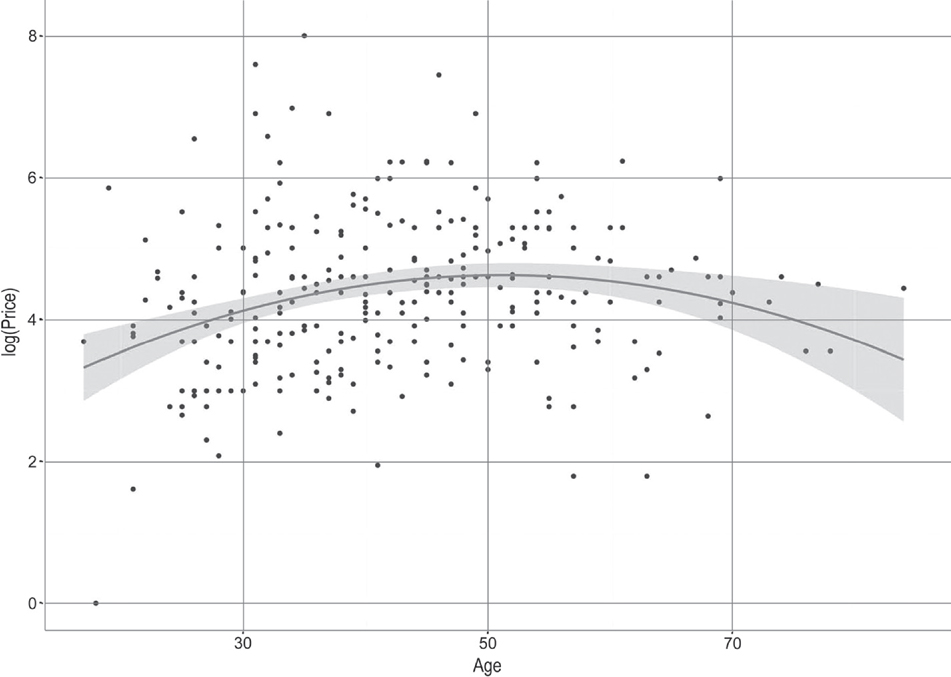
The descriptive statistics in Table 1 emphasize few broader patterns. The average age of the painters at the time of execution is 42 years, which should be compared with an average life expectancy of 64 years for the painters in the dataset (Masaccio died when he was 27, Titian and Michelangelo when they were almost 90 years old). In Figure 4, I plot the logprice in function of the age of the painter at the time of execution and find an inverse-U relation which is in line with the reputational theory discussed earlier. Nominal prices seem to decrease between the early period of Duccio, Cimabue, and Giotto and the end of the 1300s, a phase with a large number of workshops, but only few innovative masters, and to increase from the 1400s to the 1500s, which is the phase of maximum artistic innovation. Prices appear to be substantially higher, namely two/three times higher, for artistic works destined to the Papal States and other destinations compared to Tuscany and the Republic of Venice.Footnote 41 These differences may be due to changes in the real value of the florins or to changes in the kind of artworks commissioned over time or across regions. Therefore I need an econometric investigation to verify the real evolution of art pricing, and this will be the focus of the next section.
Relation Between Age of Execution and (Log) Nominal Price. The Solid Line is a Quadratic Polynomial Regression and the Gray Belt is a 5 Percent Confidence Band

Empirical Analysis
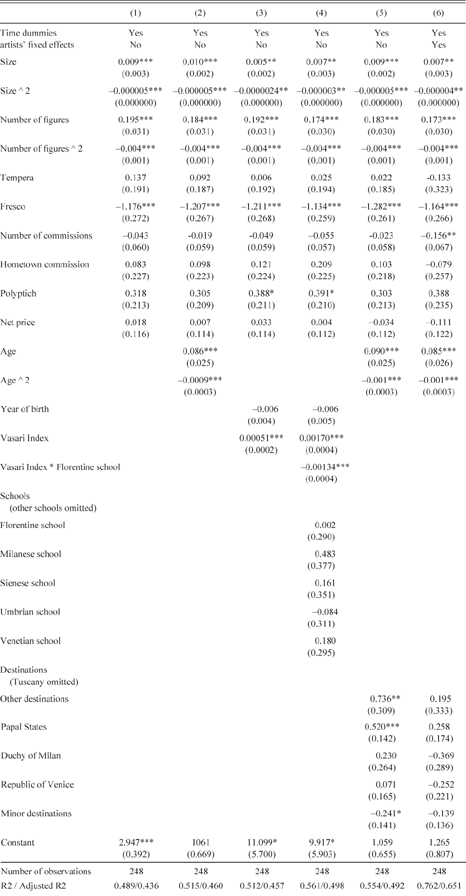
In Table 2 I report different hedonic regressions for the logged real price of paintings. As detailed in the estimating equations reported later, the six columns present: (1) the baseline specification controlling only for characteristics of the paintings, and subsequent specifications accounting for, (2) the life-cycle of the painters, (3) biographical information on the painters, (4) artistic differences between stylistic schools, (5) geographical differences between regional destinations of the commissions, and (6) the full specification with quality control through artists fixed effects, reported separately in Table 3. In each regression I control for the time trend using dummy variables for different decades such as 1421–1430, 1431–1440, 1441–1450, and so on until the end of the period, plus two dummy variables for the fourteenth century where I have a lower number of observations. At the end I present an hedonic price index derived from the coefficients associated to these dummy variables.
Regressions for the Real Price of Paintings in Renaissance Italy (1285–1550)

Notes: Standard errors in parentheses.
*** p<0.01
** p<0.05
* p<0.1
Source: See the text.
Artists’ Fixed Effects From Regression (6)

Notes:
*** p<0.01
** p<0.05
* p<0.1
Coefficients relative to the pool of artists with one observation.
Source: See the text.
Characteristics of the Paintings
In column (1) of Table 2 I emphasize the basic determinants of prices. I focus only on the quantifiable characteristics of the paintings and I estimate the following equation for the logarithm of the real price of painting i commissioned at time t:
 $p{ & _{it}} = \alpha \sum\nolimits_\tau {{\varphi _\tau }{I_{\tau t}} + \beta {X_i} + {\varepsilon _{it}}} ,$
where α is a constant, Iτt is a dummy variable with unitary value if t belongs to the period τ, with coefficient φτ, Xi denotes the observable painting-varying exogenous characteristics of paintings with coefficients’ vector β, and εit is an error term. The price is always increasing and concave in the surface area of the painting. However, the elasticity is small due to the large range of size of the commissions, which includes large frescoes (and it would increase substantially if I omitted frescoes). A similar relation is confirmed in all subsequent specifications. Controlling for size, the price appears to be increasing and concave in the number of figures depicted, which is also confirmed in all subsequent specifications. The elasticity appears now substantial, with a price increase due to an additional figure that starts from 20 percent of the price for one figure and slowly decreases for additional figures. This can be interpreted in terms of a contractual solution to the problem of unenforceable quality: since the latter was not verifiable ex ante, patrons were willing to pay more for a quantifiable feature correlated with quality such as the number of human figures. Interestingly, painters are paid substantially less for frescoes even after controlling for size and number of figures, which is probably due to the faster production technique, leaving less space for incentives to exert effort and more to pure talent. These results are in line with results on primary commissions in the Venetian Republic between 1550 and 1750 and in Rome during the 1600s (see Etro and Pagani Reference Etro and Pagani2013; Etro, Marchesi, and Pagani Reference Etro, Marchesi and Pagani2015).
A typical distinction for Renaissance altarpieces is between the polyptich, which was common during early period and required the creation of a much more complex artistic “machinery,” and the later pala all’antica, often on canvas (though the two typologies coexisted during the central period of observation). The price of the first typology appears higher, but the coefficient is not significantly different from zero in most specifications. The number of simultaneous commissions is negatively correlated with the unitary price, though a coefficient significantly different from zero at the 5 percent level of confidence will appear in the full specification controlling for the artists’ fixed effects, suggesting a 15 percent discount for each additional painting in the series. I do not find other significant coefficients in any specification for the use of tempera (as opposed to oil) colors and for commissions from the hometown of the painter. Finally the coefficient on the dummy for the net price is positive, but not significant. Since it will turn negative only in subsequent specifications and never with a coefficient significantly different from zero, I can safely regard the sample as largely composed by net prices.
The Life-Cycle of the Painters
In column (2) I estimate the following equation for the price of painting i commissioned from painter j at time t:
 $p{ & _{ijt}} = \alpha + \sum\nolimits_\tau {{\varphi _\tau }{I_{\tau t}} + \beta {X_i} + {\alpha _1}{A_{jt}} + {\alpha _2}A_{jt}^2 + {\varepsilon _{ijt}}} ,$
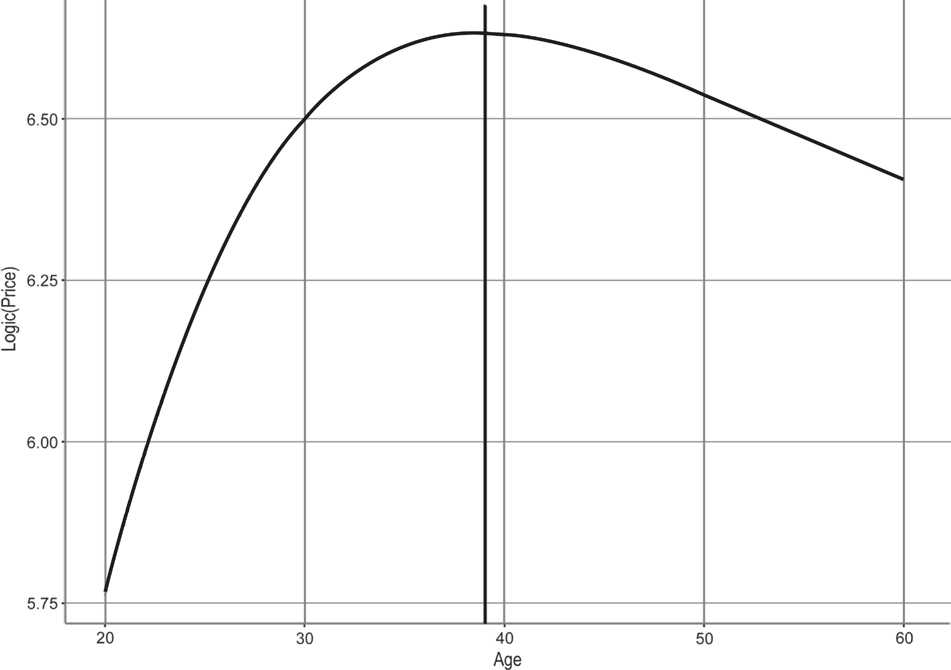
where Ajt is the age of painter j at time t and α1 and α2 are the coefficient of the linear and quadratic terms. These terms show a very clear life-cycle pattern, with a peak of maximum compensation at the age of |α1/2α2| ≈ 47. This pattern will be confirmed in the following regressions with a peak of pricing at the age 44 in the full specification with the crucial control for the artists’ fixed effects. The pattern is in line with results from the Baroque period (Etro and Pagani Reference Etro and Pagani2012), but could be constrained by the quadratic specification. Following standard practice in cultural economics (see Galenson Reference Galenson2002, Reference Galenson2006 on modern painters and Borowiecki Reference Borowiecki2014 on music composers) I have also experimented in the regressions replacing the second-order polynomial in age with a fourth-order polynomial, and I have found a similar inverse-U relation between price and age. While I do not repeat these regressions here, Figure 5 shows the price-age profile emerging from the full specification augmented with the fourth-order polynomial: this more flexible model anticipates the peak in pricing at the age of 39, though the third and fourth order coefficients are not significant. The inverse-U pattern of the price-age profile is consistent with the reputational theory of O’Malley (Reference O’Malley2013). As long as market prices reflected the artistic quality and innovativeness of the painters as perceived at the time, the price profile supports the idea that painters invested in reputation at the beginning of their career, focusing on improvements of their products and creating artistic innovations that were gradually appreciated by the market. They then exploited their reputation in the late part of their career, reducing effort and possibly adopting a more repetitive style or delegating an increasing amount of work to their assistants.
Price-Age Profile from Fourth-Order Polynomial Added to Regression (6) of Table 2

This reputational theory of the age-price profile is not inconsistent with Galenson’s (Reference Galenson2002, Reference Galenson2006) thesis that conceptual and experimental innovators reach their main artistic achievements at respectively early and late ages. Indeed, the inverse-U pattern of prices in the contemporary primary market may reflect a mix of different age-price profiles. Alternatively, and more in line with the reading of Galenson (personal communication), the primary market may not reflect differences in the age-price profile between conceptual and experimental innovations because it takes time for art criticism and the secondary art market to internalize artistic innovations (especially experimental ones). While this remains an open issue, and I cannot provide systematic evidence on differences between conceptual and experimental innovators, I can at least complement the analysis of Galenson (Reference Galenson2006) on few major artists. Two prototypical conceptual innovators during Renaissance were Masaccio, who introduced the linear perspective in the organization of compositions, and Raphael, who introduced a working method based on preparatory drawings of idealized scenes and execution by a team. Their single most frequently reproduced paintings in modern art history texts (according to the survey of Jensen Reference Jensen2004) were those executed at the age of 26 for Masaccio (the frescoes in the Cappella Brancacci) and 28 for Raphael (the fresco of the “School of Athens”). In spite of limited data from the brief lives of these two painters, Masaccio was already paid above average at this early age, with a record price of 80 florins for the small “Pisa altarpiece” painted when he was 25 (in 1426), and Raphael quickly became one of the highest paid painters of Renaissance. His altarpieces were paid already about 170 florins (for the “Coronation of the Virgin”) when he was 22, reaching a thousand florins for the small “St. Cecilia alterpiece” when he was 31, and even more for the larger “Transfiguration” when he was 34.
According to Galenson (Reference Galenson2006) Leonardo, Michelangelo, and Titian were the prototypical experimental innovators: their most reproduced paintings in modern art history texts (again according to Jensen Reference Jensen2004) are those commissioned respectively when the authors were 43 (the “Last Supper”), 37 (the “Sistine Chapel”), and 36 (the “Pesaro Altarpiece”). Leonardo was already offered 300 florins for the “Adoration of the Magi” when he was almost 30 years old, though complex contractual conditions forced him to anticipate most expenses and ultimately give up on the project and move to Milan (Zöllner Reference Zöllner2015). We do not know how much Ludovico Sforza paid Leonardo for the “Last Supper,”Footnote 42 but according to Wackernagel (Reference Wackernagel1938) the promised payment for the “Battle of Anghiari,” commissioned when he was 51, may have been similar to the 3,000 florins that were probably promised to Michelangelo for the “Battle of Cascina.”Footnote 43 Finally, we know that the “Mona Lisa,” started a few years later (possibly between 1503 and 1506) and refined over many years, was probably sold to King François I of France at the end of the life of Leonardo for a price above any other price in our dataset (Greenstein Reference Greenstein2004; Zöllner Reference Zöllner2015). Michelangelos’s “Sistine Chapel” was paid 3000 florins, more than any other completed fresco we are aware of. Titian was paid 102 florins for the “Madonna Pesaro” (1519) at the age of 31, 200 for the “Averoldi polyptych” (1520), 400 for the “Descent of the Holy Spirit” (1529), 500 for a portrait of Charles V (1533), 200 for the small “Pala Roganzuolo” (1543), as well as for the “Martyrdom of St Lawrence” (1548).Footnote 44
The Vasari Index and the Different Schools
In column (3) I augment the baseline specification with biographical information on the painters. In particular, I estimate the following equation:
 $p{ & _{ijt}} = \alpha + \sum\nolimits_\tau {{\varphi _\tau }{I_{\tau t}} + \beta {X_i} + \kappa {b_j} + \gamma {V_j} + {\varepsilon _{ijt}}} ,$
where bj is the year of birth of painter j and Vj is the Vasari index of the same painter, with coefficients respectively κ and γ. I find that the Vasari index is positively correlated with prices and its coefficient is both statistically and economically significant. This provides support for the efficiency of the primary market because it confirms that prices of paintings with similar characteristics were higher for painters producing higher quality as perceived at the time. More precisely, starting from the average value of the Vasari index, doubling it increases the predicted price by more than 14 percent. Notice that the result is not driven by the period of activity of the painters, since this specification controls for the year of birth of the painters and the associated coefficient is neither statistically or economically significant.
The predictive power of the Vasari index could be somewhat distorted by systematic quality differences between regional schools or by the bias of Vasari for Florentine painters compared to painters of other schools, especially the Venetian one. Therefore in column (4) I estimate the following augmented equation for the logprice of painting i commissioned from painter j at time t:
 $p{ & _{ijt}} = \alpha + \sum\nolimits_\tau {{\varphi _\tau }{I_{\tau t}} + \beta {X_i} + \kappa {b_j} + \gamma {V_j} + \eta {V_j}{I_{Fj}} + \sum\nolimits_s {{\eta _s}{I_{sj}} + } {\varepsilon _{ijt}}} ,$
where Isj are dummy variables with unitary value when the painter j belongs to the school s, namely the Florentine, Milanese, Senese, Umbrian, or Venetian school with coefficients ηs, while η is the coefficient of the interaction term of Vasari index and Florentine school. I confirm the explanatory power of the Vasari index after accounting for the differences between regional schools. The coefficients for the Florentine, Senese, Umbrian, Venetian, and Milanese schools are compared to painters from other schools, and show that the market was not pricing differently paintings from any particular regional school. However, Vasari was biased in favor of Florentine painters, therefore the interaction of the Vasari index with the dummy for the Florentine school should account for a lower evaluation of Florentine painters by the market compared to what is predicted by the biographical space dedicated by Vasari. And this is indeed the case. Correcting for the bias of Vasari, I can amend my previous findings and conclude that, starting from the average Vasari index, doubling it increases the predicted price of a Florentine painter by 10 percent and of the other (non-Florentine) painters by 48 percent. Both coefficients are largely significant and the R² increases from 49 percent in the baseline specification to 56 percent, confirming the predictive power of the Vasari index for pricing.Footnote 45
Regional Destinations
In column (5) I augment the basic specification with dummy variables Id for the main regional destinations d, namely Tuscany, which is the omitted category, the Papal States, the Duchy of Milan, the Republic of Venice, and other destinations with coefficients δd. I also control for paintings destined to minor destinations with the dummy variable Imi with coefficient δm. This gives the estimating equation:
 $p{ & _{ijt}} = \alpha + \sum\nolimits_\tau {{\varphi _\tau }{I_{\tau t}} + \beta {X_i} + {\alpha _1}{A_{jt}} + {\alpha _2}A_{jt}^2 + \sum\nolimits_d {{\delta _d}{I_{dj}} + {\delta _m}{I_{mi}} + {\varepsilon _{ijt}}} } .$
Focusing on real prices and taking into account the characteristics of the paintings, as well as the age of the painters, reduces substantially the inter-regional price differences (compared to the large differences in the nominal prices in Table 1). Nevertheless, paintings destined to the Papal States and other destinations still exhibit prices that are higher compared to those for Tuscany and Venice, and the commissions from minor destinations appear to be associated with a substantial discount.Footnote 46 Similar results (in unreported regressions) emerge when I control for the regional origins of the painters, though the price differentials are slightly reduced—while the coefficients for the school dummies remain similar to those of regression in column (4) and not significantly different from zero.
I finally present the full specification controlling for quality through the artists fixed effects for the half of the painters that have multiple observations, but without dummies for the regional schools to avoid multicollinearity. The estimating equation is:
 $p{ & _{ijt}} = \alpha + \sum\nolimits_\tau {{\varphi _\tau }{I_{\tau t}} + \sum\nolimits_j {{\theta _j}{I_j} + } \beta {X_i} + {\alpha _1}{A_{jt}} + {\alpha _2}A_{jt}^2 + \sum\nolimits_d {{\delta _d}{I_{dj}} + {\delta _m}{I_{mi}} + {\varepsilon _{ijt}}} } .$
Here θj is the fixed effect of artist j and all the other variables have been used in earlier regressions. The full specification confirms all the previous qualitative results, but now the coefficients for the regional destinations or for the minor destinations are no longer significant. This suggests that market forces were in operation exploiting any arbitrage opportunities in the primary trade of paintings across regions. Higher quality painters could command higher prices relative to lower quality painters, but could not find higher profits by systematically selling to one region compared to another (otherwise sales of other painters to that region would have fixed such a disequilibrium). Notice that I am not denying the established fact that commissions reached higher prices in Rome by the beginning of the 1500s; what I am emphasizing is that the higher quality of the painters moving to Rome or painting for Rome and the objective features of the paintings destined to that town could explain most of the price differentials.
The Remuneration of the Painters
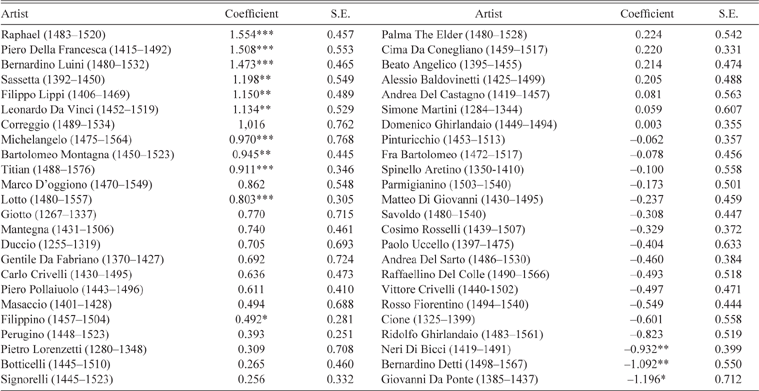
The full specification of column (6) allows me to obtain the coefficients of the fixed effects for the forty-eight painters with multiple observations in the dataset. The remaining observations for painters with a single painting in the dataset constitute the omitted category, therefore the coefficients reported in Table 3 are relative to this pool.Footnote 47 In this comparison Raphael appears as the best paid painter during Renaissance, followed by Piero della Francesca, and Bernardino Luini (a pupil of Leonardo),Footnote 48 but also the other leading Florentine masters, Leonardo and Michelangelo, and the leading Venetian artist, Titian, appear high in this scale.
Some older masters of the fourteenth century, such as Giotto, Duccio, and Pietro Lorenzetti appear well ranked, while the less famous Cione and Spinello Aretino obtained much lower compensations during the same century. Top ranked artists of the fifteenth century include a mix of old style artists such as Sassetta, Carlo Crivelli,Footnote 49 or Gentile da Fabriano and innovators such as Filippo Lippi, Mantegna,Footnote 50 Pollaiuolo, and Masaccio; lower compensations appear associated with less innovative professionists of this century such as Giovanni da Ponte, Neri di Bicci, and Matteo di Giovanni, but also with some important masters such as Paolo Uccello and Andrea del Castagno.Footnote 51 In the early sixteenth century, artists considered provincial such as Bartolomeo Montagna, Lorenzo Lotto,Footnote 52 and Marco d’Oggiono could occasionally reach comparable prices to the best masters of the time including Correggio, Titian, and the top Florentine painters. Celebrated artists such as Palma the Elder and Cima da Conegliano in Venice or Filippino, Perugino, and Botticelli in central Italy could command prices above average. At the same time, few of the most important masters, such as Pinturicchio, Fra’ Bartolomeo, and Andrea del Sarto, appear to have been paid below average.Footnote 53 Overall, this special ranking appears to broadly match the hierarchies of the time: as a back of the envelope check, the plain correlation between artists fixed effects and the Vasari index is 31 percent, and controlling for the bias in favour of Florentine painters it exceeds 50 percent, which confirms the validity of the index as an instrument for quality as perceived and priced at the time.
A Price Index for Renaissance Paintings
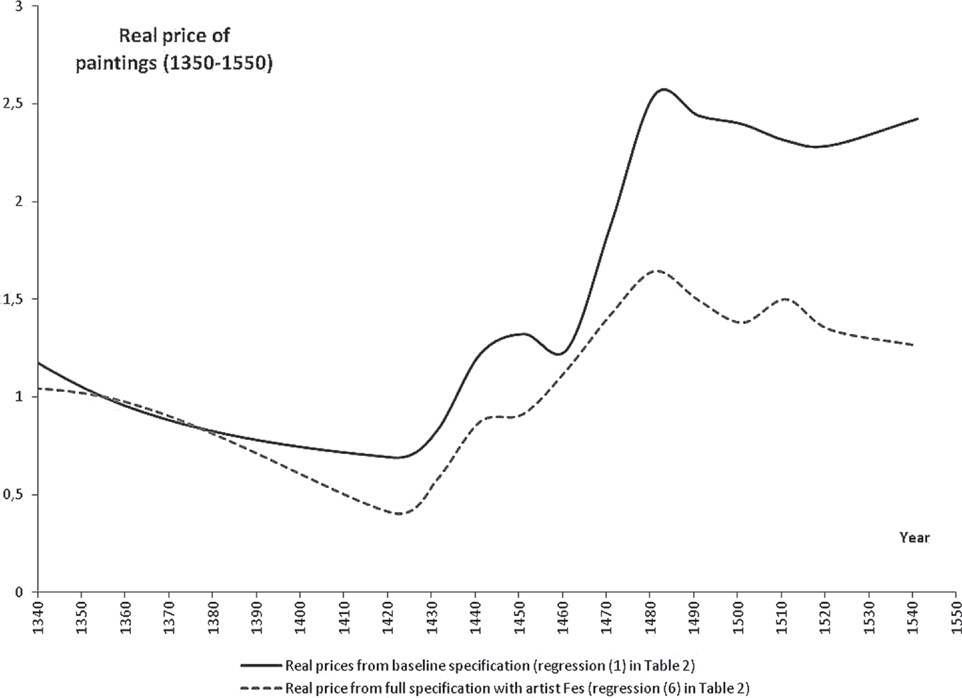
In Figure 6, I report our results for two hedonic price indexes of the primary market for paintings during Renaissance. Both are based on dummy variables for different decades as 1421–1430, 1431–1440, 1441–1450, and so on until 1550, plus two dummies for the earlier periods with a lower number of observations, namely before and after 1355, which is the reference year for which the price index is unitary. The figure reports polynomial interpolations. The first price index (the bold smoothed line in Figure 6) is based on the baseline regression of column (1) in Table 2, which controls for the quantifiable characteristics of the paintings, but not of the painters. Accordingly, this index reflects the evolution of the expected profitability of the artistic profession in terms of purchasing power obtained from a given commission. Since its changes can be due to changes in the quality of paintings over time, I build a second price index (dotted line in Figure 6) based on the full specification in Table 2, column (6), which controls for the painters’ fixed effects. On the basis of the available data, this index reflects the profitability that a painter of a given talent should expect over time.
Hedonic Price Index for Renaissance Italy

The first observation is that both indexes show a slow decline in real prices up to the 1420s, when the real price of paintings starts a rapid increase that continued for all the rest of the century. This process is more spectacular for the expected profitability of painting (the index based on the baseline regression), which suggests that the artistic profession itself was becoming more profitable. The expected compensations of a young apprentice (unaware of his future talent) were increasing during the fifteenth century. But a similar increase in profitability also applies conditioning on the talent of the painter: the index of the expected compensation of a given painter (the one based on the full regression with artists’ fixed effects) reaches levels in the 1480s that are about three times those of the 1420s. This suggests that the quality of the active painters was increasing over time, but artists of any talent during the mid 1400s could expect an increase in their compensations along their career.Footnote 54 Finally, notice that in the first half of the sixteenth century the real price of paintings finally stabilized at a relatively high level, which, as I argued, was not differentiated between regions.
This evolution suggests a Schumpeterian pattern. Part of the artistic creativity associated with Renaissance, and the artistic innovations of this period, such as the introduction of exact perspective (since the 1420s), oil colors (around the 1470s), the sfumato (with Leonardo), the colorito (with Titian), and an impressive differentiation of styles, may be due to increasing profitability of the profession made possible by the increasing demand for artistic goods. My data do not allow me to test directly for causality, but show for the first time that the expected profitability of the artistic profession was increasing rapidly during the fifteenth century compared to the profitability of other professions (since we adjust prices for the purchasing power in terms of unskilled work). We should not underestimate the opinion of a privileged contemporary, Vasari, who repeatedly cited competition as a main driver of the achievements of the Florentine painters.Footnote 55
From an economic point of view, it is important to remark that a direct consequence of higher demand in a monopolistically competitive market could be either the endogenous entry of new painters or an increase of investment in the production of quality. We do not have reliable data on the number of active painters during Renaissance and, most of all, we do not have time series data to verify variations in the entry process. It is likely that the artistic profession attracted an increasing number of painters during the Early Renaissance, but notice that such a process would tend to intensify competition and depress prices which is consistent with declining prices until the 1420s. After that, the fragmentary information available suggests that the number of painters reached a steady state in the main towns (Goldthwaite Reference Goldthwaite2009). This number was lower than in other important artistic centers as those located in the Flanders. Neil De Marchi and Hans J. van Miegroet (Reference De Marchi, van Miegroet, Victor and David2006) estimate 0.8 artists per thousand inhabitants in Florence around 1470–1472, which is well below the 1.4 figure for Bruges in the same years, which actually doubled ten years later. They also estimate 0.8 artists per thousand inhabitants in Venice in 1530, which is again below the 1.7 and 2.4 figures recorded for Bruges and Antwerp in the 1520s.
In a market characterized by monopolistic competition higher demand may otherwise induce competition in quality. If the premium on quality is high (i.e., the elasticity of demand with respect to quality is high) and it is relatively cheap to increase quality (i.e., the elasticity of quality to increased costs and effort is high), we would expect a quality race between painters.Footnote 56 O’Malley (Reference O’Malley2005, Reference O’Malley2013) has analyzed in detail the nature of the costs of painting for the main workshops without emphasizing relevant trends in the cost of painter’s materials or changes in the apprentice system and in the costs associated with the guilds’ activities. While some of the workshops of late Renaissance were real enterprises for the standard of the time (as in case of Squarcione, Ghirlandaio, and later, Raphael), the same could be said for the workshops of early masters such as Giotto, who was active in an extensive territory with a wide set of assistants. This organization of the artistic activity could definitely generate scale economies and quality improvements in production, but there is no evidence that its use changed over time in a significant way. What probably changed over time was the intellectual effort that painters dedicated to prepare preliminary drawings, to reach a higher originality in the compositions, to reproduce human figures and landscape in a more realistic way, to differentiate their styles, and ultimately to gain reputation with the purpose of obtaining better commissions. Without overemphasizing what a still limited and unbalanced dataset can tell us, we should recognize that a real price of artworks increasing when taking as fixed quantifiable characteristics, the identity of the artist and the age of execution must reflect an increase in intrinsic quality as perceived and evaluated by the buyers.
The final question one cannot elude when speculating about Renaissance is how could so many great artists flourish in such small towns over such a short period of time. An economic perspective suggests that it was the unprecedented increase in relative demand for artistic goods by wealthy patrons ready to compete for (and able to judge) quality in an interregional market that attracted large enough groups of painters in towns such as Florence, Venice, and Rome. Competition incentivized these painters to differentiate styles and compete in quality, where higher quality was interpreted as the ability to solve a series of new technical problems in the realistic reproduction of the world in painted images. Under these rules of the game, positive externalities from the close interaction of painters in these towns strengthened their innovative ability.
Conclusion
I analyzed the art market in Renaissance Italy using a unique dataset on primary commissions for figurative paintings, finding preliminary evidence of a competitive market where, after controlling for quality, I have not found any significant price difference across different regional destinations which suggests that market forces were in operation. The hedonic price index exhibits a sharp increase in the real price of paintings, suggesting that the artistic creativity associated with Renaissance may have been driven by the increasing profitability of the profession of painter. It would be interesting to verify if something similar happened in other fields, since this period was associated with a strictly related resurgence of creativity in sculpture (Michelangelo), architecture (Raphael), and even science (Leonardo).
The main center of Renaissance, Florence, started a slow artistic decline in the middle of the sixteenth century, gradually replaced by Rome as the center of commissions and artistic innovations. At the same time, the other gravity center of Renaissance, Venice, continued a long period of fertile creativity. Explaining these divergent paths is not easy, but economic factors appear to be critical once again. Besides losing its position in trade, Florence gradually fell under the centralized dominance of the Medici family during the sixteenth century, which reduced rivalry between other noble families, and decreased the demand for public commissions and artworks in general. Venice remained a trade center governed by a variety of families competing for power as well as for public visibility, and artistic commissions did not decline for a long time.