Introduction
The interaction of water with surfaces is of major importance in many environmentally and technologically relevant processes, including electrochemistry, corrosion, atmospheric chemistry, weathering, materials science, solar water splitting, and catalysis. Thus, an enormous amount of research work, both experimental and computational, has been put into the understanding of water–surface interaction at different levels of complexity, from the single-molecule level to thin water films and bulk liquid water. Fundamental surface science studies with single-crystalline substrates and using advanced microscopic and spectroscopic surface science analytical methods have greatly contributed to the advancement of the understanding of water–solid interfaces as documented in a number of review articles [Reference Thiel and Madey1, Reference Henderson2, Reference Verdaguer, Sacha, Bluhm and Salmeron3, Reference Ewing4, Reference Brown, Henrich, Casey, Clark, Eggleston, Felmy, Goodman, Grätzel, Maciel, McCarthy, Nealson, Sverjensky, Toney and Zachara5, Reference Bjornehohn, Hansen, Hodgson, Liu, Limmer, Michaelides, Pedevilla, Rossmeisl, Shen, Tocci, Tyrode, Walz, Werner and Bluhm6]. Among the surfaces studied, perhaps the most detailed information is nowadays available for single-crystalline metal substrates, for which the interaction with water is typically rather weak. Atomistic insight into the structural details of water clusters, chain-like structures, and two-dimensional networks formed at low temperature has become available from scanning tunneling microscopy (STM) and infrared studies in combination with calculations using density functional theory (DFT). It is now well established that the nature of the substrate, its lattice spacing, and the subtle balance between molecule–substrate interaction and intermolecular hydrogen bond interaction have profound impact on the adsorption and arrangement of water molecules on metal surfaces [Reference Hodgson and Haq7, Reference Carrasco, Hodgson and Michaelides8].
In contrast to metal surfaces, the chemistry at water–oxide interfaces is much more complex and atomic- and molecular-level understanding based on surface science investigations of these interfaces is just emerging. Generally, oxide surface termination [Reference Rao, Kolb, Hwang, Pedersen, Mehta, You, Stoerzinger, Feng, Zhou, Bluhm, Giordano, Stephens and Shao-Horn9, Reference Schwarz, Faisal, Mohr, Hohner, Werner, Xu, Skala, Tsud, Prince, Matolin, Lykhach and Libuda10], acid–base properties [Reference Hu, Carrasco, Klimes and Michaelides11], and the abundance of defects influence the adsorption mode of water, which can be molecular or dissociative. While early interpretation of water–oxide interaction was mainly based on the single-molecule interaction schemes, recent developments in computational and also experimental methodologies, e.g., in scanning probe techniques, have revealed a rich behavior of water on various oxide surfaces, which often depends on the water coverage and is to a large extent determined by intermolecular interactions between molecular water and hydroxyl species. These interactions can, for example, lead to the stabilization of dissociated water in water clusters [Reference Mu, Zhao, Dohnalek and Gong12, Reference Meier, Hulva, Jakub, Pavelec, Setvin, Bliem, Schmid, Diebold, Franchini and Parkinson13] or give rise to the formation of extended two-dimensional water overlayers on oxides [Reference Wlodarczyk, Sierka, Kwapien, Sauer, Carrasco, Aumer, Gomes, Sterrer and Freund14]. The understanding of the fundamental interaction of water with single-crystalline oxide surfaces under ultrahigh vacuum (UHV) conditions is the basis for more detailed investigations of oxides under environmentally more relevant conditions, e.g., ambient pressure and bulk-liquid water [Reference Brown, Henrich, Casey, Clark, Eggleston, Felmy, Goodman, Grätzel, Maciel, McCarthy, Nealson, Sverjensky, Toney and Zachara5, Reference Bjornehohn, Hansen, Hodgson, Liu, Limmer, Michaelides, Pedevilla, Rossmeisl, Shen, Tocci, Tyrode, Walz, Werner and Bluhm6, Reference Fenter and Sturchio15], where surface restructuring by enhanced hydroxylation and oxide hydrolysis, and possible dissolution of the oxide have to be taken into consideration.
Naturally, the surfaces of oxide bulk single-crystals are often chosen as substrates for studying water–oxide interaction. MgO(001) [Reference Heidberg, Redlich and Wetter16] and ZnO $\left( {10\bar{1}0} \right)$ [Reference Meyer, Marx, Dulub, Diebold, Kunat, Langenberg and Wöll17] were the first examples where ordered water superstructures have been found, but TiO2(110) is certainly the oxide that has attracted most attention [Reference Mu, Zhao, Dohnalek and Gong12, Reference Brookes, Muryn and Thornton18, Reference Balajka, Hines, DeBenedetti, Komora, Pavelec, Schmid and Diebold19, Reference Diebold20] because of its importance in photocatalytic water splitting. Alternatively to single-crystal bulk oxides, single-crystalline thin oxide films grown on metal single-crystals are used as substrates to avoid problems such as the segregation of bulk impurities or charging of insulating samples. Another problem that is circumvented by the use of thin oxide films is the often very small reflectivity of bulk oxide single crystals. This is particularly severe for infrared reflection absorption spectroscopy (IRAS) studies on bulk oxides, although much progress in the enhancement of signal-to-noise ratio has been achieved in the past years through improved instrumentation [Reference Kimmel, Baer, Petrik, VandeVondele, Rousseau and Mundy21, Reference Petrik and Kimmel22, Reference Wang and Wöll23]. The number of thin film model systems that have been prepared and characterized in the past is enormous and covers almost all binary oxides existing in the bulk [Reference Freund, Kuhlenbeck and Staemmler24, Reference Campbell25, Reference Netzer and Fortunelli26, Reference Nilius27]. In fact, the variability of thin film oxides is even larger than that of their bulk counterparts. The reason can be found in the much higher structural and compositional flexibility of oxide films of few-monolayer (ML) thickness, giving rise to a plethora of nonstoichiometric, strained, and polar structures that would be unstable in the bulk limit [Reference Freund, Kuhlenbeck and Staemmler24, Reference Surnev, Ramsey and Netzer28]. Moreover, the geometric template effect of the substrate combined with different electronic coupling schemes is able to stabilize various unusual thin film configurations [Reference Netzer and Fortunelli26, Reference Kresse, Schmid, Napetschnig, Shishkin, Köhler and Varga29].
In this article, we present an overview of recent surface science investigations into water–oxide interaction with metal-supported, single-crystalline thin oxide films as substrates, with focus on stoichiometric and bulk-like thin film oxides, carried out in the authors’ laboratories. After a brief introduction into the structural properties of the oxide films discussed in this article (section “Structural properties of epitaxial oxide films”), we first present results about the formation of ordered hydroxyl–water overlayers in UHV conditions on the alkaline earth oxides (MgO and CaO) and on magnetite (Fe3O4) [section “Ordered water structures on MgO(001), CaO(001), and Fe3O4(111)”]. Stable hydroxylation of MgO, monolayer FeO, and silica is difficult to achieve by simple water dosing in UHV. Therefore, section “Hydroxylation of thin oxide films” describes experimental results from hydroxylation studies carried out either at elevated pressure or by electron-assisted enhancement of hydroxylation. Finally, the focus of sections “Stability and dissolution of thin oxide films in aqueous solutions” and “Water–silica interface” is laid on the stability and dissolution of thin oxide films in aqueous solutions. The experimental results obtained with infrared and photoemission spectroscopy, temperature-programmed desorption, and scanning probe microscopies are supported by DFT calculations carried out by collaborators.
Structural properties of epitaxial oxide films
In the following, we will introduce some of the oxide films explored in our group, including binary ionic alkaline earth oxides with simple rock salt structure, bilayer silica, and magnetite (Fe3O4) as an example of a transition metal oxide, which can pose considerable challenges with respect to possible surface terminations. The structural properties provide the necessary basis for the subsequent discussion of their interaction with water.
MgO and CaO(100) films
The two rock salt oxides MgO and CaO are prominent model systems for chemically and catalytically driven surface science studies [Reference Henry30]. Their importance relies on several aspects. The rock salt oxides are characterized by particularly simple structural and electronic properties, i.e., a cubic unit cell with two atoms in the base, and a wide electronic band gap, respectively. As a consequence, they are highly accessible to theoretical calculations, but can also be prepared on a variety of squared atomic lattices with matching dimensions. Suitable supports for MgO (lattice parameter 4.2 Å) are Ag(001) [Reference Schintke, Messerli, Pivetta, Patthey, Libioulle, Stengel, De Vita and Schneider31], Fe(001) [Reference Klaua, Ullmann, Barthel, Wulfhekel, Kirschner, Urban, Monchesky, Enders, Cochran and Heinrich32], and Mo(001) [Reference Wu, Corneille, Estrada, He and Goodman33, Reference Benedetti, Benia, Nilius, Valeri and Freund34], while CaO (lattice parameter 4.8 Å) is typically grown on Mo(001) [Reference Shao, Myrach, Nilius and Freund35]. Given the symmetry of the support, the rock salt layers develop their thermodynamically preferred (100) termination that is both structurally compact and charge compensated (Fig. 1). Attempts to stabilize alternative rock salt surfaces, e.g., the (111) termination, turned out to be challenging at least in an UHV environment [Reference Nilius, Benedetti, Pan, Myrach, Noguera, Giordano and Goniakowski36]. This can be explained with the polar nature of the hexagonal rock salt plane, which needs to be compensated for either by surface reconstruction or by adsorption of charged ad-species [Reference Goniakowski, Finocchi and Noguera37, Reference Finocchi, Barbier, Jupille and Noguera38].
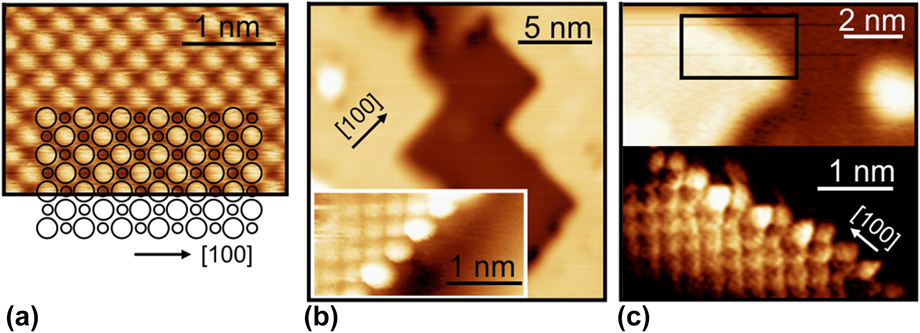
Low-temperature STM images of a 4-ML MgO(100) film on Ag(001), showing an atomically resolved terrace region (a), overview and atomically resolved images of a regular step edge (b), and an irregular step edge (c). Only one ionic sublattice of the MgO is resolved in the measurement.

The structural quality of MgO(001) and CaO(001) films is largely governed by a nonperfect lattice match with the support, which induces interfacial lattice strain and needs to be released by structural distortions in the film. Not surprisingly, relatively smooth and homogenous MgO(001) films have been grown on Ag(001) that features only 3% lattice mismatch with bulk MgO (Fig. 1) [Reference Schintke, Messerli, Pivetta, Patthey, Libioulle, Stengel, De Vita and Schneider31]. The film quality can be further improved by postannealing these layers at 773 K, followed by a slow cooling down procedure [Reference Pal, Smerieri, Celasco, Savio, Vattuone and Rocca39, Reference Pal, Smerieri, Celasco, Savio, Vattuone, Ferrando, Tosoni, Giordano, Pacchioni and Rocca40]. The lattice mismatch due to Mo(001) is considerably larger (5.3%) and results in the development of a dense dislocation network to compensate the strain [Reference Benedetti, Benia, Nilius, Valeri and Freund34]. These line defects share a number of properties with the grain boundaries in realistic, polycrystalline MgO and shall thus been discussed in more detail [Reference McKenna and Shluger41].
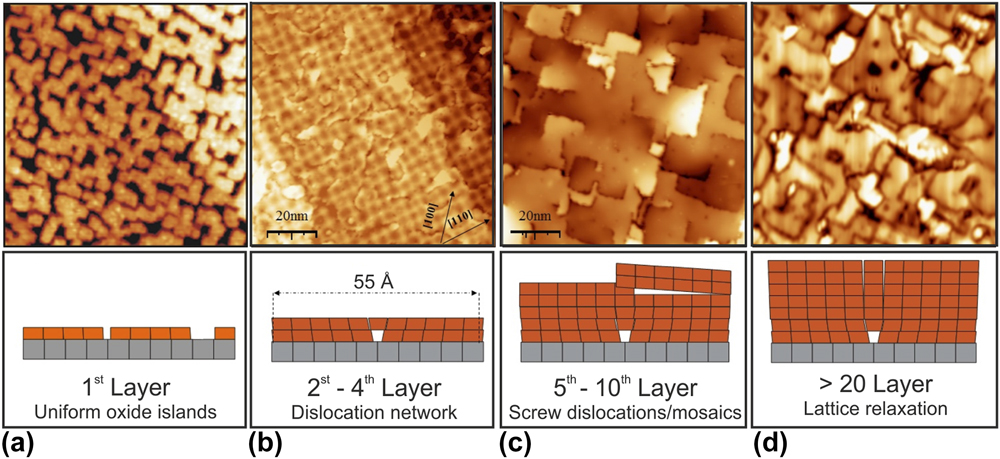
The dislocation network has a periodicity of 55–60 Å with straight defect lines running parallel to the MgO[110] direction, as revealed with STM and GIXD in real and reciprocal space, respectively [Reference Benedetti, Torelli, Valeri, Benia, Nilius and Renaud42]. Along these directions, an extra Mg–O row that has no counterpart in the Mo support is introduced for 18 regular oxide rows. The result is a (19 × 19) MgO on (18 × 18) Mo coincidence lattice with square symmetry (Fig. 2). On the atomic scale, the dislocation network is associated with periodic switches of the interface registry, changing from O to Mg ions sitting atop the Mo atoms of the support. Energetically, the O–Mo registry is preferred, as reflected in a shorter interface binding length (2.3 Å) as compared to the Mg–Mo domains (3.5 Å) [Reference Benedetti, Stavale, Valeri, Noguera, Freund, Goniakowski and Nilius43]. As the O–Mo and Mg–Mo regions lie on different height levels, the MgO film develops a considerable mosaicity, being reflected in a prominent splitting of the fundamental MgO spots in low-energy electron diffraction (LEED) data [Reference Benedetti, Torelli, Valeri, Benia, Nilius and Renaud42]. The modulated interface distance also produces a work function pattern on the MgO film, in which high work function values are found for the Mg–Mo registry, while values for the O–Mo domains are 1.5 eV lower. The difference can be explained with the suppressed electron spill-out from the Mo support at the compact O–Mo interface [Reference Giordano, Cinquini and Pacchioni44]. The reduced thermodynamic stability of the Mg–Mo registry finally leads to a higher concentration of point defects in these domains [Reference Benia, Myrach, Nilius and Freund45]. The strain-induced dislocation network on MgO/Mo thin films gives rise to a spatially modulated adsorption behavior that can be exploited as template for the preparation of well-ordered ensembles of metal particles [Reference Benedetti, Stavale, Valeri, Noguera, Freund, Goniakowski and Nilius43].
STM images showing several states of strain relaxation in MgO thin films on a Mo(001) support (100 × 100 nm2, V S = 4.0 V) (a) Submonolayer coverage with square-shaped MgO islands. Their size is controlled by the interfacial lattice strain. (b) 3 ML thick film displaying a squared coincidence lattice. (c) 7 ML thick film characterized by wide, atomically flat terraces, separated by edge and screw dislocations. (d) 18 ML film with bulk-like lattice parameter. The image quality in (d) is degraded due to the vanishing conductivity of thick MgO layers.

With increasing oxide thickness, additional defect types develop next to the dislocation network (Fig. 2). Prominent defects at 10 ML film thickness are screw and edge dislocations, the latter being aligned with the nonpolar MgO[100] direction [Reference Benedetti, Torelli, Valeri, Benia, Nilius and Renaud42]. Also point defects, in particular oxygen vacancies, become more abundant. They mostly locate along step edges, where the atomic coordination is reduced with respect to atoms embedded in a compact terrace. The lattice position of oxygen vacancies has been thoroughly characterized by angle-dependent EPR measurements in combination with scanning probe techniques [Reference Sterrer, Fischbach, Risse and Freund46, Reference Sterrer, Fischbach, Heyde, Nilius, Rust, Risse and Freund47].
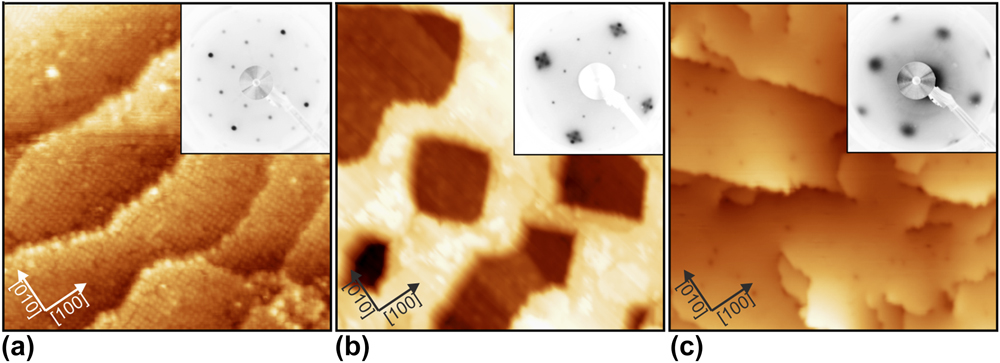
CaO thin films have been prepared on Mo(001) substrates as well. Here, the impact of the lattice mismatch is even larger (8.1%) and triggers an alternative strain-relaxation scheme at the interface. To reduce compressive strain, Mo ions are incorporated into the first Ca–O layer in a highly ordered fashion. This becomes evident in a sharp (2 × 2) superstructure, seen both in electron diffraction and in STM measurements of the first oxide layers (Fig. 3) [Reference Shao, Myrach, Nilius and Freund35]. Driving force for the formation of a Ca–Mo mixed oxide at the interface is the lower Mo–O binding length (1.9 Å) with respect to the Ca–O bulk value (2.4 Å). Moreover, the mixed system experiences substantial thermodynamic stabilization, arising from the large oxidation enthalpy of Mo [Reference Shao, Nilius, Myrach, Freund, Martinez, Prada, Giordano and Pacchioni48]. Given a high diffusion barrier, the influx of Mo atoms diminishes with increasing oxide thickness and formation of mixed Ca–Mo oxide terminates at about 4 ML. Beyond this limit, essentially unstrained CaO rock salt islands evolve on the surface and merge to a flat, (001)-terminated film at 10–15 ML total thickness (Fig. 3). However, even in this stage Mo ions can be detected in the rock salt lattice, distinctively affecting the chemical activity of the CaO/Mo(001) systems, for example in oxygen activation [Reference Cui, Shao, Baldofski, Sauer, Nilius and Freund49].
STM topographic images of CaO films of increasing thickness (a): 3 ML (25 × 25 nm2), (b) 5 ML (30 × 30 nm2), (c) 10 ML (100 × 100 nm2). The insets depict the associated LEED patterns, showing a (2 × 2) superstructure in (a), a mixture of (2 × 2) and facetted CaO (1 × 1) in (b) and pristine CaO (1 × 1) in (c).

Silica film
The alkaline earth oxides discussed above represent a class of oxides, which tends to crystallize in a well-defined simple lattice driven by the Madelung potential of the highly ionic system. Even such prototypical ionic systems exhibit considerable structural complexity, in particular with respect to the defect structure. Another level of complexity arises if the system under consideration tends to form amorphous structures.
The prototype for amorphous network structures is silicon dioxide. This material is the simplest and most common type of glass. Many elements and compounds can form glasses and some of the oldest man-made objects found are made from glassy materials [Reference Sastry, Debenedetti and Stillinger50, Reference Zallen51, Reference Berthier and Biroli52]. Glass materials and especially silicates are relevant in nature and various branches of modern technologies, e.g., in semiconductor devices, in optical fibers, and as a support in industrial catalysis [Reference Mauro and Zanotto53]. To push this material class forward and to understand chemical reaction at surfaces, we should characterize their structures and properties at the atomic scale.
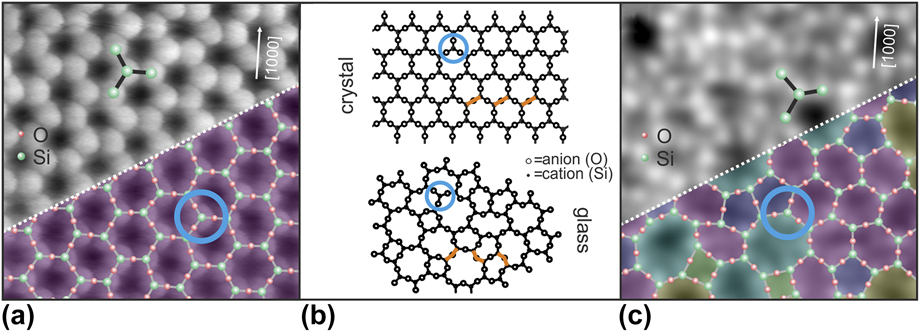
Zachariasen’s postulates laid the foundation to the so-called “random network theory” 80 years ago to explain the structure of amorphous materials [Reference Zachariasen54]. Due to the comparable mechanical properties of amorphous and crystalline materials, he assumed that the bonding forces between the atoms in the two phases should be essentially identical. The lack of periodicity and symmetry are the main features that distinguish a glass from a crystal. Early on, it had been suggested that tetrahedral atomic configurations were required to form glasses. Zachariasen used these predictions to sketch an atomic picture of a glass. In his paper, he reduced the three-dimensional (3D) picture into a two-dimensional (2D) analogy [Fig. 4(b)]. For silicon dioxide, the simplest structural unit in the 3D case is a SiO4 tetrahedron. If the complexity of the system is reduced from 3D to 2D, the simplest structural unit for silicon dioxide changes from the SiO4 tetrahedron to a SiO3 triangle. The blue circle in Fig. 4 marks the SiO3 building unit. The SiO3 triangles are linked to each other as individual building blocks at fixed 180° angles, corresponding to a crystalline material. This creates long-range order and periodicity. If the angle between these structural units varies, the building blocks can develop an extended network with rings of different sizes. As can be seen in Fig. 4(b) (bottom), the uniform structural units are linked to each other at apparently random angles. Zachariasen drew a 2D diagram in which trigonal units are linked together to create the amorphous network. Due to the large variety of Si–O–Si angles which bridge two neighboring building units, the glass structure lacks long-range order.
Atomically resolved crystalline and vitreous regions of the thin silica film by STM [the scan area of image (a) and (c) is 3.5 × 3.5 nm] [Reference Lichtenstein, Heyde and Freund55]. An atomic model of the topmost layer of the silica film is superimposed onto the lower section of the images in (a) and (c) (green balls: Si atoms, red balls: O atoms). Zachariasen’s scheme of crystalline and glass network structures is given in (b) for comparison [Reference Zachariasen54].

We have developed a recipe to grow thin silica bilayer films on Ru(0001). This film system verifies the complex atomic arrangement of the random network theory with striking similarity. The observed protrusions at atomic separations in the STM images shown in Figs. 4(a) and 4(c) are arranged in propeller-shaped structures. By comparison with Zachariasen’s model and based on this propeller symmetry, the protrusions can be assigned to Si atoms [green balls in Figs. 4(a) and 4(c)]. Such propeller-shaped units have been separately marked in Fig. 4. Here, a Si-sensitive contrast is observed and the position of the O atoms has been calculated based on the Si coordinates. In this way, the 2D model of the topmost O and Si atoms has been completed. Note that a modified tip termination can make the O instead of the Si positions visible [Reference Lichtenstein, Heyde and Freund55]. This silica film develops crystalline structures [Reference Löffler, Uhlrich, Baron, Yang, Yu, Lichtenstein, Heinke, Büchner, Heyde, Shaikhutdinov, Freund, Włodarczyk, Sierka and Sauer56], but also verifies Zachariasen’s predictions of a vitreous random network for a glass [Reference Lichtenstein, Büchner, Yang, Shaikhutdinov, Heyde, Sierka, Włodarczyk, Sauer and Freund57].
Besides the separate characterization of each phase, also interface structures between crystalline and amorphous phases have been addressed [Reference Lichtenstein, Heyde and Freund58]. In the glass community, there has always been a controversy about how crystalline and vitreous phases are connected to one another. From the experimental point of view, a real-time observation at the atomic scale of an active front during a glass transition process is not currently feasible. But a static image of such an interface region can be gained. For further details, see Ref. Reference Lichtenstein, Heyde and Freund58.
Furthermore, it should be mentioned that silica bilayer films can be grown on a number of substrates [Reference Lichtenstein, Büchner, Yang, Shaikhutdinov, Heyde, Sierka, Włodarczyk, Sauer and Freund57, Reference Yu, Yang, Boscoboinik, Shaikhutdinov and Freund59, Reference Huang, Kurasch, Srivastava, Skakalova, Kotakoski, Krasheninnikov, Hovden, Mao, Meyer, Smet, Muller and Kaiser60, Reference Altman and Schwarz61], which leaves room for tuning the properties of these films, but also shows that these films resemble a completely new material class of its own.
With these experiments, a clear image of an amorphous material has been obtained which allowed for the first time the derivation of atomic sites and a detailed analysis from real space coordinates. The text book example of the amorphous silica structure proposed by Zachariasen in 1932 has thereby finally been verified. Also, Mo(112) and Pt(111) substrates have been used to prepare thin silica films. Given the stronger interface interaction in this case, those films are generally crystalline and mostly comprise regular networks of six-membered –Si–O– rings.
Iron oxide films
The oxide films discussed so far are simple in the sense that the oxidation state of the constituents is well defined. This restriction is lifted if transition metal oxides are considered. In addition, the ability to form oxides with different formal oxidation states of the cations is associated with changes in the bulk crystal structures. With respect to the atomic structure of the surfaces observed for different oxides, the surface termination becomes a central aspect.
Iron oxides have a wide range of technological applications, ranging from magnetic devices to heterogeneous catalysis [Reference Cornell and Schwertmann62, Reference Ertl, Knözinger, Schueth and Weitkamp63]. This class of materials exhibits rather different magnetic or conducting properties [Reference Zboril, Mashlan and Petridis64] depending on their crystal structures, which is strongly determined by the way of preparation. The morphology and termination of the oxide film have a strong influence on the chemical properties and are, therefore, a subject of intense studies [Reference Weiss and Ranke65, Reference Condon, Leibsle, Parker, Lennie, Vaughan and Thornton66, Reference Barbieri, Weiss, Hove and Somorjai67, Reference Parkinson68, Reference Sala, Marchetto, Qin, Shaikhutdinov, Schmidt and Freund69].
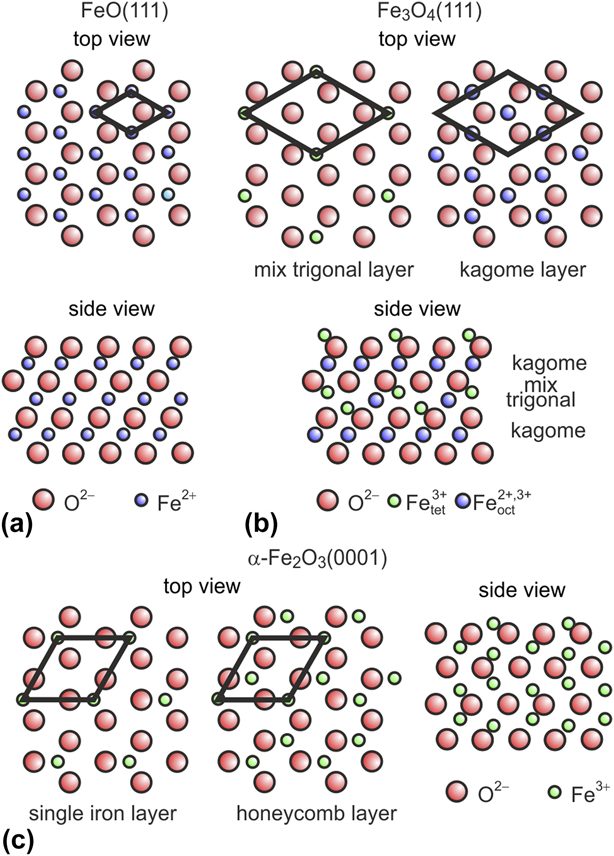
Figure 5 briefly sketches the crystal structures of FeO (wustite), Fe3O4 (magnetite), and α-Fe2O3 (hematite). α-Fe2O3 crystallizes in the corundum structure with a hexagonal unit cell. Along the [0001] direction, the O anions form a close-packed hcp sublattice with ABAB stacking. The Fe3+ species between these layers are arranged in honeycomb (√3 × √3)R30°-like layers. Fe3O4 crystallizes in the inverse spinel structure. The O anions form a close-packed fcc sublattice (ABC stacking along the [111] axis of the lattice) with Fe2+ and Fe3+ cations located in the interstitial sites. The O planes are similar to those in α-Fe2O3. Between the close-packed planes of oxygen ions, either one Kagomé or three hexagonal (mix-trigonal) Fe layers alternate. Both ion sublattices are arranged in a (2 × 2)-like fashion on the close-packed oxygen layer. FeO crystallizes in the rock salt structure; hence, the O and Fe(111) planes form ideal 2D hexagonal lattices with a cubic ABC stacking sequence along the [111] direction. For a more detailed overview of these different crystalline structures and the growth of iron oxide films on Pt(111), see Weiss and Ranke [Reference Weiss and Ranke65].
Models of iron oxides structure for (a) wustite (FeO), (b) magnetite (Fe3O4), and (c) hematite (α-Fe2O3) (adapted from Ref. Reference Weiss and Ranke65).

Hematite films will not be further discussed in this review. FeO(111) forms, when grown on Pt(111), well-ordered monolayer films with the Fe layer in direct contact with the Pt(111) substrate, and a close-packed oxygen layer on top. A peculiar feature of the monolayer FeO(111)/Pt(111) films is the periodic variation in the interface structure imposed by the lattice mismatch between FeO(111) and Pt(111). This leads to the formation of a Moiré superlattice featuring three high-symmetry rotational domains with Fe atoms either at on-top, hcp, or fcc stacking position with respect to the underlying Pt(111) interfacial atoms. Polarity compensation is achieved in the thin film system by charge transfer at the interface and a strong inward relaxation of the oxygen layer. This and the fact that the FeO(111) film is oxygen terminated render the film quite unreactive at UHV conditions.
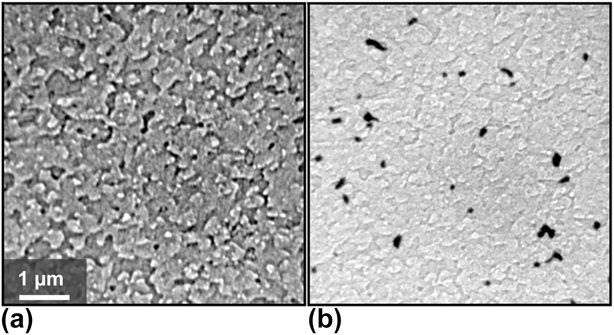
Fe3O4(111) films of about 10 nm thickness on Pt(111) are prepared by repeated cycles of Fe deposition at room temperature and oxidation at elevated temperatures, after one complete FeO layer was formed initially [Reference Weiss and Ranke65]. In each cycle, between 5 and 10 ML of Fe is deposited, oxidized at 1 × 10⁻⁶ mbar of O2 and annealed at 900 K for 5 min. Upon cooling, the oxygen pressure is reduced only after the temperature is below 500 K. By following this procedure, the Pt(111) crystal is completely covered by an Fe3O4 film [Fig. 6(a)].
Morphology of a well-prepared Fe3O4 film, completely covering the Pt(111) support. Both LEEM images show the identical surface area in (a) bright- and (b) dark-field imaging mode, utilizing the (0; 0) and the (1/2; 0) diffraction spots, respectively. The contrast is caused by the morphology. Additionally, domains rotated by 180° become visible as dark areas in the dark-field image [Reference Sala, Marchetto, Qin, Shaikhutdinov, Schmidt and Freund69].

The LEED pattern of the film matches perfectly the one described in the literature [Reference Melzer, Urban, Sack-Kongehl, Weiss, Freund and Schlögl70]. The film consists of terraces up to 100 nm, most of them with polygonal shape. As seen in low energy electron microscopy (LEEM), the step density increased after every deposition and oxidation cycle, especially above 20 nm film thickness. However, the film can be smoothed if the final oxidation treatment is performed at an elevated temperature of about 1000 K. Here, it is necessary that the film is completely closed and thicker than 7 nm; otherwise, the 1000 K annealing step leads to dewetting. A subsequent thermal flash in UHV does not produce further morphological changes, but improves the homogeneity of the surface structure.
Magnetite crystallizes in an inverse spinel structure with space group Fd3m, while the Pt substrate exhibits a fcc structure with space group Fm3m. Therefore, the Fe3O4 islands created by initial nucleation on a clean Pt(111) surface may coalesce with improper stacking [Reference Weiss and Ritter71, Reference Margulies, Parker, Rudee, Spada, Chapman, Aitchison and Berkowitz72] and form a complete film with two twin domains rotated by 180°. Dark-field LEEM studies using the (1/2; 0) and (0; 1/2) spots show a predominance of one rotational domain [Reference Sala, Marchetto, Qin, Shaikhutdinov, Schmidt and Freund69]; the coverage ratio for these rotational domains ranges between 75%/25% and 98%/2%, depending on the preparation condition. Figure 6(b) shows a dark-field LEEM image visualizing the two rotational domains as dominating bright and small black areas. This preponderance is maintained even after subsequent cycles of Fe deposition and oxidation. On average, the rotational domain size is larger than the terrace width; some of the domains are even several µm wide. A comparison between dark-field and bright-field LEEM images shows that the rotational domains preferentially develop in accordance to step bunches of the substrate, providing a partial correlation between substrate morphology and crystallographic inhomogeneities.
We note that, although the (111) surface of Fe3O4 (magnetite) has been investigated for more than twenty years, substantial controversy remains in the literature regarding the surface termination proposed from structural and adsorption studies [Reference Sala, Marchetto, Qin, Shaikhutdinov, Schmidt and Freund69, Reference Ritter and Weiss73, Reference Shaikhutdinov, Ritter, Wang, Over and Weiss74, Reference Lemire, Meyer, Henrich, Shaikhutdinov and Freund75]. It appears that this issue is now solved. Our recent study [Reference Li, Paier, Sauer, Mirabella, Zaki, Ivars-Barceló, Shaikhutdinov and Freund76] showed that IRAS and TPD experimental results of CO adsorption can only be explained under the assumption that the Fe3O4(111) surface is terminated by a 1/4 monolayer of tetrahedrally coordinated Fe3+ ions on top of a close-packed oxygen layer in full agreement with previous I/V LEED studies. However, surface defects play a crucial role in adsorption and may dominate chemical reactions on Fe3O4(111) when exposed to the ambient.
Interaction of water with oxide films
In this section, we review some of the results obtained with the thin oxide films introduced in section “Structural properties of epitaxial oxide films” with regard to water interaction, showing how a combination of different methods allows us to gain atomistic insight into the energetics of adsorption processes as well as the nature of the surface species.
Ordered water structures on MgO(001), CaO(001), and Fe3O4(111)
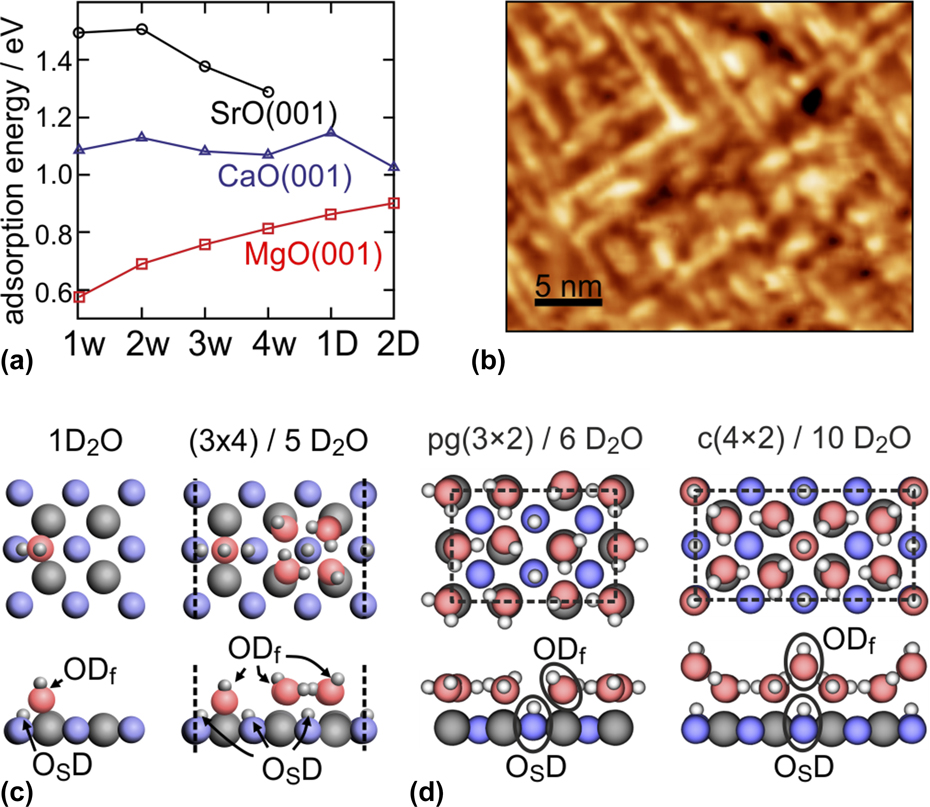
A comparison of water adsorption on the (001) surfaces of the alkaline earth oxides is interesting because they all have the same structure (fcc), but different lattice constants and basicity, which is expected to strongly influence the mode of water adsorption (molecular or dissociative) and the ability to form long-range ordered 2D structures. While monolayer water adsorption on MgO has extensively been studied in the past both experimentally and theoretically and is now well understood, details about the higher alkaline earth oxides such as CaO and SrO have only recently become available. It is well established that a single water molecule adsorbs molecularly on the MgO(001) surface, but may dissociate, even under UHV conditions, on defects such as low-coordinated cation–anion pairs on step edges. By contrast, single-water-molecule adsorption is dissociative on CaO and SrO and involves considerably higher adsorption energies, as shown in Fig. 7(a), which displays the computed adsorption energy, E ads, for water on the various oxides [Reference Zhao, Shao, Fujimori, Bhattacharya, Ghiringhelli, Freund, Sterrer, Nilius and Levchenko77]. The dissociated monomer consists of a dynamic ion pair with the hydroxyl group (“free” OD, ODf) adsorbed in bridge position between two cations and the proton transferred to a nearby oxygen ion [“surface” OD, OSD, Fig. 7(c)] [Reference Carrasco, Illas and Lopez78].
(a) Calculated adsorption energy per water molecule on CaO(001), MgO(001), and SrO(001) for increasing water coverage [1w, etc.: 1 water molecule per (3 × 4) unit cell; 1D: 1-dimensional water–hydroxyl structures; 2D: 2-dimensional water–hydroxyl structures]. (b) RT-STM image (30 × 25 nm2) of 1-dimensional water chains formed on CaO(001). (c) Most stable structures of the dissociated water monomer on CaO(001), the 1-dimensional chain structure on CaO(001), and the two most stable ordered 2-dimensional water phases [pg(3 × 2) and c(4 × 2)] on MgO(001). (Reprinted with permission from Refs. Reference Wlodarczyk, Sierka, Kwapien, Sauer, Carrasco, Aumer, Gomes, Sterrer and Freund14, Reference Zhao, Shao, Fujimori, Bhattacharya, Ghiringhelli, Freund, Sterrer, Nilius and Levchenko77, and Reference Fujimori, Zhao, Shao, Levchenko, Nilius, Sterrer and Freund79. Copyright (2011, 2015, 2016) American Chemical Society.)

An interesting trend is seen for increasing water coverage, i.e., for increasing the number of water molecules per (3 × 4) unit cell used in the calculations: While the adsorption energy increases with increasing coverage for MgO and 2D monolayer structures are found to be the most stable water adsorption states, the calculated E ads for water on CaO(001), although very similar in the entire coverage range, is highest for 1D structures. For SrO, isolated and dissociated monomer and dimer species are expected to be more stable than the oligomer species. Experimentally, evidence for the 2D ordered arrangement of the water monolayer on MgO has been provided by diffraction and scattering methods more than 20 years ago [Reference Heidberg, Redlich and Wetter16, Reference Ferry, Glebov, Senz, Suzanne, Toennies and Weiss80]. More recently, the presence of 1D water structures was proved by STM upon water adsorption on thick CaO(001) films at room temperature [Fig. 7(b)] [Reference Zhao, Shao, Fujimori, Bhattacharya, Ghiringhelli, Freund, Sterrer, Nilius and Levchenko77, Reference Fujimori, Zhao, Shao, Levchenko, Nilius, Sterrer and Freund79], and the confirmation of the dynamic ion pair nature of a single, dissociated water molecule, as well as the stability of dimer species, on SrO has been obtained by STM on SrO-terminated Sr3Ru2O7 [Reference Halwidl, Stöger, Mayr-Schmölzer, Pavelec, Fobes, Peng, Mao, Parkinson, Schmid, Mittendorfer, Redinger and Diebold81].
Generally, diffraction methods and STM do not allow the positions of the individual water species and their chemical nature (molecular or dissociated) within the 1D and 2D water structures found on MgO(001) and CaO(001) to be determined, and one has to resort to high-level computations and spectroscopic methods to learn more about the molecular-scale details of these structures. Whereas electron spectroscopies can provide information about the presence of dissociated and molecular water, which, for example, has provided first experimental proof for the existence of mixed molecular/dissociated water molecules in the water monolayer on MgO(001) [Reference Kim, Lynden-Bell, Alavi, Stulz and Goodman82], comparison of experimentally measured and computationally obtained frequencies of water and hydroxyl vibrations yields additional information about the structural details.
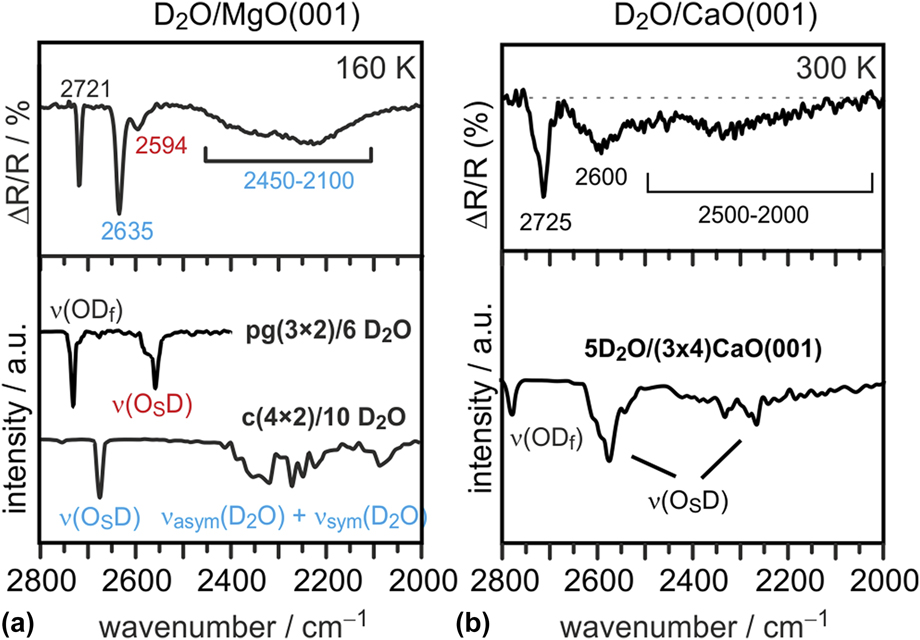
The latter approach has been used to identify and confirm the structural models of the 2D water monolayer on MgO(001) [Reference Wlodarczyk, Sierka, Kwapien, Sauer, Carrasco, Aumer, Gomes, Sterrer and Freund14] and of the 1D chain structures found by STM on CaO(001) [Reference Zhao, Shao, Fujimori, Bhattacharya, Ghiringhelli, Freund, Sterrer, Nilius and Levchenko77, Reference Fujimori, Zhao, Shao, Levchenko, Nilius, Sterrer and Freund79]. Figure 8 shows the experimental IRAS spectra (top panel) for the water monolayer prepared on MgO [Fig. 8(a)] at low temperature (160 K) and for the water chain structures prepared on CaO(001) at room temperature [Fig. 8(b)], and the corresponding calculated anharmonic vibrational spectra (lower panel) (note that the experiments and calculations were performed with D2O instead of H2O). The experimental spectra are qualitatively similar and exhibit reasonably narrow bands in the range 2600–2750 cm−1 and broad absorption between 2000 and 2500 cm−1. The individual spectral contributions can be assigned based on the good agreement between the experimental and calculated spectra of the most stable structures shown in Fig. 7(c). For both, the MgO(001) and CaO(001) surfaces, the ordered water structures are comprised of dissociatively and molecularly adsorbed water. In the case of MgO, two ordered structures with different water coverage, the high-coverage c(4 × 2) and the low-coverage pg(3 × 2) structure, coexist at 160 K and can be distinguished based on the different frequencies of the OSD groups [Reference Wlodarczyk, Sierka, Kwapien, Sauer, Carrasco, Aumer, Gomes, Sterrer and Freund14]. Note that, due to the metal surface selection rule, the molecular water species, which are oriented almost parallel to the surface in both structures, give rise to only weak absorption signals. In fact, they do not contribute to the IR spectrum of the pg(3 × 2) structure. In the case of the c(4 × 2) structure, the molecular water species stabilize the protruding OHf group, and combinations of their symmetric and antisymmetric stretch vibrations lead to signal contributions in the 2100–2400 cm−1 spectral range, which are detected in the experiment as a broad featureless absorption. Molecular water species in the 1D chain structure on CaO(001) are also oriented parallel to the surface and contribute only little to the IR signal on the thin film sample. The more defined signals for water on CaO(001) originate from OHf (at highest wave number) and OSD groups from dissociated water. Note that the OSD groups in the 1D chain structure on CaO(001) are spectrally much more separated than in the 2D structures on MgO because the strength of hydrogen bonding between OSD groups and ODf groups is markedly different in the tetramer unit and in the linker unit, see Fig. 7(c) [Reference Zhao, Shao, Fujimori, Bhattacharya, Ghiringhelli, Freund, Sterrer, Nilius and Levchenko77].
Experimental (top) and computed (bottom) IR spectra of the 2-dimensional water (D2O) structures on MgO(001) (a) and the 1-dimensional water (D2O) chain structure on CaO(001) (b). (Reprinted with permission from Refs. Reference Wlodarczyk, Sierka, Kwapien, Sauer, Carrasco, Aumer, Gomes, Sterrer and Freund14, Reference Zhao, Shao, Fujimori, Bhattacharya, Ghiringhelli, Freund, Sterrer, Nilius and Levchenko77, and Reference Fujimori, Zhao, Shao, Levchenko, Nilius, Sterrer and Freund79. Copyright (2011, 2015, 2016) American Chemical Society.)

The combined experimental and computational analysis of water adsorption on the alkaline earth oxides has not only contributed to a better understanding of the molecular details of water structures, but additionally allows conclusions about the evolution of different structures on the surfaces to be drawn. Dissociation of a single water molecule is favored and involves larger adsorption energies when going from MgO to SrO. This can be explained by the increasing lattice constant and substrate flexibility when descending the AEO series [Reference Hu, Carrasco, Klimes and Michaelides11]. Additionally, the subtle balance between intermolecular and molecule–surface interactions determines also the stability of higher coverage structures: Two-dimensional ordered structures are stabilized on MgO(001) because of the weak interaction between water and the MgO surface and the favorable dimension of the MgO lattice parameter, which allows a strong hydrogen bonding network between adsorbed water and hydroxyl species to be established. The CaO lattice is slightly too large to enable the formation of a hydrogen-bonded network, and the water structures therefore collapse into a 1D configuration at low coverage. Similar 1D assemblies become stable also on MgO(001) when its lattice parameter is artificially increased to reduce the effect of intermolecular coupling. In contrast on SrO(001), the water residuals are always too far away to form uniaxial or 2D hydrogen-bonded arrangements [Reference Zhao, Shao, Fujimori, Bhattacharya, Ghiringhelli, Freund, Sterrer, Nilius and Levchenko77].
The results presented for the alkaline earth oxides demonstrate that not only the acid–base properties of the oxide surface, but also the lattice parameter and hence the ability to form hydrogen bonds between neighboring water molecules and hydroxyl groups have a major impact on the adsorbed water structures. In a further example, vibrational spectroscopy combined with DFT calculations has been used to study the adsorbed water structures formed on well-ordered Fe3O4(111). Analysis of previous studies on water adsorption on Fe3O4(111), both for single crystals and thin films, revealed some controversy in the literature which most likely originated from the experimental difficulties of preparing well-defined, clean, and uniform surfaces. Iron oxide single crystals often expose several coexisting surface structures. Apparently, thin films grown on a metal substrate are more uniform. However, defect structures are still difficult to control and characterize. In addition, surface preparation and even vacuum conditions may play an important role due to adventitious adsorption of residual (CO, water, CO2) gases in the background.
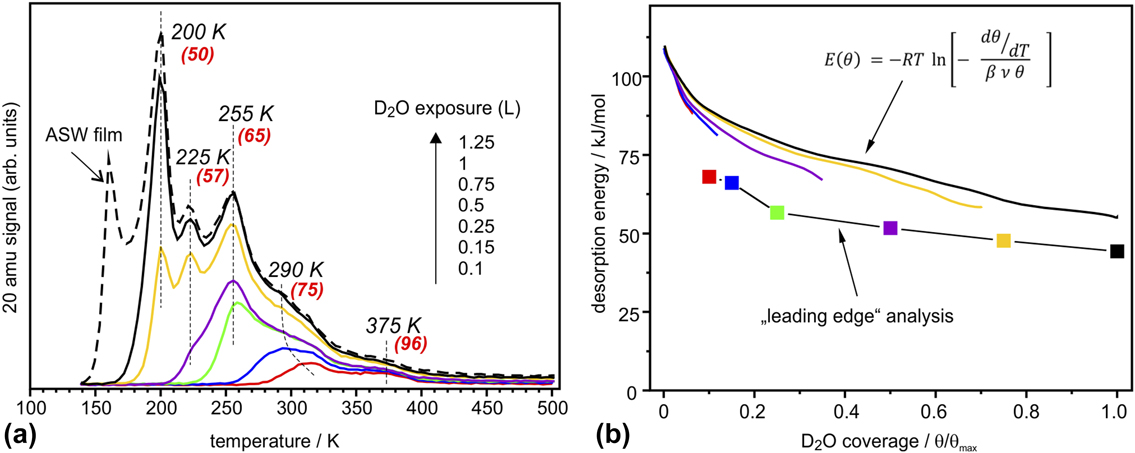
Figure 9(a) shows a series of TPD spectra obtained upon water exposure at 140 K. The peak at 160 K is straightforwardly assigned to the formation of an amorphous solid water (ASW) film. Desorption peaks at 200, 225, and 255 K are sequentially populated following first-order desorption kinetics, whereas the broad signal above 275 K shows characteristics of second-order desorption typical for associative desorption of dissociated water species. The small feature at 375 K is most likely due to adsorption on defect sites. These desorption spectra differ considerably from the previously reported ones in Refs. Reference Leist, Ranke and Al-Shamery83, Reference Joseph, Kuhrs, Ranke, Ritter and Weiss84, Reference Joseph, Ranke and Weiss85 only showing smooth desorption in the 200–300 K region. Using water adsorption on the clean Pt(111) surface as a reference, the saturated amount of water adsorbed on Fe3O4(111) prior to the ASW film formation (θmax) is found to be 2.3 ± 0.2 ML (where 1 ML is defined as one H2O molecule per Fe3O4(111) unit cell exposing one Fe ion, i.e., 3.2 × 1014 cm−2).
(a) TPD spectra of D2O (20 amu) adsorbed at 140 K at increasing exposures as indicated. The heating rate was 3 K/s. At the highest exposure, the formation of an ASW film sets in. The numbers in parenthesis show desorption energies obtained by the Redhead formalism [Reference Redhead86] using a prefactor ν = 1013 s−1. (b) Desorption energy as a function of water coverage obtained by a “leading edge” analysis [Reference de Jong and Niemantsverdriet87] and by inversion analysis of the Polanyi–Wigner equation with a prefactor ν = 1013 s−1. Water coverage is normalized to the maximum obtained before the ASW related peak sets in. (Reproduced from Ref. Reference Mirabella, Zaki, Ivars-Barcelo, Li, Paier, Sauer, Shaikhutdinov and Freund88.)

The Redhead analysis [Reference Redhead86] using the standard prefactor of 1013 s−1 yields desorption energies ranging from 50 kJ/mol for the peak at 200 K up to 95 kJ/mol for the peak at 375 K. A “leading edge” analysis [Reference de Jong and Niemantsverdriet87, Reference Habenschaden and Küppers89], that does not require assumptions on the pre-exponential factor, resulted in an energy of 68 kJ/mol at low coverage that gradually decreased with increasing coverage as shown in Fig. 9(b). Finally, we used inversion analysis of the Polanyi–Wigner equation for first-order desorption kinetics [Reference Tait, Dohnálek, Campbell and Kay90], which resulted in a desorption energy (E): 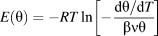 $E\left( \theta \right) = - RT\ln \left[ { - {{{{{\rm{d}}\theta } / {{\rm{d}}T}}} \over {\beta \nu \theta }}} \right]$ where β is the heating rate, ν is a prefactor, and θ(T) is a temperature (or time)-dependent coverage, which is determined by integration of the desorption curve. In this analysis, each spectrum can be transformed into a coverage-dependent energy curve, all plotted in Fig. 9(b), for ν = 1013 s−1. Some deviation between the curves may be indicative of kinetic effects. These results show again that the desorption energy decreases with increasing coverage, most markedly in the low-coverage regime (θ < 0.2).
The differential heats of adsorption of D2O on Fe3O4(111) measured by single-crystal calorimetry [Reference Dementyev, Dostert, Ivars-Barceló, O’Brien, Mirabella, Schauermann, Li, Paier, Sauer and Freund91] revealed basically the same behavior. The measured adsorption energies and their coverage dependence are fully consistent with the TPD results, suggesting that the adsorption and dissociation of water is reversible under the conditions studied.
Well-resolved desorption peaks observed in the TPD spectra [Fig. 9(a)] indicated desorption of species with discrete adsorption energies that desorb almost simultaneously in time, which in turn implies a certain degree of ordering at the surface. Indeed, a LEED study [Reference Mirabella, Zaki, Ivars-Barcelo, Li, Paier, Sauer, Shaikhutdinov and Freund88] revealed additional spots identified as Fe3O4(111)–(2 × 2) structure, which appeared if the sample was exposed to saturation amounts of water at temperatures between 200 and 255 K, i.e., in the range where sharp desorption peaks are observed.
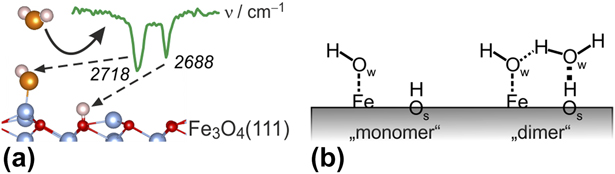
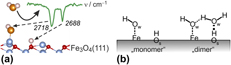
To elucidate the adsorption mechanism, we performed IRAS studies, in particular using isotopic labeling of oxygen that allows to discriminate oxygen in water (ODf) and hydroxyl species involving oxygen on the oxide surface (OsD). The results showed that (beside the lowest-coverage band at 2681 cm−1 being assigned to adsorption on defects) the IR bands at 2718 cm−1 and 2688 cm−1 are associated to ODf and OSD species, respectively, both resulting from water dissociation [Fig. 10(a)].
(a) Assignment of OD vibrational modes on Fe3O4(111). (b) Schemes for the dissociatively adsorbed water monomer (left) and water dimer (right).

DFT calculations substantiated these conclusions. Specifically, the computed adsorption enthalpy of the monomer is −102 kJ/mol and the corresponding OD bands are 2736 and 2699 cm−1, respectively. These act as an anchor for water molecules to form a dimer complex [Fig. 10(b)] which self-assembles into an ordered (2 × 2) structure at increasing coverage. At high coverages, dimers and oligomers ultimately assemble into an ordered (2 × 2) hydrogen-bonded network structure prior to the formation of a multilayer solid water film. The results highlight a delicate balance that exists in water adlayers on oxide surfaces where hydrogen bonding may play an important role in stabilizing particular structures.
Hydroxylation of thin oxide films
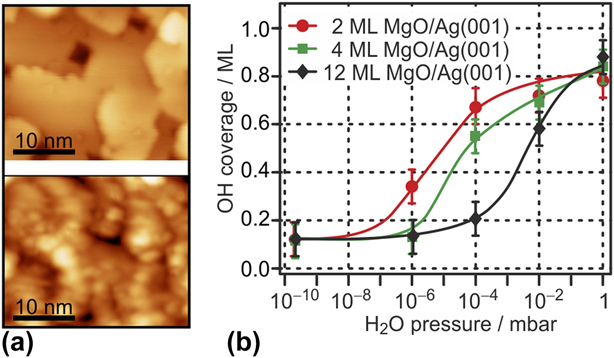
The examples discussed so far refer to water adsorption to bulk-like thin films (i.e., films of reasonable thickness and structural similarity to the corresponding bulk oxides) at UHV conditions, where no structural modifications of the oxide lattice take place during adsorption. For complete hydroxylation of the oxide surfaces, which is expected to occur when environmentally more realistic water partial pressure conditions (mbar range) or higher water coverages are approached, reactions between water and the oxide surfaces have to be considered as well. For the more ionic oxides in particular, this may involve hydrolysis of cation–anion bonds and strong structural modifications. The hydroxylation of MgO and CaO single-crystal surfaces and the partial transformation into the corresponding hydroxide as a function of relative humidity have been studied by ambient pressure XPS. Those studies revealed that the CaO(001) surface gets fully hydroxylated even under UHV conditions and transforms into the hydroxide, involving hydroxylation of the subsurface regions, at elevated water partial pressure [Reference Liu, Kendelewicz, Brown, Parks and Pianetta92]. On the other hand, a certain threshold water pressure in the sub-mbar range has to be applied to achieve sufficient surface hydroxylation of MgO(001) [Reference Liu, Kendelewicz, Gordon and Parks93]. Studies on the corresponding thin film surfaces confirmed these results. Figure 11(a) compares STM images of the surface of a clean CaO(001) film (top) and after a saturation dose of water under UHV conditions at room temperature (bottom) [Reference Zhao, Shao, Fujimori, Bhattacharya, Ghiringhelli, Freund, Sterrer, Nilius and Levchenko77, Reference Fujimori, Zhao, Shao, Levchenko, Nilius, Sterrer and Freund79]. Clearly, water adsorption leads to strong structural modification of the surface, which is due to complete surface hydroxylation and partial solvation of Ca2+ ions. The latter can in part be explained by the sufficiently large structural flexibility of the CaO lattice, which allows easy rupture of cation–anion bonds.
(a) STM images (30 × 25 nm2) of 10 ML CaO(001)/Mo(001) (top) and of the same surface exposed to a saturation dose of water at room temperature (bottom). (Reprinted with permission from Ref. Reference Fujimori, Zhao, Shao, Levchenko, Nilius, Sterrer and Freund79. Copyright (2016) American Chemical Society.) (b) H2O pressure-dependent surface hydroxyl coverage on Ag(001)-supported MgO(001) films of different thickness. (Reprinted with permission from Ref. Reference Carrasco, Brown, Sterrer, Freund, Kwapien, Sierka and Sauer94. Copyright (2010) American Chemical Society.)

By contrast, hydroxylation of thick, bulk-like MgO(001) films at room temperature and at UHV conditions is limited to defect sites, and to obtain complete hydroxylation, a threshold water partial pressure of about 0.01 mbar has to be applied [Fig. 10(b)] [Reference Carrasco, Brown, Sterrer, Freund, Kwapien, Sierka and Sauer94]. Titration of Mg2+ sites with CO has shown that the number of low-coordinated Mg2+ sites gets strongly enhanced upon hydroxylation, suggesting the occurrence of similar structural modifications as in the case of CaO(001). Interestingly, the threshold pressure for hydroxylation decreases by 3 orders of magnitude as the film thickness is reduced from 12 ML to 2 ML [Fig. 10(b)] [Reference Carrasco, Brown, Sterrer, Freund, Kwapien, Sierka and Sauer94]. This effect is not related to an increased abundance of defects on the ultrathin film, but can be explained by a decreased energetic barrier for the rupture of Mg2+–O2− bonds, which is related to the greater structural flexibility of the MgO lattice in the ultrathin regime [Reference Savio, Celasco, Vattuone, Rocca and Senet95].
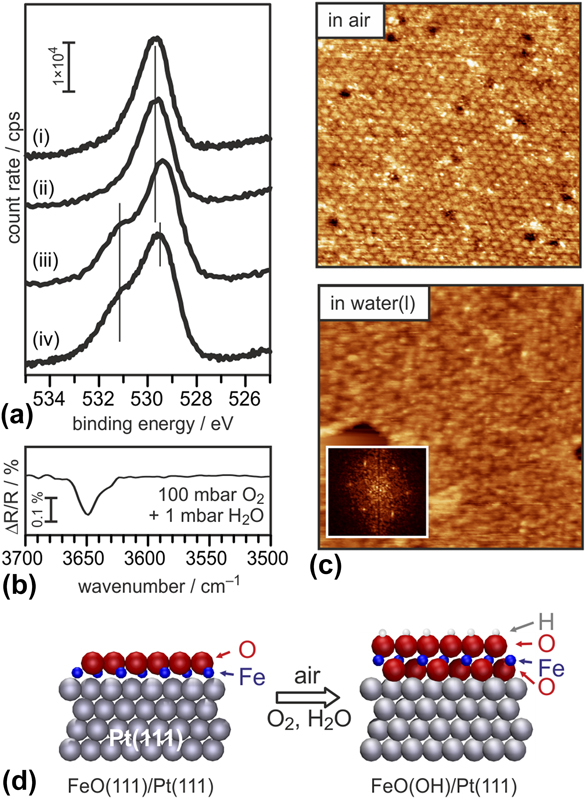
Polar oxide surfaces are intrinsically reactive toward water because surface hydroxyls provide compensating charges necessary to remove polarity. Also, in polar oxide films grown on metal substrates, where the compensating charge density at the metal–oxide interface is readily provided by the metal, the free film surface needs to be compensated by conventional mechanisms, e.g., surface hydroxylation. Conversely, the thinnest oxide films (monolayers) are intrinsically nonpolar, thus reducing their activity toward water. In fact, the FeO(111) monolayer film is stable in pure water vapor environment, as shown by the O 1s XP spectrum obtained after exposure to 1 mbar water vapor. The latter exhibits only one component attributable to the lattice oxygen species, and no further contribution from hydroxyls [Fig. 12(a), (i) and (ii)] [Reference Ringleb, Fujimori, Wang, Ariga, Carrasco, Sterrer, Freund, Giordano, Pacchioni and Goniakowski96]. In addition, the structural integrity of the FeO(111) monolayer appears to be maintained upon exposure to air ambient and even liquid water, as shown by the STM images presented in Fig. 12(c), where the long-range ordered Moiré superlattice characteristic of FeO(111)/Pt(111) is proved to persist in the corresponding environment.
(a) O 1s XP spectra, from top to bottom, of (i) clean FeO(111)/Pt(111), the film exposed to (ii) 1 mbar D2O, (iii) air, and (iv) 100 mbar O2 and 1 mbar H2O. (b) IR spectrum of the FeO(111)/Pt(111) film exposed to 100 mbar O2 and 1 mbar H2O. (c) Ambient-STM images (60 × 60 nm2) of the FeO(111)/Pt(111) film in air (top) and in liquid water (bottom). (Reprinted with permission from Ref. Reference Ringleb, Fujimori, Wang, Ariga, Carrasco, Sterrer, Freund, Giordano, Pacchioni and Goniakowski96. Copyright (2011) American Chemical Society.) (d) Model of the FeO(111)/Pt(111) film (left) and of the Pt–O–Fe–OH film (right) formed by exposure to air.

Exposure of FeO(111) to a high-pressure oxygen atmosphere leads to a transformation of the FeO bilayer to a O–Fe–O trilayer [Reference Giordano, Lewandowski, Groot, Sun, Goniakowski, Noguera, Shaikhutdinov, Pacchioni and Freund97, Reference Sun, Giordano, Goniakowski, Lewandowski, Qin, Noguera, Shaikhutdinov, Pacchioni and Freund98, Reference Sun, Qin, Lewandowski, Carrasco, Sterrer, Shaikhutdinov and Freund99]. Both the additional oxygen incorporated in the film, which shows up in XPS as a shoulder on the high binding energy side of the main O 1s component, and the similarity of the STM appearance suggest that this transformation occurs also upon exposure of the FeO film to air [Fig. 12(a), (iii) and (iv)]. In addition, the IRA spectrum of an air-exposed film reveals the presence of hydroxyl species with characteristic vibrations at 3650 cm−1 [Fig. 12(b)]. It can, therefore, be concluded that the trilayer structure is highly active in water dissociation. As a result, an O–Fe–OH trilayer is formed [Fig. 12(d)] and the additional O 1s signal in XPS can be attributed to hydroxyl species [Reference Ringleb, Fujimori, Wang, Ariga, Carrasco, Sterrer, Freund, Giordano, Pacchioni and Goniakowski96]. XPS quantification reveals a maximum hydroxyl coverage of 0.45 ML. Together with the ordered appearance in STM, this suggests that the hydroxylation activity is restricted to the most reactive region within the Moiré unit cell, which, according to DFT calculations, is the Fe-hcp region [Reference Giordano, Lewandowski, Groot, Sun, Goniakowski, Noguera, Shaikhutdinov, Pacchioni and Freund97].
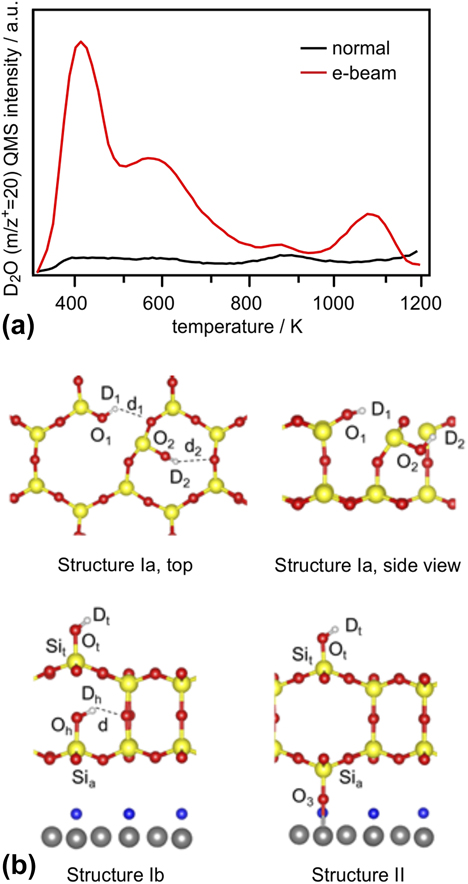
All UHV-based, well-defined silica models have a common structural motif, which consists of corner-sharing [SiO4] tetrahedra arranged in a honeycomb structure (section “Silica film”) [Reference Shaikhutdinov and Freund100]. The fact that the surfaces are terminated by siloxane bonds renders the regular parts of the films hydrophobic and, thus, unreactive toward water. Indeed, the silica bilayer on Ru(0001) can be exposed to air and pH-neutral aqueous solutions without any noticeable accompanying chemical and structural modifications to the film (see also section “Water–silica interface”). Hydroxylation of these model systems occurs only at defect sites, which, on well-prepared films, are scarce [Reference Yang, Emmez, Kaden, Yu, Boscoboinik, Sterrer, Shaikhutdinov and Freund101]. Since hydroxyl groups on silica (silanol groups) are of enormous importance for several technological applications, their creation and further utilization on well-defined model systems may help to obtain more fundamental insight into specific interfacial reactions where silanols are involved. Hydroxylation of the films could be achieved in the presence of water ice by the help of electron bombardment [Reference Yu, Emmez, Pan, Yang, Pomp, Kaden, Sterrer, Shaikhutdinov, Freund, Goikoetxea, Wlodarczyk and Sauer102]. This is exemplified by the TPD spectra shown in Fig. 13(a), which have been obtained after dosing water (D2O) at a substrate temperature of 100 K and followed by heating to RT (normal route, black curve), or with an additional electron bombardment prior to heating (electron-assisted route, red curve). The strong enhancement of water desorption from the electron-bombarded sample is related to a significantly increased abundance of D2O and OD’s on the silica surface. More specifically, the thermal route leads to the formation of isolated hydroxyl groups at defect sites within the film, which recombine at elevated temperature and desorb as molecular water at 900 K, and some additional hydrogen-bonded physisorbed water, which desorbs at lower temperatures (<500 K). The small amount of water desorbing from this sample supports the idea of the inert nature of the silica bilayer film surface. By contrast, enhanced hydroxylation of the electron-bombarded sample gives rise to much larger and more clearly defined water desorption peaks with maxima at 450 and 600 K, as well as an additional high-temperature desorption feature at ∼1070 K [Reference Yu, Emmez, Pan, Yang, Pomp, Kaden, Sterrer, Shaikhutdinov, Freund, Goikoetxea, Wlodarczyk and Sauer102, Reference Kaden, Pomp, Sterrer and Freund103]. It is interesting to see that in terms of peak temperatures associated with individual desorption states, there is general agreement with analogous TPD spectra collected from hydroxylated bulk silica samples, which suggests the presence of similar water and hydroxyl species on the hydroxylated silica film. According to the Zhuravlev model [Reference Zhuravlev104], the desorption peaks are attributed to the following adsorption states and processes: Chemisorbed molecular water gives rise to desorption at 400 K, whereas the high-temperature peaks are assigned to recombinative water desorption originating from vicinal (at 600 K) and isolated hydroxyls (above 800 K).
(a) TPD spectra (m/z+ = 20 amu) of SiO2 samples exposed to 5 L D2O at 100 K and then exposed (“e-beam,” red trace) or not exposed (“normal,” black trace) to an electron beam (0.05 mA, 200 eV, 60 s). (b) Hydroxylation structures for silica films involving breaking of in-plane (structure Ia, top) and vertical (structures Ib and II, bottom) siloxane bridges, obtained from DFT calculations. (Reprinted from Ref. Reference Yu, Emmez, Pan, Yang, Pomp, Kaden, Sterrer, Shaikhutdinov, Freund, Goikoetxea, Wlodarczyk and Sauer102—Published by the PCCP Owner Societies.)

The creation of silanols requires the rupture of siloxane bridges, and several possibilities of how this could be achieved have been modeled by DFT [Reference Yu, Emmez, Pan, Yang, Pomp, Kaden, Sterrer, Shaikhutdinov, Freund, Goikoetxea, Wlodarczyk and Sauer102]. As shown by the structural models presented in Fig. 13(b), rupture of an in-plane siloxane bridge results in two silanol groups, which are both engaged as donor groups in hydrogen bonds (structure Ia). On the other hand, breaking the Si–O–Si linkage between the two silicate layers results in one hydrogen-bonded silanol and one terminal silanol species (structure Ib). In addition to these processes, which are basically the same as assumed for bulk silica surfaces, the presence of the metallic substrate underneath the silica film opens the possibility for another mechanism, which involves hydrogen release and Ru oxidation (structure II). According to the computed hydroxylation energies and further experimental observations (D2 desorption observed in TPD and infrared signals of terminal OD groups) [Reference Yu, Emmez, Pan, Yang, Pomp, Kaden, Sterrer, Shaikhutdinov, Freund, Goikoetxea, Wlodarczyk and Sauer102], all three proposed structures are likely to be formed initially during electron bombardment or are created via transformation of one structure into another during heating to elevated temperature. Further experimental studies of the mechanism of electron-assisted hydroxylation of the silica films support the idea that the primary effect of electron irradiation is not the creation of defects (i.e., rupture of siloxane bridges) in the films, but the formation of reactive water radiolysis products (e.g., hydroxyl radicals) in the ice layer, which diffuse to the silica–ice interface and attack the siloxane bridges [Reference Kaden, Pomp, Sterrer and Freund103].
Stability and dissolution of thin oxide films in aqueous solutions
The investigations discussed so far were limited to systems studied under UHV conditions, which immediately poses the question how these results relate to oxide systems at ambient conditions such as an aqueous environment. In the following, we illustrate how such well-defined systems prepared under UHV conditions can be used to study the properties of oxide surfaces under ambient conditions. A variety of important technologies involve processes at the liquid–oxide interface. Aiming at the investigation of such processes using well-defined thin oxide films, the system has to be stable under the specific environmental conditions of interest. For surface science investigations in particular, it is desirable that the structural order is maintained. Since the chemical properties of (most) oxide thin films are similar to those of the corresponding bulk analogues, their stability and dissolution behavior is expected to follow the same trends. Dissolution rates for oxide thin film samples can be derived from the measured decrease in film thickness upon exposure to aqueous solution, which can straightforwardly be determined from the intensities of the oxide and substrate XPS or AES emissions.
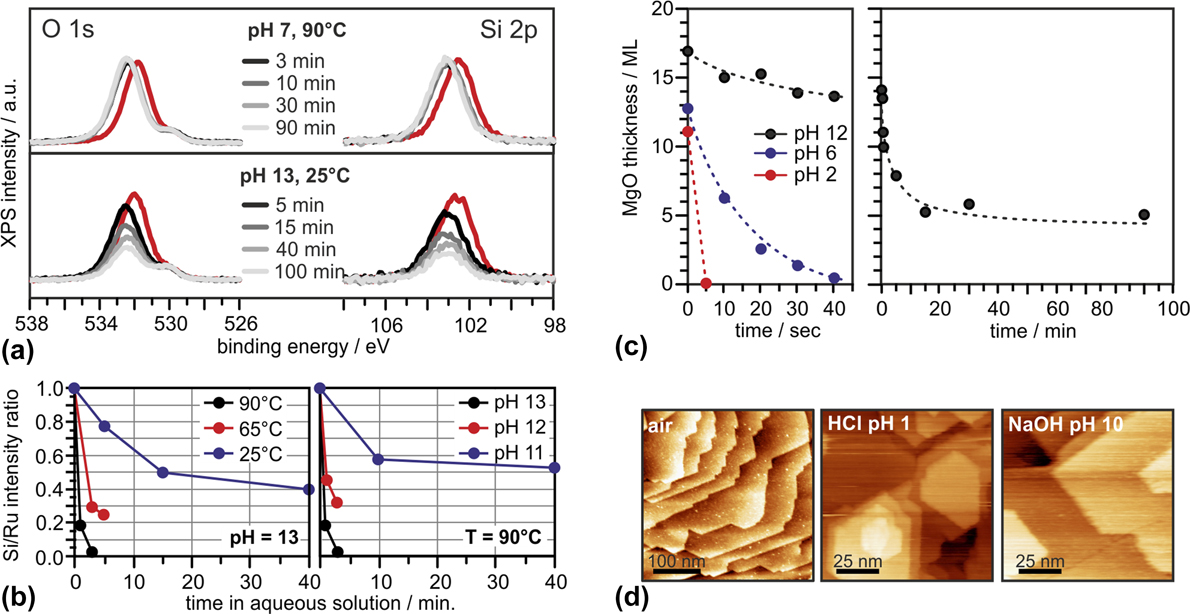
XP spectra (O 1s and Si 2p regions) taken after exposing bilayer SiO2/Ru to deionized water at 90 °C, and NaOH(aq) at 25 °C for various times are displayed in Fig. 14(a) [Reference Kaden, Pomp, Sterrer and Freund103]. Clearly, deionized water (pH 7) does not affect the film structure to any significant extent, even at elevated temperature. While a small shift of all silica-related XP peaks to higher BE, which reflects a slight change in the electronic structure of the system (band bending), is noted, neither the Si 2p nor the O 1s peaks suffer any loss of intensity. In contrast, the intensity of both peaks decreases significantly, even at 25 °C, when the silica bilayer is exposed to alkaline media (NaOH, pH 13). The equal relative signal intensity loss of Si and O peaks observed with time of exposure allows to conclude that, in accordance with general experience, the dissolution process in alkaline media can be described as the OH−-catalyzed hydrolysis of SiO2 (SiO2 + 2H2O → H4SiO4). One can further state that the bilayer SiO2/Ru films resemble the dissolution behavior of other, more abundant forms of silica (quartz, amorphous silica), which are found to be practically insoluble in the neutral pH range, yet strongly soluble in alkaline conditions. From more systematic studies [Fig. 14(b)], it is clear that removal of SiO2 from the sample occurs faster at higher temperature and pH, which is also qualitatively consistent with the behavior noted from bulk-phase silica analogues [Reference Bickmore, Wheeler, Bates, Nagy and Eggett105]. The dissolution rates for the thin film sample can be modeled by the general silica dissolution rate model derived by Bickmore et al. [Reference Bickmore, Wheeler, Bates, Nagy and Eggett105], which accounts for variations in pH, temperature, and the coverage of neutral (θSi–OH) and deprotonated (θSi–O–) silanols. Because the silica film is hydrophobic and lacks significant initial silanol coverage, the latter two contributions can be neglected and the rate equation simplifies to:
 $${{{{{\rm{dSi}}} \over {{\rm{d}}t}}} / {{{{\rm{mol}}} / {\mathop{\rm s}\nolimits} }}} = {e^{6.7 \pm 1.8}}{\rm{T}}{{\rm{e}}^{\left( {{{ - 77.5 \pm 6.0} \over {RT}}} \right)}}\left[ {{\rm{O}}{{\rm{H}}^ - }} \right]\quad .$$
(a) Evolution of O 1s (left) and Si 2p (right) XP spectra of SiO2/Ru(0001) samples as a function of time of exposure to (top) deionized water at 90 °C, and (bottom) 0.1 M NaOH at 25 °C. (b) Peak intensity ratios of Si 2p relative to Ru 3d for bilayer SiO2/Ru samples exposed to aqueous NaOH solutions at pH 13 and various temperatures (blue = 25 °C, red = 65 °C, and black = 90 °C; left) and varying pH (blue = 11, red = 12, and black = 13) at 90 °C (right) as a function of time spent within the aqueous environments. (Adapted from Ref. Reference Kaden, Pomp, Sterrer and Freund103.) (c) (left) Dissolution of MgO(001)/Ag(001) films (initial thicknesses corresponding to the values at time = 0 s) in various environments plotted as MgO film thickness versus time of exposure to solutions; black: 0.01 M NaOH solution (pH 12), blue: Millipore water (pH 6), red: 0.01 M HCl solution (pH 2). (right) Dissolution of MgO(001)/Ag(001) in 0.01 M NaOH. (Reprinted from Ref. Reference Ringleb, Sterrer and Freund106, Copyright (2014), with permission from Elsevier.) (d) Ambient STM images of Fe3O4(111)/Pt(111) taken after transfer from UHV to air (left), after 60-min exposure to 0.1 M HCl, pH 1 (middle) and after 60-min exposure to NaOHaq, pH 10 (right).

A comparison of the dissolution rates predicted from that relation to those estimated on the basis of the initial rates of Si XPS peak attenuations from the thin films shows good agreement between the model and the experiment [Reference Kaden, Pomp, Sterrer and Freund103]. From this, it is concluded that dissolution of the film in alkaline media is initiated by OH− attack at Si centers. Note that this leads to a rupture of siloxane bonds. Thus, the initial step in the dissolution process can qualitatively be described by models that are similar to those used to explain electron-assisted hydroxylation of the silica film [Fig. 13(b)]. In general, the silica bilayer films were found to be stable (i.e., negligible dissolution rates) at room temperature in acidic and neutral aqueous solutions and in alkaline media up to pH 10 [Reference Kaden, Pomp, Sterrer and Freund103].
MgO is a basic oxide [point of zero charge (PZC) in the pH 10 range] and therefore expected to be more stable in alkaline media than in neutral and acidic environment [Reference Vermilyea107]. Results of dissolution experiments performed with MgO(001)/Ag(001) thin films are presented in Fig. 14(c), where the variation in MgO film thickness as a function of time is displayed for exposure to acidic (pH 2, 0.01 M HCl), alkaline (pH 12, 0.01 M NaOH), and close-to-neutral (pH 6, Millipore water) environments, respectively [Reference Ringleb, Sterrer and Freund106]. The data shown in Fig. 14(c) are consistent with the expected faster dissolution of MgO in acidic media. In fact, in 0.01 M HCl solution the dissolution is so fast that a 11 ML thick film was completely dissolved within the first 5 s of exposure. The dissolution rate is smaller at pH 6; however, even under these conditions a 13 ML thin MgO film was completely dissolved within 40 s of exposure. During the same period, only 3 ML MgO was dissolved from the MgO sample upon exposure to alkaline (pH 12) solutions. For the latter, the dissolution behavior was studied for prolonged exposures (up to 90 min), the results of which show that the dissolution is initially fast and considerably slows down with time, until a stable surface state is obtained after 20–30 min of exposure. This suggests the formation of a brucite (Mg(OH)2)-like passivating surface layer during exposure to alkaline solution, for which the dissolution rate is considerably smaller than for MgO [Reference Pokrovsky and Schott108]. Because of the partial dissolution, and transformation of the surface layers into a hydroxide, MgO films exposed to alkaline media are subject to strong restructuring. Even if the crystallinity of the films can partially be recovered by annealing at elevated temperature, the initial structure of the MgO(001) films cannot be restored [Reference Ringleb, Sterrer and Freund106].
Iron oxides are, according to the corresponding Fe–water Pourbaix diagram, stable in aqueous solutions in a wide range of pH. Thus, it is not surprising that also thin iron oxide films are very stable in aqueous solutions. As an example, STM images taken in air from Fe3O4(111)/Pt(111) films, which have been prepared in UHV, subsequently transferred to air and exposed to aqueous solutions (pH 1, 0.1 M HCl and pH 10, NaOHaq) for 1 h, are shown in Fig. 14(d) [Reference Wang, Ariga, Dowler, Sterrer and Freund109, Reference Wang, Kaden, Dowler, Sterrer and Freund110]. These images reveal that the island–terrace–step structure of the thin film remains intact. Furthermore, the step edges run straight along the crystallographically preferred directions and the terraces are atomically flat. XPS taken from the exposed films indicates a slight oxidation of the surface, but this does obviously not lead to large structural modifications. Both Fe3O4(111)/Pt(111) and bilayer silica films [and to a limited extent also MgO(001)/Ag(001)] are therefore well suited for further investigations of processes involving oxide–liquid interfaces.
Water–silica interface
To date, most of the research on silica bilayers has been performed in idealized ultrahigh vacuum environments. These conditions provide a high degree of experimental control which enables unambiguous structural assessment. Yet real-world applications of silica and its derivatives demand higher pressures and temperatures and occur under ambient conditions. Recent research on silica bilayers beyond ultrahigh vacuum addresses these practical considerations by bridging the gap between UHV and ambient.
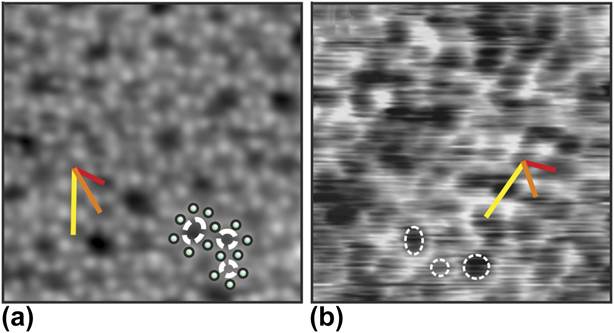
To bridge such gap, the structure of silica has been investigated with high-resolution liquid atomic force microscopy (AFM). Silica films are grown in UHV and subsequently transferred through ambient to the liquid environment (400 mM NaCl solution). Figure 15 shows images of the bilayer silica structure attained with ultrahigh vacuum STM [Fig. 15(a)] and high-resolution liquid AFM [Fig. 15(b)] [Reference Burson, Gura, Kell, Büchner, Lewandowski, Heyde and Freund111]. The low-temperature UHV STM image exhibits atomic resolution of the silica structure while the resolution of the room-temperature liquid AFM images allows identifying the ring structures. The structures appear remarkably similar as confirmed quantitatively from pair distribution functions of the ring center positions. These results show that the silica film is structurally robust against ambient and aqueous conditions; this result is consistent with the conclusions of the previous study which found the silica bilayer film to be exceptionally stable against hydroxylation [Reference Yu, Emmez, Pan, Yang, Pomp, Kaden, Sterrer, Shaikhutdinov, Freund, Goikoetxea, Wlodarczyk and Sauer102]. In contrast, many UHV surface structures are not stable under ambient conditions due to unsaturated bonds [Reference Ringleb, Fujimori, Wang, Ariga, Carrasco, Sterrer, Freund, Giordano, Pacchioni and Goniakowski96, Reference Ringleb, Sterrer and Freund106]. The stability of the silica bilayer makes it an optimal playground to test the resolution of liquid AFM as the amorphous structure circumvents the common challenge of distinguishing between true atomic resolution and lattice resolution [Reference Abraham and Batra112]. Furthermore, establishing the stability of the silica bilayer under ambient conditions opens the door to future device applications.
An amorphous silica bilayer film with atomic resolution of silicon atoms by STM in UHV (a) and ring resolution by liquid AFM in (b). Both images have a scan frame of 5 × 5 nm. Red, orange, and yellow measurement bars show examples of ring center–center distances for the first three families of ring neighbors identified in the amorphous silica bilayer. Several individual rings are marked in each image [Reference Burson, Gura, Kell, Büchner, Lewandowski, Heyde and Freund111].

Conclusions
In this review article, we highlighted recent results obtained from surface science investigations for the interaction of water with metal-supported crystalline thin oxide films, which represent versatile models of the corresponding bulk oxides and can additionally provide access to experimental techniques that cannot easily be applied to realistic systems. We have discussed several aspects of water–oxide interactions at different levels of complexity, from the formation of ordered superstructures and the hydroxylation of oxide surfaces, to the stability and dissolution of oxides in aqueous solutions. It has been demonstrated, at least for simple model systems, that molecular-level understanding of the structure of water at oxide surfaces can be obtained by combining surface science spectroscopic and microscopic methods with support from computational modeling. Specifically for the alkaline earth metal oxides, this combination of methods allowed us to identify different ordered water–hydroxyl superstructures, such as the two-dimensional structures on MgO(001) and the one-dimensional chain structure on CaO(001), and to explain the stability of the various structures based on the properties of the substrate (basicity, lattice constant), the corresponding water–substrate interaction strength, and the ability to form hydrogen bonded networks. The latter is also important in the formation of the (2 × 2) water superstructure observed on Fe3O4(111). In this case, water molecules initially dissociate to form OHf–OSH pairs. Those act as nuclei for dimer formation by attachment of molecular water, from which, by maximizing the number of hydrogen bonds, an ordered (2 × 2) superstructure forms.
In contrast to the cases described above, the surface of the silica bilayer film is rather unreactive toward water because of the presence of completely saturated Si4+ ions. Hydroxylation is only achieved by providing additional energy input, e.g., through electron bombardment of an ice layer adsorbed on top of the silica surface. The different kinds of surface silanol groups formed in this way have essentially the same properties as those present on hydroxylated silica powder. Formation of stable hydroxyls requires, however, the rupture of substrate silicon–oxygen bonds (hydrolysis). In particular for the more ionic oxides such as the alkaline earth oxides, hydrolysis leads to strong morphological modifications of the surface, which significantly increases the structural complexity of the systems. Although some progress has been achieved in the description of the more complex water–oxide systems, including the dynamic aqueous–oxide interface, understanding the processes occurring at the interfaces of such systems at the molecular level still represent an enormous challenge.