

Introduction
Time is a central feature of democracies. Office terms limited through periodical elections confine political time horizons to relatively short segments (Linz Reference Linz1998). However, under which conditions could politicians and political parties adopt longer time horizons that extend over the next elections? Although many policy reforms depend crucially on long-term orientations of political actors (Jacobs Reference Jacobs2011), time perspectives of governments have often been neglected in the literature. In the fiscal policy literature, an implicit assumption is that coalition governments are particularly unable to adopt long-term time perspectives, and therefore end up with higher indebtedness rates, deficits or government expenditures (Roubini and Sachs Reference Roubini and Sachs1989; Grilli et al. Reference Grilli, Masciandaro and Tabellini1991; Tsebelis Reference Tsebelis2002; Bawn and Rosenbluth Reference Bawn and Rosenbluth2006).
However, parties with shared governing experiences in the past have created high levels of familiarity among each other, leaving them a substantial chance to cooperate again in the same constellation in future governments (Franklin and Mackie Reference Franklin and Mackie1983; Martin and Stevenson Reference Martin and Stevenson2001, Reference Martin and Stevenson2010). Such coalitions should be more concerned about the future costs of today’s debt developments, because they may have to face the consequences themselves. On the basis of these assumptions, this article explores the effects of coalitions’ prospects to cooperate in future governments on the development of their debt ratios. If governing parties expect good prospects for future cooperation, they should more credibly be able to refrain from unilateral spending demands for their own constituencies.
This implies that fiscal outcomes under coalitions credibly committing to long-term policy goals should be indiscernible from single-party governments’ outcomes, which is in line with a recent study by Bäck and Lindvall (Reference Bäck and Lindvall2015). Yet, fiscal policymaking goes beyond veto player and common pool resource problems commonly associated with coalition governments. Coalitions cooperating repeatedly based on their familiarity should also be able to forge broad political support and achieve consensus on electorally contested economic policies because of their ability to spread the costs and blame of reforms across coalition partners (Katzenstein Reference Katzenstein1985; Lijphart Reference Lijphart2012; Alexiadou Reference Alexiadou2013). As a consequence, coalition governments can be expected to achieve even more favourable debt outcomes than one-party governments, provided they can settle for long-lasting cooperation and adjust their debt preferences under the “shadow of the future” (Lupia and Strøm Reference Lupia and Strøm2008).
Empirical evidence for this argument derives from a comparison of 36 democracies, member states of the Organisation for Economic Co-operation and Development (OECD) and/or the European Union (EU), spanning the time period from 1962 (or since democratisation) to 2013. Consistent with comparable studies, “prospective cooperation” is operationalised as a retrospective measure of past cooperation experiences of the current governing parties. The relationship between prospective cooperation and debt development is statistically investigated using time-series cross-sectional (TSCS) regression analysis. The main tests consist of “autoregressive distributed lag (ADL)” models discerning between short-run and long-run effects. In addition, a government-centred data structure is employed based on cabinets as the unit of observation instead of country-years.
The results show that the longer time perspectives of coalitions with a high chance for prospective cooperation are related to lower debt increases – compared not only with coalitions without durable cooperation patterns (Bäck and Lindvall Reference Bäck and Lindvall2015) but also with single-party governments. Complementing the study by Bäck and Lindvall (Reference Bäck and Lindvall2015), I discuss further theoretically relevant factors that condition the impact of coalitions’ time horizons: the fiscally beneficial effects of prospective cooperation are particularly pronounced in non-election years and where fiscal pressure reduces the scope for “pork-barrel politics”. This study challenges the implicit assumption of political-economy models that governments’ time horizon rarely exceeds the next election. Rather, based on the ability of governments for strategic behaviour (Müller and Strøm Reference Müller and Strøm1999; König and Wenzelburger Reference König and Wenzelburger2014), the findings are consistent with new research on the significance of intertemporal considerations in politics (Bejar et al. Reference Bejar, Mukherjee and Moore2011; Jacobs Reference Jacobs2011; Bojar Reference Bojar2015; Hübscher Reference Hübscher2015).
This article is organised as follows: the following chapter introduces the theoretical argument; the empirical section explains the operationalisation of the variables, the statistical methods and the results of the multivariate statistical analysis. Some implications of the analysis are discussed in the conclusion.
Government form and debt dynamics
Multi-party governments have frequently been associated with fiscally less beneficial debt, deficit or expenditure policy outcomes compared with one-party governments in the literature (for an overview, see Alesina and Perotti Reference Alesina and Perotti1995). First, early political-economy models diagnosed coalition governments with a “common pool” problem (Weingast et al. Reference Weingast, Shepsle and Johnsen1981; Roubini and Sachs Reference Roubini and Sachs1989), which is furthermore exacerbated by fragmentation, that is, a higher number of parties in government. Many fragmented governments have conflicting interests among the coalition partners. Rational government parties prefer to maximise spending for their own constituencies as they do not have to bear the overall costs alone (von Hagen and Harden Reference von Hagen and Harden1995; Hallerberg and von Hagen Reference Hallerberg, Strauch and von Hagen1999; Bawn and Rosenbluth Reference Bawn and Rosenbluth2006). In other words, coalitions are associated with higher budget deficits because they “externalise” the costs of additional expenditure for their preferred policy fields and want to shift the costs onto other groups within the coalition (Bawn and Rosenbluth Reference Bawn and Rosenbluth2006, 253–254).
Second, due to their fragmentation, coalition governments have difficulties in adjusting budget deficits, because coalition partners shield their preferred policy fields from cutbacks while trying to shift the burden of fiscal adjustments to other coalition partners or external groups (Roubini and Sachs Reference Roubini and Sachs1989; Alesina and Drazen Reference Alesina and Drazen1991). The higher number of veto players and the greater ideological distance, compared with one-party governments, thus reduces the ability of coalitions to adjust to economic shocks (Tsebelis Reference Tsebelis2002, Chapter 8).
Third, it has been argued that coalition governments have higher debt ratios because they are more short-lived than single-party governments (Grilli et al. Reference Grilli, Masciandaro and Tabellini1991; Bejar et al. Reference Bejar, Mukherjee and Moore2011). In economic terms, unstable government forms have a higher “discount rate” of the future, that is, they prefer immediate benefits over future benefits. Therefore, they act “myopically” as they overvalue the benefits of present government spending compared with the costs of higher indebtedness ratios in the future (Grilli et al. Reference Grilli, Masciandaro and Tabellini1991, 349).
Yet, notwithstanding an abundance of studies, the empirical findings on the effects of the type of government are not uncontested (e.g. Edin and Ohlsson Reference Edin and Ohlsson1991; de Haan and Sturm Reference de Haan and Sturm1997; Sakamoto Reference Sakamoto2001). One problem of fragmentation and veto player approaches is their uniform treatment of time horizons. The value of the future could increase for coalition partners expecting to remain in office for longer time periods. This would provide incentives to “internalise” the whole cost of their public policy decisions. Coalition bargaining, in fact, often takes place under the “shadow of the future” with incentives to make credible future agreements (Lupia and Strøm Reference Lupia and Strøm2008).
A second potential explanation for deviating findings is the debatable characterisation of one-party governments as unitary decision makers, whereas coalitions are seen as heterogeneous decision makers with divergent preferences that lead to collective action problems (Bäck and Lindvall Reference Bäck and Lindvall2015, 55). However, all parties represent coalitions of conflicting interests of societal groups. For instance, the German Christian Democratic Union (CDU) is an example for intra-party federalism (Schmid Reference Schmid1990). One reason why parties exist is indeed to become durable coalitions (Aldrich Reference Aldrich2011). Why then should the number of parties result in policy differences when several groups in society can be equally represented by both one-party and multi-party governments (Persson et al. Reference Persson, Roland and Tabellini2007, 156)? Possibly, one-party governments are electorally accountable for all policy areas, whereas voters associate only policy subsets with each coalition party (Bawn and Rosenbluth Reference Bawn and Rosenbluth2006). However, this argument ignores that collaboration among parties raises their familiarity and facilitates repeated cooperation within the same constellation (Franklin and Mackie Reference Franklin and Mackie1983), which makes coalitions appear more so as fixed entities over time. The assumption that only coalitions are non-unitary decision makers becomes uncertain when multi-party governments are not as homogeneous and when coalition parties cooperate more sustainably than commonly assumed.
Introducing time horizons: future cooperation prospects
These tenuous assumptions make it questionable whether all coalitions are actually distinguishable from one-party governments with regard to their time horizons. Coalition governments, I argue, should be even more capable than single-party governments to produce favourable fiscal policy outputs if their longer time horizon through “prospective cooperation” in the future permits them to credibly agree on debt-stabilising policies. Behind this argument are three assumptions. First, coalitions with a shared past governing experience have higher chances to govern together in the future again, because they are familiar with each other. Second, such coalitions are likely to internalise the future costs of indebtedness. Third, broad and durable coalitions can diffuse the electoral risks of contested fiscal policies more effectively than single-party governments.
In detail, the first assumption states that parties in coalition governments see a chance that they might cooperate again in the future. Evidence comes from the coalition formation literature. Parties that have regularly cooperated in the past have created high degrees of familiarity among each other (Franklin and Mackie Reference Franklin and Mackie1983). The shared experiences of past government participation reduce bargaining costs for coalition agreements and go along with reputational benefits (Warwick Reference Warwick1996, 474). Furthermore, parties prefer keeping the same partners, as they know more about each other and are better able to communicate (Bäck and Dumont Reference Bäck and Dumont2007, 487). Incumbent coalitions with high familiarity therefore have higher chances to form the next government (Martin and Stevenson Reference Martin and Stevenson2001, Reference Martin and Stevenson2010). Conversely, the chance for prospective cooperation is reduced with dissention and betraying behaviour in the past (Bäck and Dumont Reference Bäck and Dumont2007, 487; Tavits Reference Tavits2008). All these studies argue that the prospects for future cooperation are decisively influenced by the cooperation behaviour in the past. Thus, it is reasonable to assume that prospective cooperation can be assessed through past cooperation patterns. This assumption can be empirically tested by comparing varying retrospective measures of past coalition patterns.
The second assumption of the argument is that parties care about the costs of high future indebtedness levels. Rarely, governments face positive economic shocks and end up with comfortable fiscal situations so that they can sustain high budget deficits without constraints. More typically, higher debt ratios bear some undeniable long-term costs for all governments (Alesina and Drazen Reference Alesina and Drazen1991; Reinhart and Rogoff Reference Reinhart and Rogoff2009). Although this does not rule out debt as an economic policy option, it limits unrestricted indebtedness at the cost of future generations for parties expecting future participation in government. Coalitions with prospective cooperation will therefore have to budget these long-term costs and internalise them at some point, that is not shift them to external groups or to future governments. This assumption can also be tested empirically because fiscal pressure should moderate the incentive for coalitions to internalise the long-run costs of additional spending.
Although repeated participation in government and internalisation of the future costs of debt accumulation can also apply to single-party governments, the third assumption concerns a unique characteristic of coalition governments. The literature on consensus democracies (for recent empirical evidence, see Luebbert Reference Luebbert1984; Katzenstein Reference Katzenstein1985; Lijphart Reference Lijphart2012; Alexiadou Reference Alexiadou2013; Armingeon et al. Reference Armingeon, Guthmann and Weisstanner2015a) suggests that governments that are able to forge broad coalitions with opposition parties and societal actors can more easily agree on electorally contested reforms. Coalitions with good cooperation prospects resemble such broad coalitions because they can support cross-party alliances over extended periods of time. They can gather broader electoral support for a long-term view on debt developments by exploiting opportunities to diffuse blame and responsibility for unpopular policies across coalition partners (Weaver Reference Weaver1986; Powell and Whitten Reference Powell and Whitten1993). On the other hand, although coalition governments with longer time horizons can agree on the goal of pursuing fiscal stabilisation policies, the process of agreeing on – and implementing – status quo changes may still take a longer time relative to one-party governments because of the multiple veto actors involved (Tsebelis Reference Tsebelis2002; Armingeon et al. Reference Armingeon, Guthmann and Weisstanner2014). Yet, accounting for the more difficult process of reaching consensual policy positions, their advantages in including a broader spectrum of political actors into governmental decision making should enable durable coalitions from keeping debt accumulation under control even better than single-party governments.
Taken together, the causal mechanism of the argument has started from the common observation that, stemming from their fragmentation, coalitions have a “time-inconsistency problem” (Kydland and Prescott Reference Kydland and Prescott1977), because without future perspectives some coalition partners have electoral incentives to maximise spending on their preferred policy areas and externalise their costs (Bawn and Rosenbluth Reference Bawn and Rosenbluth2006). However, from a critical examination of these assumptions about coalitions’ common pool resource and veto player problems, it follows that coalitions can overcome the time-inconsistency challenge if (a) they expect future cooperation in government, (b) they desire to avoid unreasonably high future debt levels and (c) they represent broad societal coalitions that minimise electoral risks associated with controversial reforms. In these circumstances, coalition agreements that lead to farsighted fiscal policymaking can be reached more easily because the partners are familiar with each other. Opt-out options – by leaving the coalition or sabotaging agreements with coalition partners – are associated with higher costs because the parties have to consider that their partners would not be likely to cooperate with them anymore in the future in such cases. The “walk-away value” for coalition bargaining (Lupia and Strøm Reference Lupia and Strøm2008) or the benefit of the bargaining leader for leaving the bargaining round diminishes in such situations. The expectation of prospective cooperation therefore leads to a contract-like situation that relies on reciprocal trust and reputation and that can be the source for credible long-term agreements (Kreps Reference Kreps1990; Majone Reference Majone1996). This leads to the main hypothesis of this article about the fiscally beneficial effects of prospective cooperation:
H1: The stronger the prospects for future cooperation of a coalition government, the lower its debt increases compared with less durable coalitions and compared with single-party governments.
With the goal of keeping debt accumulation in check, the credibility advantages of prospective cooperation facilitate a wide range of fiscal policy agreements. Possible examples include the capacity to freeze spending levels on existing levels, maintain deficit and/or debt ratio targets, set growth and employment objectives, agree on fiscal consolidation measures by reducing expenditures or increasing taxes and committing to strict implementations of fiscal objectives. In practice, we find many instances where coalition parties openly refrain from unilaterally claiming fiscal resources for their own constituencies. For example, the Swedish centre-right coalition – the traditional opposition block to the Social Democratic party – governing between 2006 and 2014 committed itself to budget surpluses in both their 2006 and 2010 electoral manifestos (Allians för Sverige 2006; Alliansen 2010). Grand coalitions in Austria – Christian and Social Democrats share a long history of co-governing – regularly agree on detailed coalition programmes such as a 288-page document for the 2008–2013 term, which underlined the goal of a balanced budget with specific measures of fiscal consolidation (Bundeskanzleramt 2008). Another instance is Ireland’s centre-left government of 1994–1997, characterising itself as a “government of renewal” (Irish Government 1994). Fine Gael and the Labour Party had collaborated three times between 1973 and 1987, expectedly facilitating the favourable outcomes of cyclically adjusted primary surpluses of more than 4% from 1995–1997. These three examples also stress that I expect longer time perspectives to facilitate fiscal outcomes irrespective of the ideological orientation of the governing parties involved.
Are there alternative factors that condition the effectiveness of coalitions’ cooperation outlooks to contain debt dynamics? First, as fiscal policy sometimes co-varies with electoral cycles (Nordhaus Reference Nordhaus1975) and even governments with long-term cooperation prospects face electoral uncertainties (Lupia and Strøm Reference Lupia and Strøm2008; Jacobs Reference Jacobs2011), election years should temporarily suspend debt stabilisation efforts of governments seeking re-election. Second, if the assumption is valid that parties care about the costs of future debt (see above), the incentives that cooperation involves for long-sighted fiscal policymaking should be stronger when the government faces greater fiscal pressure. Third, even when governing parties agree on debt-stabilising policies, the effectiveness of fiscal outcomes may depend on the degree of centralisation in budgetary institutions – especially in the delegation of fiscal authority to strong finance ministers (Hallerberg and von Hagen Reference Hallerberg, Strauch and von Hagen1999; Hallerberg et al. Reference Hallerberg and von Hagen2009). This leads to three sub-hypotheses:
H2: The effects of prospective cooperation on debt changes are strongest in non-election years.
H3: The effects of prospective cooperation on debt changes are strongest under high fiscal pressure.
H4: The effects of prospective cooperation on debt changes are strongest under high fiscal delegation.
Although these factors are expected to moderate the strength of the effect of prospective cooperation, they are not necessary conditions determining whether cooperation effects take place at all. In other words, one should find evidence for lower debt growth for coalitions with long time horizons even during election years, under low fiscal pressure and under low centralisation of budgetary institutions.
Data and operationalisation
The argument is put to an empirical test by comparing 36 post-industrial democracies: the 28 EU member states, in addition to OECD member states Australia, Canada, Iceland, Japan, New Zealand, Norway, Switzerland and the United States (US). The data set comprises more than 600 governments. Maximally, the observation period ranges from 1962 to 2013, but starts only after the democratic transition of each country. Unless noted otherwise, all government data are from Armingeon et al. (Reference Armingeon, Isler, Knöpfel and Weisstanner2015b), and all political-economic control variables are from Armingeon et al. (Reference Armingeon, Isler, Knöpfel, Weisstanner and Engler2015c). Tables A1 and A2 in the online appendix provide details on the operationalisation and descriptive statistics of all variables.
Debt change
Following several studies, the dependent variable is the annual change (first differences) in gross general government debt ratios in percentage of gross domestic product (GDP) (Franzese Reference Franzese2002; Bäck and Lindvall Reference Bäck and Lindvall2015). Debt data are based on OECD Economic Outlook and Eurostat sources, but time series are extended through backward extrapolation, mostly in the 1960s and 1970s, using data from the International Monetary Fund (IMF) (Abbas et al. Reference Abbas, Belhocine, ElGanainy and Horton2010) and Reinhart and Rogoff (Reference Reinhart and Rogoff2009) (for details see Armingeon et al. Reference Armingeon, Isler, Knöpfel, Weisstanner and Engler2015c). Using non-extrapolated data yields substantially identical results (see the section below on robustness tests). Debt ratios correlate with measures of budget deficits, but may be less prone to “creative accounting” of governments (Alt et al. Reference Alt, Dreyer Lassen and Wehner2012). As growth and interest payments also influence debt trajectories, debt changes encompass the entirety of public finance development both on the expenditure and on the revenue side. Nonetheless, my results are robust to alternative indicators such as budget deficits or government expenditures.
Government form
The differentiation between coalition/multi-party governments and one-party governments is the first important independent variable following from the theoretical argument (coalitions coded 1; one-party governments coded 0).
Prospective cooperation
“Prospective cooperation” encompasses current governing parties’ chances for future participation in governments in the same constellation. This measure is based on the idea of familiarity through shared past governing experiences, which should enable governments to take a more credible long-term perspective on debt dynamics. It is detrimental for prospective cooperation if current coalition partners frequently governed with other parties or governed alone in the past. Such dissenting behaviour reduces coalition partners’ familiarity and mutual trust (Tavits Reference Tavits2008); there is no stable foundation for long-term cooperation based on successful past collaborative experiences, thus damaging the credibility of fiscal policy agreements.
The measure for prospective cooperation is constructed retrospectively and oriented towards past cooperation, following Bäck and Lindvall (Reference Bäck and Lindvall2015) and similar measures by Persson and Tabellini (Reference Persson and Tabellini2009) and Martin and Stevenson (Reference Martin and Stevenson2010). It is assumed that each governing party judges the chances for prospective cooperation on account of its past cooperation experiences with other governing parties. As familiarity is a dynamic concept that is developed over time, all cooperation experiences since 1960 are taken into account for all governing parties in the data set.
However, there are reasons to “discount” past events because coalitions have to compare present benefits and future benefits facing uncertainty about the future (Lupia and Strøm Reference Lupia and Strøm2008). For governments with higher discount rates, the potential for prospective cooperation should depend more strongly on recent government constellations than on patterns from decades ago. The functional form of how past government events have to be discounted is unclear a priori, however. Measuring democratic capital, Persson and Tabellini (Reference Persson and Tabellini2009, 101) are “agnostic” about the functional form and assume that democratic capital accumulates relatively slowly in democratic years but collapses rapidly if a regime becomes authoritarian. Past events are discounted with a geometrical depreciation function in this specification. For prospective cooperation, a similar intuition seems reasonable, in that familiarity is inherently developed over a longer time period than it can be disestablished. Bäck and Lindvall (Reference Bäck and Lindvall2015) follow the logic of Persson and Tabellini (Reference Persson and Tabellini2009) and set the depreciation rate at 0.95. This leads to a weight of 0.950=1 for an event one year ago, 0.951=0.95 for two years ago, 0.952=0.903 for three years ago, 0.953=0.857 for four years ago, etc. Events about 15 years ago carry half the weight of past year’s events. The closer the depreciation rate is to 1, the more all past events are weighted equally. The closer it is to 0, the more weight recent events carry.
Martin and Stevenson (Reference Martin and Stevenson2010) also use discount rates for their measure of familiarity. They argue that familiarity provides insider information about coalition partners, but that this process depends on the collaboration of party leaders. As they estimate average durations of party leadership in Western Europe at about eight years, cooperation events more than eight years ago are “almost completely discounted” (Martin and Stevenson Reference Martin and Stevenson2010, 510). This would imply a depreciation rate of about 0.7 or 0.8. However, this may be too restrictive as depreciation rate events three years ago weigh only about half (0.72=0.49). Rather, a higher rate seems appropriate. In this article, I will mainly apply a depreciation rate of 0.95 – yet re-run all analyses for 20 different depreciation rates between 0.80 and 0.99 (online appendix).
The actual calculation of the indicator is leaned on Bäck and Lindvall (Reference Bäck and Lindvall2015) and correlates strongly with their measure (r=0.84, n=1,011).Footnote 1 In an initial step, a measure for prospective cooperation is developed for each individual governing party j in country i in the year t:
 $${ Prospective}\,{ cooperation}_{{i,j,t}} {\rm \,{\equals}}\,(1{\minus}\delta )\mathop{\sum}\limits_{\tau \,{\equals}\,1}^{\tau \,{\equals}\,t{\minus}t_{0} } {\alpha _{{i,j,t{\minus}\tau }} } {\times}\delta ^{{\tau {\minus}1}} $$
where δ is a depreciation rate (δ=0.95 in the main analyses). τ denotes all past observations that are taken into account for calculating the indicator, starting with t−1 and ending with the first time point in the data set (1960 at the earliest). By multiplication with (1−δ), the sum of all past observations of prospective cooperation is normalised to an interval between 0 and 1. The degree of past cooperation is captured by α i,j,t−τ . If a current governing party (year t) has previously participated in government in year t−τ, there are three possibilities:
-
∙ It gets a maximum value of α=1 if it was in a coalition with the exact same partners in the past year t−τ.
-
∙ It gets a minimum value of α=0 if it was in a coalition with entirely different partners in the past year t−τ. Note that this also includes cases where a party has governed alone in the past, but now forms part of a coalition.
-
∙ It gets values between 0 and 1 if only a share of the current coalition partners have cooperated in government in the past year t−τ. The value is then the share of current governing parties that have cooperated with party j in that year.Footnote 2
For single-party governments and new governing parties, different logics apply, as a comparison of their current and past cooperation status is not straightforward.
-
∙ Single-party governments: according to the argument, the policymaking outcomes of coalitions’ past cooperation patterns need to be compared with the outcomes of parties governing alone, that is not cooperating with other parties. Foremost, therefore, the effect of single-party governments versus coalitions is captured by a separate dummy variable. For the cooperation variable, single-party governments are simply assigned a constant value (whose exact level is technically irrelevant, due to the additional dummy variable). In accordance with the view that parties can be seen as durable, stable coalitions of societal interests (Aldrich Reference Aldrich2011) with similar incentives like durable coalition governments to internalise fiscal preferences, parties governing alone in a given year get a maximum value of α=1.
-
∙ New governing parties: although they have not established any familiarity with other governing parties in the past, I assign new parties in government a maximum value of α=1. The reason is that otherwise the measure would “punish” a new party for not having participated in previous governments, even though it might be willing to collaborate and compromise in office. Its coalition partners, however, have a relative lack of familiarity with the new party, which reflects in a lower cooperation outlook for established parties. This is a compromise between the view that new parties should have low cooperation prospects due to their lack of familiarity with the established parties and the view that new parties should have high cooperation prospects because they have never “betrayed” the established parties.
These cases reveal that governing parties within one coalition may have different individual values of prospective cooperation. I argue that the foundation for durable cooperation depends on the elaborated amount of familiarity among all coalition partners, as “no coalition government is stronger than its weakest link” (Bäck and Lindvall Reference Bäck and Lindvall2015, 58). The effects of familiarity on future cooperation prospects therefore prevail for the coalition as a whole; otherwise, some parties could impede debt stabilisation agreements, lacking long-term cooperation perspectives. In a second step, the potential for prospective cooperation for a government in country i in the year t is thus the lowest value of prospective cooperation of any current governing party:
 $$Prospective\,cooperation_{{i,t}} _ {\rm \,{\equals}\,}min\,(Prospective\,cooperation_{{i,j,t}} )$$
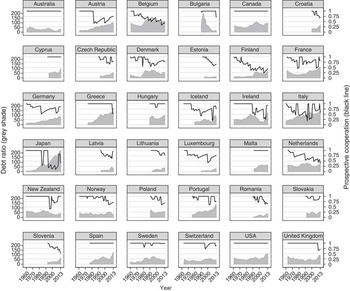
Figure 1 illustrates the development of prospective cooperation for each country, while also displaying the dynamics of debt ratios. In countries continuously ruled by one-party governments or unchanged coalitions, prospective cooperation always reaches the maximum value of 1 (Australia, Canada, Cyprus, Malta, Spain and US).Footnote 3 In the rest of the 36 democracies, prospective cooperation varies over time. For example, in the United Kingdom (UK), the conservative-liberal coalition government formed in 2010 has less potential for prospective cooperation because the Conservatives had governed alone since 1960, and the Liberals have no familiarity through shared governing experience with the Conservatives. Indeed, the Conservatives went back to governing alone after the elections in 2015.
Prospective cooperation and debt ratios, 1960–2013 Note: Debt ratio of Bulgaria in 1993 (292%) reduced to 200% for graphical reasons. Source: Own calculations based on Armingeon et al. (Reference Armingeon, Isler, Knöpfel and Weisstanner2015b, Reference Armingeon, Isler, Knöpfel, Weisstanner and Engler2015c).

In Switzerland, another system of generally stable coalition patterns, with the same parties forming the government between 1959 and 2011, there is a surprising dip in 1995. This is because in our data source, the SVP was re-coded to a right-populist party since 1995, and in effect became a “new” party (in an ideological sense). Thus, the expectations for the “old” parties for long-term cooperation with the new party are reduced. However, the indicator drops only moderately because three of the four parties can still count on a high amount of familiarity.
Austria is an illustrative case to see the intuition of the indicator. Until 1982, after a long series of grand coalitions between 1947 and 1966, the SPÖ and ÖVP governed alone. In 1983, prospective cooperation decreases below 0.5 after the SPÖ for the first time entered a coalition with the FPÖ. The socialists thus have a high potential for “betrayal” against its partner because they had governed alone or with the ÖVP for such a long time. During the four-year government term, prospective cooperation slowly increases again. However, it slightly decreases again in 1987 with the next grand coalition between SPÖ and ÖVP, because the Social Democrats now have a betrayal potential against the Christian Democrats, too. Until 2000, prospective cooperation steadily increases under consecutive grand coalitions. It then falls again with the first coalition between ÖVP and FPÖ in 2000.
Japan is another demonstrative example. Until 1983, the Liberal Democrats governed alone. Between 1983 and 1986 and between 1994 and 2009, however, they had a series of small coalition partners. These have no familiarity because of the long-standing hegemony of the Liberal Democratic Party (LDP) and could not anticipate being a long-term part of a coalition government. Finally, the new accession countries of the EU in Central and Eastern Europe start from comparatively high levels of prospective cooperation because their party systems are dominated by new parties (Powell and Tucker Reference Powell and Tucker2014). However, there are also clear downward trends in countries like Estonia, Latvia and Slovenia because of unstable coalition patterns in the 2000s. Such downward trends, as well as increasing volatility over time, are observable on average in all countries. This can possibly be explained by party system changes, but in any case the cross-national variation remains considerable.Footnote 4
Looking at bivariate associations reveals negative but rather weak correlations between country-level averages of prospective cooperation and debt changes: r=−0.07 (n=36, p=0.69) for all countries and r=−0.17 (n=30, p=0.38), excluding countries with permanent maximum values of prospective cooperation due to one-party governments. Correlation coefficients within countries are negative in 21 countries (significant on the 90% level in Belgium, Croatia, Estonia, France, Greece, Iceland, Japan, Portugal, Romania, Slovenia, Sweden and UK) and insignificantly positive in nine countries (p>0.1 in all countries). Average debt changes confirm the theoretical expectations. One-party governments (average annual debt change 0.85% of GDP, n=532) and coalition governments with high values for prospective cooperation (debt change 0.80% of GDP, n=412, prospective cooperation>0.78) both have substantially lower debt increases than coalitions with low values for prospective cooperation (debt change 1.80% of GDP, n=418).
Control variables
These bivariate correlations should be scrutinised in a multivariate model controlling for alternative influences on debt changes. The variables presented here allow a replication of the models of Bäck and Lindvall (Reference Bäck and Lindvall2015). Their models in turn are based on the comprehensive empirical study by Franzese (Reference Franzese2002, Chapter 3). Control variables are from Armingeon et al. (Reference Armingeon, Isler, Knöpfel, Weisstanner and Engler2015c) and are described in detail in the online appendix. First, a number of economic control variables are introduced. The lagged values of debt changes and levels control for persistence of debt trajectories (see also a statistical motivation below). In addition, higher debt growth should be immediately caused by higher unemployment levels and changes, lower GDP growth. Fiscal pressure, which Hypothesis 3 expects to increase the effects of prospective cooperation, is operationalised as the leverage of GDP growth minus inflation minus nominal interest rates on lagged debt levels. The openness of the economy is not included in the main models as it proved insignificant.
Second, election years (binary indicator, 1=election year) should temporarily lower the effects of prospective cooperation, according to Hypothesis 2. Third, to disentangle cooperation effects from government stability (Bejar et al. Reference Bejar, Mukherjee and Moore2011), I include a measure for government duration based on the average duration of past government in days (applying a depreciation rate of 0.95).
Fourth, the cabinet share of left-wing parties is included as a control variable. The expected effects are somewhat ambiguous and may depend on macroeconomic conditions (Cusack Reference Cusack1999). Fifth, Edin and Ohlsson (Reference Edin and Ohlsson1991) associate minority governments (1=minority in parliament) with higher deficits, but this has been contested (de Haan and Sturm Reference de Haan and Sturm1997). Sixth, according to Hypothesis 4, the impact of prospective cooperation may be conditional on sufficiently centralised budget institutions under the control of strong finance ministers (Hallerberg and von Hagen Reference Hallerberg, Strauch and von Hagen1999). Thus, I include the “delegation index” by Hallerberg et al. (Reference Hallerberg and von Hagen2009, 74) in some models. Data are available for 15 European countries and three time points only. I assign the value from 1991 backwards until 1960 and the value from 2000/2004 until 2012. Values between 1991 and 2000/2004 are linearly interpolated.
Finally, constitutional veto players need to be taken into account (Tsebelis Reference Tsebelis2002). I include indices for presidentialism (0=parliamentarism, 1/2/3=semi-presidentialism/hybrid systems, 4=presidentialism), federalism (0=no, 1=weak, 2=strong) and bicameralism (1=unicameralism, 2=weak bicameralism, 3=medium-strength bicameralism, 4=strong bicameralism).
Method
Standard political economy analyses often utilise pooled TSCS regression methods using annual data. In this article, I use two approaches to study the association between governments’ prospective cooperation and changes in debt ratios. First, within the TSCS framework, “autoregressive distributive lag” (ADL) models are applied, which enable me to discern short- and long-run relations. Second, I use cabinets as the unit of observation instead of country-years to avoid some pitfalls of the standard TSCS analysis.
TSCS analysis
ADL models enable one to identify the temporal impacts of governments’ cooperation patterns. An ADL model is a “general model” in the sense that it makes no restrictive a priori assumptions about the dynamic associations between X and Y variables (De Boef and Keele Reference De Boef and Keele2008; Beck and Katz Reference Beck and Katz2011). The model is specified as follows:
 $$\Delta DebtRatio_{t} \,{\rm {\equals}\,}\alpha _{{\rm 0}} {\plus}\alpha _{{\rm 1}} \Delta DebtRatio_{{t{\minus}1}} {\plus}\beta _{0} {\mib{X}} _{t} {\plus}\beta _{1} {\mib{X}} _{{t{\minus}1}} {\plus}{\varepsilon}_{t} $$
where ΔDebtRatio is the annual change of general government debt in percentage of GDP and
X
is a vector of independent variables. β
0 estimates the immediate short-term effect and β
1 the effect of previous levels of
X
on debt changes. Including the lagged dependent variable α
1 allows the calculation of long-run multipliers (LRM)
 $${\rm LRM \,{\equals}\,}{{\beta _{0} {\plus}\beta _{1} } \over {1{\minus}\alpha _{1} }}$$
, which estimate the total long-run effect of an impact variable
X
. ε
t
is an idiosyncratic error term.
The estimation of the ADL with ordinary least squares regression depends on four assumptions, which tests show to be consistent. First, throughout the whole sample, the dependent variable seems to be stationary and not containing unit roots.Footnote 5 Second, Lagrange multiplier tests find no significant serial correlation among the residuals.Footnote 6 This avoids endogeneity bias risks by introducing the lagged dependent variable (Keele and Kelly Reference Keele and Kelly2006). Third, spatial correlation among the error terms and panel heteroscedasticityFootnote 7 require the use of “panel-corrected” standard errors (Beck and Katz Reference Beck and Katz1995). Fourth, tests hint that the data do not suffer from unobserved heterogeneity between countries.Footnote 8 Therefore, no country fixed effects need to be included (the results explaining variation within coalition governments remain robust in fixed-effects models, however). To control for common exogenous shocks and time trends, I include a year counter, and its squared and cubic transformations. Results are substantially identical using year fixed effects.
Government-centred analysis
TSCS data have a number of disadvantages. Their focus on annual short-term changes ignores that governing occurs with implementation lags. Moreover, government output is to some degree driven by electoral cycles, which naturally includes governmental changes in the middle of the calendar year. An alternative to TSCS data is therefore to set the unit of observation at the cabinet level, so that each observation captures the relevant average characteristics of one government.Footnote 9 As cabinet duration varies greatly, I control for the number of days governments were in office. Models are estimated with ordinary least squares (OLS) regression and panel-corrected standard errors. The main advantage of using this cabinet-centred data structure is a more realistic focus of the government as a main actor shaping policy (Boix Reference Boix1997; Obinger et al. Reference Obinger, Schmitt and Zohlnhöfer2014).
Results
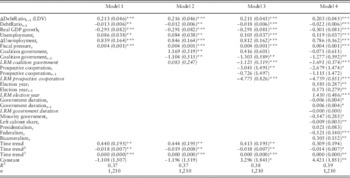
The empirical evidence presented in this chapter is based, first, on ADL models and then revisited with the government-centred data setting. The first model in Table 1, an economic baseline model, shows the expected debt increases when the economic situation deteriorates. Model 2 finds a significant positive association between coalitions and debt in the short term, but no long-run relationship.Footnote 10 As argued in this article, crucial variation seems to be located within coalition governments. Model 3, introducing the measure for prospective cooperation, finds a significant difference between coalitions with short and long time horizons. Coalitions with future cooperation prospects are associated with lower debt increases both in the short and in the long run. In substantive terms, expected annual debt increases are about 1 percentage point lower, on average, if the value for prospective cooperation increases by 1 standard deviation (about 0.2 units). Moreover, coalitions with maximum cooperation prospects are now related to significantly lower debt changes in the long run compared with single-party governments (see below).
Autoregressive distributed lag regressions of annual debt changes

Note: *p<0.1; **p<0.05; ***p<0.01 (two-sided tests), panel-corrected standard errors in parentheses.
LDV=lagged dependent variable; GDP=gross domestic product; LRM=long-run multipliers.
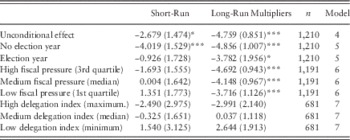
Model 4 completes the set of political and institutional control variables, and the strong effects of prospective cooperation remain unaltered. Again, prospective cooperation has a substantial effect. In a hypothetical example, if the value for prospective cooperation decreased from 1 to 0.5, debt would grow from 80 to 128% of GDP within 20 years, all else equal.Footnote 11 Impulse response functions (IRF) from Model 4 show that the effect of prospective cooperation is −2.68 in the first year, −1.66 in the second year, −0.34 in the third year and −0.07 in the fourth year (see the IRFs in Figure A4 in the online appendix).
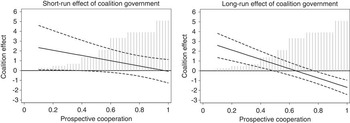
The coefficient for coalition governments – the difference between coalition and single-party governments – needs to be interpreted conditionally on values of prospective cooperation, as one-party governments always take the maximum value of 1.Footnote 12 Figure 2 shows the marginal effects of coalition governments. In the short run, debt growth under coalitions and one-party governments is not significantly different. In the long run, however, coalitions with prospective cooperation values over 0.78 have significantly lower debt increases compared with one-party governments (on the 95% level). These comprise more than 45% of all coalition governments. On the other hand, coalitions with a prospective cooperation score below 0.48 have significantly higher debt increases than single-party governments. These findings indicate that – consistent with the main hypothesis – the higher number of parties in coalitions does not directly lead to common pool problems, but that coalitions with long time horizons can be superior even to single-party governments based on their ability to generate broad political support for controversial reform policies.Footnote 13
Group difference between coalition and single-party governments Note: Dashed lines are 95% confidence intervals. Vertical grey lines show distribution of prospective cooperation (coalition governments only); based on Model 4.

The control variables show that – apart from a short-term impact – government duration is not significantly associated with lower debt increases. Federalism has the expected negative effect, whereas presidentialism and bicameralism show no clear, robust effects. Minority and left-wing governments are related to lower debt increases (cf. Alesina and Perotti Reference Alesina and Perotti1995).
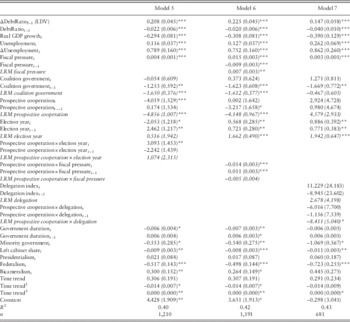
Table 2 (regressions) and Table 3 (marginal effects) account for the possibility that the effect of prospective cooperation is conditioned by other explanatory factors. Model 5 shows that the effect of prospective cooperation is weakened in election years, but stronger in non-election years, as expected in Hypothesis 2 following the political business cycle logic. Model 6 finds that prospective cooperation is most clearly related to lower debt growth when fiscal pressure is high. This provides some evidence for the assumption in the theoretical argument in Hypothesis 3 that coalitions with a longer time horizon effectively care more about future debt costs. When the fiscal situation is comfortable, cooperation effects are weaker – presumably because governments can afford fiscal expansion without endangering long-run debt sustainability. Finally, Model 7 indicates that the impact of prospective cooperation is stronger with centralised budget process institutions and strong finance ministers (high delegation index, Hypothesis 4). However, the data for delegation are suboptimal, and the interaction between delegation and prospective cooperation is only narrowly significant at the 90% level, which indicates that this finding should be tested more carefully in future research.Footnote 14
Autoregressive distributed lag regressions of annual debt changes

Note: *p<0.1; **p<0.05; ***p<0.01 (two-sided tests), panel-corrected standard errors in parentheses.
LDV=lagged dependent variable; GDP=gross domestic product; LRM=long-run multipliers.
Conditional effects of prospective cooperation

Note: *p<0.1; **p<0.05; ***p<0.01 (two-sided tests), panel-corrected standard errors in parentheses.
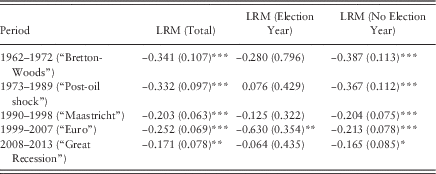
The results presented so far are robust to a variety of tests. First, revisiting measurement assumptions of prospective cooperation, any depreciation rate between δ=0.8 and δ=0.99 yields substantially identical long-run effects (see Figures A1 and A2 in the online appendix). Second, the results are robust to alternative specifications of the dependent variable, such as non-extrapolated debt changes, total government expenditures or government deficits. Third, findings remain unchanged with the inclusion of other control variables (a dummy variable for governments consisting entirely of new parties; number of new parties in governments; total ministers as a proxy for the number of spending ministers; formal budgetary rules; openness of the economy; number of parties in government; effective number of parties in parliament; government support in parliament; or dummy variables for the Eurozone, caretaker or technocratic cabinets, oversized or minimal winning coalitions and proportional representation electoral systems). Fourth, the results are robust to several alternative methodological choices.Footnote 15 With country fixed effects, the difference between single-party and coalition governments is not significant (Model A1 in the online appendix), but as these are within-group effects, all countries with constant single-party, or more importantly constant coalition government, are disregarded. Fifth, there is only a limited risk of endogeneity and reverse causality – that is debt shocks disarranging historical coalition patterns – as debt changes, especially in the long run, are not significantly leading to changes in prospective cooperation (Models A4–A8 in the online appendix). A substantive issue concerns the assumption of parameter heterogeneity in pooled time-series analysis (Plümper et al. Reference Plümper, Troeger and Manow2005). I construct five period dummies in order to test how the effect of prospective cooperation varies over time: a “Bretton-Woods” period (1962–1972); a “post-oil-shock” period (1973–1989); a “Maastricht” period (1990–1998), capturing increased volatility in the 1990s partly associated with the convergence efforts of the Maastricht treaty in Europe; a “Euro” period (1999–2007), witnessing the introduction of the common currency in the Eurozone; and a “Great Recession” period (2008–2013), capturing the economic crisis. These period dummies are interacted with the prospective cooperation variable. The regression coefficients are then standardised in order to compare the relative magnitude of the effects.
Table 4 shows that the substantive debt impact of prospective cooperation is greatest until the 1980s, possibly because influencing the economy through Keynesian demand management was still feasible. The effect has been attenuated in the 1990s and 2000s. During the Great Recession since 2008, the magnitude of the effect is relatively small, which comes as no surprise as governments of all forms increasingly relied on austerity policies (Armingeon and Baccaro Reference Armingeon and Baccaro2012).
Time-varying effects of prospective cooperation
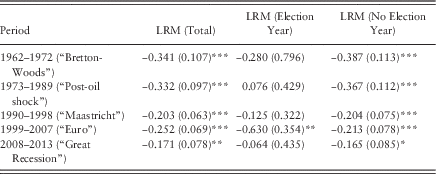
Note: Standardised coefficients: B i =β i (s i /s y ).
*p<0.1; **p<0.05; ***p<0.01 (two-sided tests), panel-corrected standard errors in parentheses; based on Models 4 and 5.
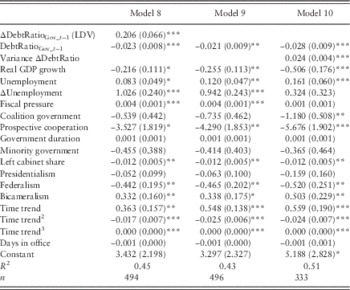
Finally, Table 5 shows the results of the government-centred regression analysis, which overcomes some drawbacks of TSCS data. Model 8 is a replication of Model 4, whereas Model 9 excludes the lagged dependent variable, which theoretically makes less sense because cabinets should be more independent units of observation than country-years. The findings corroborate the effect of coalitions’ prospective cooperation: on average, throughout entire administrations, coalitions with a prospective cooperation score of 1 are associated with debt increases 2.1 percentage points lower than coalitions with scores of 0.5 (Model 9). However, the results find no significant difference between single-party governments and coalitions with high cooperation prospects. As argued in the theoretical section, broad coalitions are potentially better suited to implement debt stabilisation policies with their ability to spread blame and policy accountability across several actors – yet they also need more time to agree on policy change. This implies that the average values used in this government-centred analysis may cloud these policymaking differences between coalitions and single-party governments. Indeed, when controlling for the variance of cabinets’ debt changes (expectedly higher under coalition governments) in Model 10, coalition governments with high cooperation outlooks are associated with significantly lower debt accumulation rates than one-party governments. These results remain robust when short-term governments, which were in office less than six months, are excluded.
Regressions of average debt changes per government

Note: *p<0.1; **p<0.05; ***p<0.01 (two-sided tests), panel-corrected standard errors in parentheses. Unit of observation: cabinets. All variables are average values per cabinet. Only governments in office for at least six months are considered (results are robust if more short-lived governments are included as well).
Conclusion
Do durable cooperation patterns among governing parties help to keep debt dynamics in check? The evidence presented in this article, based on a comparison of 36 democracies over the time period from (up to) 1962 to 2013, shows that coalitions with high chances for “prospective cooperation” are indeed associated with lower debt increases – compared with both coalitions of parties less familiar through past shared-governing experiences and with single-party governments.
The assumptions behind the theoretical argument are that the familiarity gained from governing together increases the chance of future cooperation (Franklin and Mackie Reference Franklin and Mackie1983; Martin and Stevenson Reference Martin and Stevenson2001, Reference Martin and Stevenson2010) and that those coalitions with governing prospects care about the future costs of debt. Under these conditions, for which I provide empirical support, incentives for coalition governments to externalise the future costs of debt are reduced significantly. Echoing a recent argument put forward by Bäck and Lindvall (Reference Bäck and Lindvall2015), this challenges standard fragmentation and veto-player approaches, where long-term considerations by political actors are often absent (Roubini and Sachs Reference Roubini and Sachs1989; Tsebelis Reference Tsebelis2002; Bawn and Rosenbluth Reference Bawn and Rosenbluth2006). This is problematic as long-lasting cooperation might be a strategy to overcome some of the opportunity problems arising from intertemporal insecurity over future events (Lupia and Strøm Reference Lupia and Strøm2008).
Moreover, and going beyond Bäck and Lindvall (Reference Bäck and Lindvall2015), I found some evidence that fiscal policymaking is not reducible merely to veto actor or common pool resource problems. The literature on consensus government highlights that the assumptions from veto player theories are often insufficient to incorporate issues of electoral support for controversial policies. In this view, broad and durable coalitions indeed have advantages over one-party governments to negotiate reform packages with a fairly balanced distribution of the burden and gains across several societal groups and to share the blame for unpopular policy measures (Katzenstein Reference Katzenstein1985; Lijphart Reference Lijphart2012).
Does cooperation stability have the same effects for ideologically broad coalitions (such as the grand coalitions in Austria, Germany or Switzerland) as for ideologically narrower, but durable, coalitions (e.g. the Swedish centre-right alliance)? How do the distinct veto actor constellations between one-party and coalition governments affect their time requirements and timing to agree on policy change? Finally, do budgetary institutions such as the delegation of fiscal authority to the finance minister interfere with coalitions’ striving for fiscal policy agreements? These issues, not yet fully answered in this analysis, merit further study to better understand economic policymaking differences between one-party and multi-party types of government. The evidence, however, is compelling that long-sighted coalition behaviour pays off to reach particular policy goals.
Acknowledgements
For valuable comments and suggestions, the author thanks Klaus Armingeon, Sarah Engler, Drew Sampson and Isabelle Stadelmann-Steffen, the participants of the “Social Policy and Political Economy” workshop at the Annual Congress of the Swiss Political Science Association in Basel in January 2016, as well as the coeditor of Journal of Public Policy, Fabrizio Gilardi, and two anonymous reviewers. Replication data are available at http://dx.doi.org/10.7910/DVN/KKQOAS.
Supplementary Material
To view supplementary material for this article, please visit http://dx.doi.org/10.1017/S0143814X16000040