INTRODUCTION
The fast replacement of cultivars with newer ones allows farmers to exploit more fully the genetic gains from plant breeding. Pandey et al. (Reference Pandey and Rajatasereekul1999) found that benefits from expensive plant breeding research were greatly reduced with delay in the adoption of new varieties because future benefits are less valuable than the same benefits realised in the present. Hence, cost effectiveness increases when newer varieties replace older cultivars with little delay (Brennan and Morris, Reference Brennan, Morris, Reynolds, Ortiz-Monasterio and McNab2001; Tripp et al., Reference Tripp, Louwaars, Joost van der Berg, Virk and Witcombe1997). Fast replacement also reduces the risk of pest outbreaks and disease epidemics on older and obsolete varieties.
How quickly cultivars are replaced depends on supply and demand. Supply is determined by the seed regulatory framework (Tripp, Reference Tripp1997), extent of popularisation by government agencies and amount of investment of seed producers in the public and private sectors in the marketing of new cultivars. Supply constraints are important as the process of popularisation and marketing of new cultivars in developing countries is often very slow and inefficient (Tripp, Reference Tripp1997; Witcombe et al., Reference Witcombe, Devkota and Joshi2010). Demand is determined by the extent of knowledge farmers have about new varieties, and the willingness of farmers to grow the new cultivars that is largely dependent on how superior the new cultivars are to the ones they should replace (Byerlee and Heisey, Reference Byerlee, Heisey and Heisey1990). Hence, breeding programmes that provide a constant flow of improved and competitive varieties greatly encourage the fast replacement of old varieties. The absence of detectable yield differences between improved and traditional crop varieties is believed to be the determinant in the disadoption of improved varieties (Walker et al., Reference Walker, Alwang, Alene, Ndjuenga, Labarta, Yizgezu, Diangne, Andrade, Murthoni Andriatsitona, De Groote, Mauch, Yirga, Simotowe, Katungi, Jogo, Jaleta, Pandey, Charyulu Kumara, Walker and Alwang2015).
In developed countries, high varietal replacement rates result in low average ages. For example, the average age of cultivars in important crops such as wheat was only about 3 years in the United Kingdom (Witcombe et al., Reference Witcombe, Packwood, Virk, Witcombe, Virk and Farrington1998), while in case of irrigated wheat, farmers in the Yaqui valley of Mexico replace their varieties every 3–4 years on an average and in the corn belt of the USA, farmers adopt newer maize hybrids every 2–3 years (Walker, Reference Walker, Walker and Alwang2015). In contrast, cultivars were older in developing countries using the measure of weighted average age (Byerlee and Heisey, Reference Byerlee, Heisey and Heisey1990) where the age, defined as the years since release, of every modern variety (MV) in the analysis is weighted by its proportion of the total. For example, in India, in rice, wheat, pearl millet, maize, sorghum, groundnut and chickpea, the weighted average age of varieties under demand for breeder seed from 1984 to 1993 averaged 12.5 years across these seven crops. It was 14.5 years for certified seed production of these crops from 1992 to 1994 in the Indian states of Gujarat, Rajasthan and Madhya Pradesh. More recently, Krishna et al. (Reference Krishna, Spielman and Veettil2016) found the average age of wheat cultivars under demand from breeder seed on an all-India basis was 9 years in 1997 and 12 years in 2009. Wheat varieties for which breeder seed was in demand in India from 1986 to 1989 were 9 years old (Witcombe et al., Reference Witcombe, Packwood, Virk, Witcombe, Virk and Farrington1998).
A recent study in Sub-Saharan Africa by a project Diffusion and Impacts of Improved Varieties in Africa (DIIVA) included 21 crops and 30 countries. The study produced a database of 3500 formally or informally released varieties and more than 1150 improved varieties that were adopted by farmers in 2010 (Walker et al., Reference Walker, Alwang, Alene, Ndjuenga, Labarta, Yizgezu, Diangne, Andrade, Murthoni Andriatsitona, De Groote, Mauch, Yirga, Simotowe, Katungi, Jogo, Jaleta, Pandey, Charyulu Kumara, Walker and Alwang2015). These very large surveys used weighted average age to indicate the rate of varietal turnover. Across the 21 crops the average age was 14 years (from 10.2 for banana and 20.7 for Faba bean). The average age of MVs of rice was 15.8 years (for an average of four countries) but adoption of MVs was only 38%.
A widely employed quantitative index of varietal replacement is the proportion of recent varieties grown in farmers’ fields or, its converse, the proportion of older varieties (Brennan, Reference Brennan1984). Gauchan and Pandey (Reference Gauchan, Pandey, Pandey, Gauchan, Malabayabas, Bool-Emerick and Hardy2012) used this latter measure in a survey of the rice varieties grown in 2008 by 1900 farm households in Bangladesh, India (four states including Assam) and Nepal. They defined MVs as older, if they were at least 18 years old (pre-1990). In the surveyed regions, the area under older MVs averaged 94% in Bangladesh, 60% in Nepal and 62% in India. Only in Assam there were younger MVs in majority (45% older MVs). In Nepal in 1997, in early season (Chaite), rice in two Terai districts of Nepal, Chitwan and Nawalparasi, over 90% of the area was devoted to a 38-year-old variety (Rana et al., Reference Rana, Joshi, Gyawali and Witcombe2004; Witcombe et al., Reference Witcombe, Joshi, Rana and Virk2001).
Hossain et al. (Reference Hossain, Bose and Mustafi2006) reported on the MVs that Bangladeshi farmers were growing. In the wet season of 2000, MVs occupied half of the rice area and of these the old variety BR11 (released in 1980) was the most popular.
Reports on spatial diversity are less common. Hossain and Jaim (Reference Hossain, Jaim, Hossain, Jaim, Paris and Hardy2012) examined spatial diversity of four popular rice varieties in Bangladesh. In the main (Amman) season, the Indian variety Swarna was heavily concentrated in the border districts covering 12% of the area, while BR11 occupied 27% of the area and was concentrated in other regions/districts with some area overlapping with Swarna, particularly in the northwestern region of Bangladesh. In the post-Amman season (Boro), BRRI dhan29 was heavily concentrated in the relatively low-lying area in the middle part of Bangladesh, while BRRI dhan28 was concentrated in relatively highland areas and southwestern coastal districts. The two Boro rice varieties together occupied 60% of the rice area (Hossain and Jaim, Reference Hossain, Jaim, Hossain, Jaim, Paris and Hardy2012).
We report on a survey of varietal adoption across 18 Terai districts in Nepal that involved interviews with 3332 households – 1605 determined the rice varieties grown in 2008 and 1787 on those grown in 2011. This large sample size increased the reliability of the results. One objective was to examine how the ages of varieties differed across time (2008 and 2011) and space to be able to quantify the need for greater varietal turnover by region. A detailed analysis of spatial diversity provides vital information for planning targeted breeding programmes, particularly those that use only a few carefully chosen crosses (Witcombe et al., Reference Witcombe, Gyawali, Subedi, Virk and Joshi2013). It also provides vital information for planning popularisation programmes as greater spatial diversity demands more geographically targeted extension. These analyses provide the baseline for the second paper in this series on a method of accelerating varietal adoption through informal research and development (IRD) as exemplified by Joshi et al. (Reference Joshi, Devkota, Harris, Khanal, Paudyal, Sapkota and Witcombe2012). IRD is simply the distribution of many small packets of seed to farmers without the cost of supplying other inputs, and without the costs of detailed monitoring and evaluation.
MATERIALS AND METHODS
The Department for International Development (DFID) Research into Use Programme (RiUP) funded two projects in Nepal – a Rice Legume Project with the Non-Government Organisation (NGO) Local Initiatives for Biodiversity, Research and Development (LI-BIRD) as the leading organization and a Rainfed Rabi Cropping (RRC) Project with the NGO Forum for Rural Welfare and Agricultural Reform for Development (FORWARD) as the leading organisation. Scientists from Bangor University, Bangor, UK, were partners in both projects.
Baseline survey
In January 2009, a baseline survey was made by each NGO (Supplementary Table S1 (available online at http://dx.doi.org/10.1017/S0014479716000545)) in 18 districts. (For brevity these are always referred to as 18 Terai districts, although Tanahun is not a Terai district but a bordering district.) Each household was asked which rice varieties were grown in 2008 and on what areas.
In the survey made by LI-BIRD, an inventory of the rice growing Village Development Committees (VDCs) of nine project districts was prepared in consultation with staff from District Agriculture Development Offices (DADOs). In each district, the rice growing area was divided into three agro-ecological areas: the northern rainfed upland domain (always situated north of the East-West highway) that occupies about 15–20% of the rice area in the Terai; the central irrigated or partially irrigated domains (about 65–70% of the rice area in the Terai); and southern areas having poor drainage including water-logged areas during the rainy season (about 15–20% of the rice area in the Terai). In each district, four villages (VDCs) were randomly selected (except for five in Sarlahi), one from north of the highway, two from the centre and one from the south. A household list was collected from the Secretary of the selected VDCs and after non-farming households were removed, 36 households were randomly selected, 18 in each of two wards per VDC. In each ward, households from this list of 18 were interviewed in serial order until 12 interviews were made (if no suitable respondent from a household was available the next household in the list was tried). This normally gave 96 households per district, although the number varied slightly (Table S1). There were 104 in Sarlahi where five VDCs were surveyed. The effect of variable sample size was removed by averaging the district means so that each district had an equal weighting.
In each of the eight districts surveyed by FORWARD, two VDCs that well represented the upland rice domain were randomly selected from the total list of VDCs. Similarly, three were selected that well represented the medium land domain. From each selected VDC, two wards were again randomly selected. Following the same methods as described for LI-BIRD respondents from eight households in each ward were interviewed to make 80 households per district although in three cases one more household than planned was interviewed and kept in the survey (Table S1).
Analysis of the baseline data
The data of the baseline surveys of the two NGOs were combined and analysed by district. In each district, the area of each variety was summed across all households in the district and the proportion of rice land it occupied was determined as a percentage of the total area occupied by all the rice varieties of all of the surveyed households in the district. The overall proportion across districts occupied by a variety was determined as the mean of the percentages in each district. This could bias the results in favour of districts with small rice growing areas, so the district percentages were weighted by the rice growing area of the district using published data from the Ministry of Agricultural Agri-Business Promotion and Statistics Division, Agricultural Statistics Section. However, the correlation between the district means and the weighted district means was very high (r2 = 0.96), so we report on the analysis for the unweighted district means. The age of the varieties was estimated using the index of Byerlee and Heisey (Reference Byerlee, Heisey and Heisey1990). In any given year the age of a cultivar At is the number of years since its release. For each variety this age was weighted by the relative importance of the variety; the weight W1 of variety x = the area of variety x/sum of the areas of all the varieties. The total of the weighted ages ΣAt.W1 gives the average age of the cultivars grown in that year.
Resurvey of a sample of 469 households from the baseline survey
From November 2011 to January 2012, LI-BIRD and FORWARD interviewed five or six households in all of the 81 VDCs in the 18 districts in the baseline survey (FORWARD surveyed Morang district in 2009 for the baseline, but in 2011 it was resurveyed by LI-BIRD). This gave a randomly selected sample of 469 households from all baseline VDCs and sampled 29.2% of the baseline households. Households were asked which varieties they grew in the main season of 2011 and on what area.
A survey of a sample of 1318 households that received Informal Research and Development (IRD) kits in 2008
The two NGOs conducted IRD that was initiated at the Lumle Agricultural Research Centre in 1989–90 (Joshi and Sthapit, Reference Joshi and Sthapit1990; Joshi et al., Reference Joshi, Subedi, Rana, Kadyat and Sthapit1997). In the IRD programme, 50,123 households (LI-BIRD) and 22,275 households (FORWARD) received seeds (for details see the second paper in this series). Only those that had received seed in 2008 were surveyed from November 2011 to January 2012. The households were asked names and areas of the rice varieties they grew in 2011.
LI-BIRD surveyed 769 farmers in 11 districts in 148 VDCs (average of 72 farmers per district, and 5 farmers per VDC). FORWARD surveyed 549 farmers in seven districts in 79 VDCs (average of 78 farmers per district and 8 farmers per VDC).
The analysis was done on the combined survey of both NGOs and covered 17 districts and 1318 households with an average of 12 VDCs and 78 households per district (minimum 51 in Mahottari and maximum 83 in Banke). The analyses were done by averaging district means to give each district equal weighting and remove variation caused by the varying sampling size among districts.
RESULTS
Varietal diversity
In all of the 18 districts, varietal diversity weighted by area was low because a small number of varieties were grown on large areas. In the 2011 survey, an average of 1.7 varieties accounted for 50% of the area – this was made up of one variety in six districts, two varieties in ten districts and three varieties in two districts.
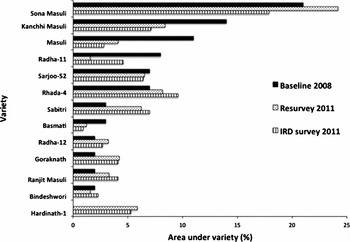
In all three surveys, the six most commonly grown varieties occupied the majority of the rice area and the most popular of these, Sona Mahsuri, occupied about a fifth of the total rice area (Figure 1). The popular varieties included the following:
-
• Sona Mahsuri (not released in Nepal but in Andhra Pradesh, India in 1982),
-
• Kanchhi Mansuli (introduced by NRRP in the late 1980s but not released),
-
• Masuli (a very old variety released in Nepal in 1973),
-
• Radha-11 (released in Nepal in 1994),
-
• Sarjoo-52 (not released in Nepal but in Uttar Pradesh, India in 1982),
-
• Radha-4 (released in Nepal in 1994),
-
• Sabitri (released in Nepal in 1979).
Proportions of rice land occupied by the most popular varieties in the three surveys, baseline for 2008 of 1605 households, baseline resurvey for 2011 of 469 households and IRD survey for 2011 of 1318 households. Varieties from top to bottom decrease in proportion occupied in 2008.

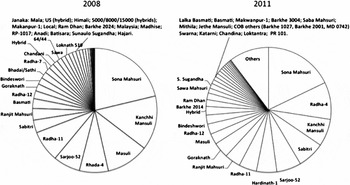
There was good agreement between the two 2011 surveys, so any changes between the 2008 and 2011 surveys are likely to be real differences and not due to sampling error. The most significant changes from 2008 to 2011 were the increase in popularity of Hardinath-1 (BG 1442), Sabitri (despite it being a very old variety) and Radha-4, and a decline in popularity for Kanchhi Mansuli, Masuli and Radha-11 (Figure 2). The diversity increased somewhat from 2008 to 2011 – five varieties occupied 50% of the area in 2011 instead of four in 2008, and 13 made up 75% of the area instead of nine in 2008 (Figure 2). The increased diversity in the top 75% in 2011 was through the addition of Hardinath-1, Gorakhnath, Radha-12 and Bindeshwori and reduced areas of Masuli and Kanchhi Mansuli.
Overall varietal composition by area in 2008 (left) and 2011 (right) – the mean of 18 district means across the Nepal Terai from the baseline survey of 1605 households and the IRD survey of 1318 households.

Geographical distribution of varieties
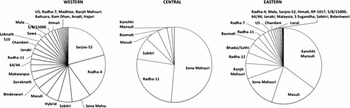
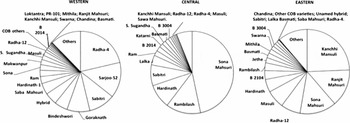
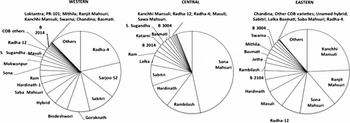
In both 2008 and 2011, the varieties that farmers grew differed greatly in the Terai districts from the west to the east (Figures 3 and 4). For example, the two most common varieties in the west in 2008 (comprising over 40% of the area) Sarjoo-52 and Rhada-4 were not grown in the east. In 2008, only Sona Mahsuri was among the top three varieties, in both the east and the west. In 2011, the differences were even more marked because the four most popular varieties in the west and the east had no variety in common (Figure 4). In both 2008 and 2011, the central districts differed markedly from both the eastern and the western districts as they had a much lower varietal diversity caused by the high predominance of Sona Mahsuri and Radha-11.
Varietal composition by area in the Terai in 2008 in seven western districts (from Kanchanpur to Tanahun), five central districts (Bara to Dhanusha) and six eastern districts (from Siraha to Jhapa). District names abbreviated (full names in Table 1).

Varietal composition by area in 2011 in seven western districts (from Kanchanpur to Tanahun), five central districts (Bara to Dhanusha) and six eastern districts (from Siraha to Jhapa). District names abbreviated (in full in Table 1).
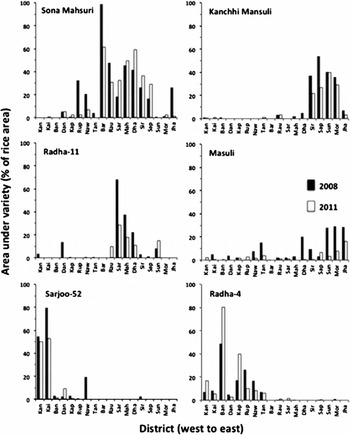
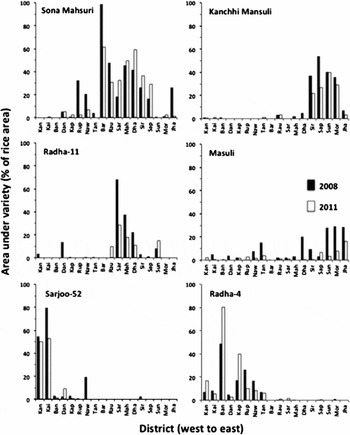
The six most popular varieties overall in 2008 were adapted to specific areas in both 2008 and 2011 (Figure 5). The distribution patterns of the varieties between 2008 and 2011 were consistent, so the factors determining their adoption were stable over time. The distribution patterns were marked: Kanchhi Mansuli was grown in districts only in the east, Sarjoo-52 and Rhada-4 only in the west, Radha-11 was grown predominantly in central districts and even though Sona Mahsuri and Masuli were more widely distributed from west to east, Sona Mahsuri was not grown in the three eastern-most districts and Masuli was more popular in the east.
Distribution in 2008 and 2011 of the six most popular varieties from west to east in 18 Terai districts in both 2008 and 2011 (1605 households in 2008 and 1318 households in 2011). District names abbreviated (in full in Table 1).
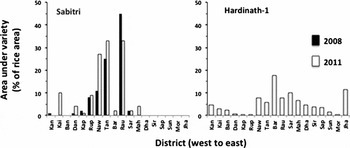
In 2011, there were two popular varieties, Sabitri and Hardinath-1, that were not among the top six in 2008. Sabitri was not grown at all in the most eastern districts and was most popular in the mid-western districts (Figure 6). Hardinath-1 showed the widest adaptation of all the varieties because of its early maturity: during main rice growing season, it is an early upland variety in the west and east while in the east it is also grown in the Chaite season.
Distribution from west to east in 18 Terai districts of Sabitri and Hardinath-1 that were not among the six most popular varieties in 2008 but were in 2011. Distribution of Sabitri in 2008 for 1605 households and in 2011 for 1318 households. Distribution for Hardinath-1 is for the 1781 households in the baseline resurvey and IRD survey. District names abbreviated (in full in Table 1).

Age of varieties
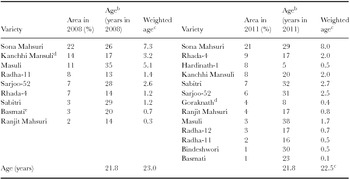
The age of the varieties that farmers grew in 2008 was compared with the ones grew in 2011, with the latter being for the combined data of the baseline resurvey and the IRD survey. In both years, among the most popular varieties that covered 76% of the area, only two were less than 15 years old and the varieties had an average age over 20 years (Table 1). Older varieties were somewhat more frequent among these popular varieties, so the weighted average ages were a little higher than the average age. Increased adoption from 2008 to 2011 of the newer varieties Hardinath-1 and Radha 4 and decreased adoption of older varieties Masuli and Kanchhi Mansuli (Figure 4) compensated for all the varieties becoming three years older – the age of the varieties was the same in 2008 and 2011 (Table 1).
The age of varieties that occupy 76%a of the rice area across all 18 districts in the Nepal Terai, in 2008 and 2011 from a survey of 1605 households in 2009 and 1787 households in 2011.

a Compared with Figure 1, the areas are equalised to 76% by removing three least frequent varieties from 2008 baseline.
b Age (number of years from release to either 2008 or 2011).
c Age weighted by area of each variety (see Materials and Methods).
d Age of variety not known – given age from when first seen in farmers’ fields.
e Age of variety not known – most likely an old variety (age assumed to be 20 in 2008).
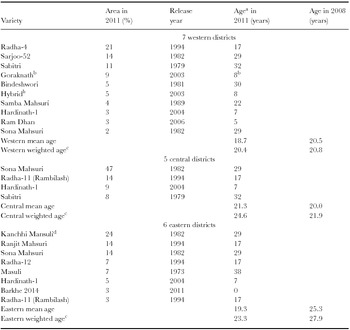
As the differences in the rice varieties grown from east to west were very marked (Figure 4), the age of the varieties in three groups of districts was considered (Table 2). Of the varieties that occupied most of the area (78%) only four in the western districts and one each in the central and eastern districts were newer varieties that had been released after 1994. The newer variety Barkhe 2014 in the eastern districts was excluded, as it was promoted by IRD (see the second paper in this series). The age of the popular varieties that occupied 78% of the area in the eastern districts was somewhat higher than that in the west. The younger age in the west may be erroneous as hybrids were only popular in the western districts and were considered to be only 5 years old – this is a supposition and they could be much older. The central districts had the highest weighted age of nearly 25 years because of the high area devoted to the old variety Sona Mahsuri.
The age of varieties that occupy about 78% of the rice area in three regions in the Nepal Terai in 2011, from a survey of 1318 households in 2011 compared with the baseline mean data for 1605 households for 2008.

aAge (no. of years from the year of release to 2011).
bAge not known so assumed to be a recent variety.
cAge weighted by area of each variety (see Materials and Methods).
dAge not known – given age first seen in farmers’ fields.
Although there was no overall significant change in the age of varieties from 2008 to 2011, there were some regional differences. From 2008 to 2011, the weighted ages of the varieties decreased slightly in the western districts by 0.4 years and increased in the central districts by 2.7 years (about the same as the time period of three years). They became less old in the eastern districts (by 4.6 years) but despite this they were still older than the varieties in the western districts.
DISCUSSION
Varietal diversity and spatial distribution
The reasons as to why the patterns are so complex are many. Rice growing environments in the Terai vary in rainfall pattern, irrigation, land type and the interactions between them. Difference can be large as we considered an area spanning 1000 km from the west to east and 110 km from north to south (western districts are more northerly than eastern districts). Rice in the western Nepal is planted and harvested three weeks earlier (field observations K.D. Joshi, 2002). In addition to these climatic differences, the rice domain – the amount of upland, medium and lowland – found in each district varies. There are no reliable data on the areas of each rice domain per district but generally the western districts have more upland and the eastern districts have more lowland. Varieties have been selected by farmers to be adapted to these differences in climate and rice domain, so the ones more popular in the west were earlier than those in the east (Table S2). The short duration rice varieties in the western region will provide a satisfactory yield whilst providing a harvest early enough for the following wheat crop to be sown sufficiently early. In the warmer eastern districts, longer duration rice that yields more can be grown because wheat can be sown later.
From our participatory studies, it is probable that the markets for unmilled rice (paddy) and processed rice are major factors in driving local adaptation. As a variety becomes locally popular, the rice millers become familiar with its milling characteristics, eating qualities and market price, and find it easier to sell the processed grain as demand builds. The millers are then increasingly willing to purchase the variety who, because of economies of scale, prefer to deal in as few varieties as possible.
Markets play an important role in the adoption of ‘Masuli’-type varieties that have the names Masuli, Mansuli and Mahsuri. In 2008, 36% of the rice area was occupied by these ‘Masuli’ varieties while it was 49% in 2011. All ‘Masuli’ varieties are commonly called ‘Mansuli’ in Nepal. We name them here as Masuli because this is the official (variety release) name in Nepal; Kanchhi Mansuli as it is not released and only has a common name in Nepal; Sona Mahsuri, Ranjit Mahsuri and Samba Mahsuri as these are the official release names in India. Nepali consumers have very strong preference for these ‘Masuli’ rice varieties that are typified by golden-coloured husks, creamy-coloured medium fine grains and good cooking and eating quality. It is a well-established name for rice that provides the daily diet of people particularly for the middle social strata (Joshi et al., Reference Joshi, Biggs, Gauchan, Devkota, Devkota, Shrestha and Sthapit2005). This makes it likely that traders’ preferences based on consumers’ demand drives the adoption of ‘Masuli’ varieties over others.
Initial seed availability must also play a role. Ranjit Mahsuri is only popular in the eastern districts and the variety originates from the neighbouring Indian state of Assam. Sarjoo-52 is most popular in western districts and these are closest to the Indian state of Uttar Pradesh, where the variety was first produced. The ample source of seed conveniently found across a porous border would obviously help kick start the adoption of these varieties. Once popular, the main seed source would be farm-saved seed. However, regular imports from India take place even though this is contrary to the seed laws in Nepal (N.P. Khanal personal communication). Although Sarjoo-52 is neither released nor registered in Nepal, two seed companies (anonymous because of their contravention of seed laws) were, in 2015, producing and selling truthfully labelled seed in Kailali and Kanchanpur districts, where Sarjoo-52 is most widely grown. The companies collected breeder seed of this variety from the Breeder Seed Production Centre, Pantnagar, India. In 2008, this variety contributed about 65% of the total rice seed sold by these companies in these districts (Rawal et al., Reference Rawal, Ojha, Bhatta, Joshi and Singh2008). The seed companies produced the variety because of a ready market – they reported that local Tharu communities prefer this variety for many reasons, including its eating quality, its earliness and tolerance to drought.
Age of varieties
The age of the rice varieties in the Nepal Terai was consistently more than 20 years, whether in 2008 or 2011 and no matter what region of the Terai was considered. This age is consistent with the findings of Pandey et al. (Reference Pandey, Velasco, Yamano, Walker and Alwang2015), who reported that average rice varietal age in Nepal was 20 years based on the expert elicitation (EE) method and 24 years based on a household survey. Weighted age was consistently higher than average age no matter what region or year was considered, although the differences were usually not substantial. Hence, among the old varieties there was a trend for the oldest of them to be somewhat more frequent. Witcombe et al. (Reference Witcombe, Packwood, Virk, Witcombe, Virk and Farrington1998) found in India for various crops including rice that older varieties were more frequently grown so that weighted ages were higher than average ages.
Recently released varieties, if grown at all, were found among the least frequently grown rice varieties, i.e., were in the last 25% of the rice area when the varieties were ordered by the rice area they occupied. The only exception was Hardinath-1, released in 2004, that was the sixth most popular variety overall in 2011 that provides an example of the effectiveness of IRD (the topic of the second paper in this series) in causing the rapid adoption of a variety (Joshi et al., Reference Joshi, Devkota, Harris, Khanal, Paudyal, Sapkota and Witcombe2012).
The old age of varieties grown in the developing world appears to be a widespread phenomenon as it has always been found in the small number of studies on this topic (for India, Krishna et al. (Reference Krishna, Spielman and Veettil2016) and Witcombe et al. (Reference Witcombe, Packwood, Virk, Witcombe, Virk and Farrington1998); for Bangladesh, Bagachi et al. (Reference Bagachi, Bardhan Roy, Jaim, Hossain, Hossain, Jaim, Paris and Hardy2012), Hossain and Jaim (Reference Hossain, Jaim, Hossain, Jaim, Paris and Hardy2012) and Hossain et al. (Reference Hossain, Bose and Mustafi2006); for the DIIVA study, Walker et al. (Reference Walker, Alwang, Alene, Ndjuenga, Labarta, Yizgezu, Diangne, Andrade, Murthoni Andriatsitona, De Groote, Mauch, Yirga, Simotowe, Katungi, Jogo, Jaleta, Pandey, Charyulu Kumara, Walker and Alwang2015); for Nepal, Pandey et al. (Reference Pandey, Velasco, Yamano, Walker and Alwang2015) and Witcombe et al. (Reference Witcombe, Joshi, Rana and Virk2001)). It is an under-reported problem in relation to its importance in reducing yields and increasing risk of disease and pest epidemics. Furthermore, the weighted average ages underestimate the true ages of varieties that are defined by the year of their release. With few exceptions, there is a delay of several years between a variety being formally identified as a candidate for release and which are actually being released. In some cases, release takes place many years after they are first tested. For example, in Bangladesh BRRI dhan29 was released after at least 15 years of testing (Joshi et al., Reference Joshi, Khanal, Harris, Khanal, Sapkota, Khadka, Derai, Neupane, Joshi and Witcombe2014) and rice variety Hardinath-1 was released 17 years after its introduction in Nepal (Joshi et al., Reference Joshi, Devkota, Harris, Khanal, Paudyal, Sapkota and Witcombe2012) and Ghaiya-1 (IR44595) 20 years after (NARC, 2014).
Cheaper methods for gathering essential information
What varieties are grown and where they are grown is invaluable information for planning extension and for developing breeding programmes that use locally adapted parents (Witcombe et al., Reference Witcombe, Gyawali, Subedi, Virk and Joshi2013). This information can be collected by a much cheaper method that the household surveys reported here. In a series of interviews from March to April 2008 by telephone, and sometimes, personal visits key informants from 21 DADOs were interviewed on the varietal composition of rice in their district in the 2007 main season. The interviews covered all 20 Terai districts plus Makwanpur district, whereas the present study covered 17 Terai districts plus Tanahun. Despite the difference of a year and the differences in districts, there was a good agreement between the two methods. Of the ten most popular varieties in 2008 identified by the household surveys, eight of them were also in the ten most popular in 2007 identified by interviews with DADO staff. The correlation between the rice areas of the ten most popular varieties in the two methods was also significant (r2 = 0.49, p < 0.01).
CONCLUSION
No matter what region or year is considered, farmers in the Nepal Terai grow old rice varieties that cover large areas. From other studies on varietal age it can be confidently concluded that this is a general problem and that every year, throughout the developing world farmers are forgoing the substantial benefit they could get from growing more MVs. They are also cultivating a crop made more vulnerable by low varietal diversity. In the second paper in this series, we examine how IRD can increase the speed of adoption as illustrated by the example of the rapid adoption of Hardinath-1 above, and how IRD can be adapted to account for the highly complex patterns of rice adoption revealed by this study.
Acknowledgements
This paper is an output from projects funded by the Plant Sciences Research Programme and the Research into Use Programme of the UK Department for International Development (DFID) for the benefit of developing countries. The views expressed are not necessarily those of the DFID. The authors would like to thank all the farmers’ groups in Nepal for their essential role in this research. Many staff from LI-BIRD, FORWARD and SUPPORT Foundation greatly contributed to this research.
SUPPLEMENTARY MATERIAL
For supplementary material for this article, please visit http://dx.doi.org/10.1017/S0014479716000545.