I. INTRODUCTION
In recent years, much attention has been focused on the research of high entropy alloys (HEAs) because of their potential properties such as high hardness, excellent ductility, and promising corrosion resistances, electrical and extraordinary mechanical properties. Reference Kao, Lee, Chen and Chang1–Reference Ye, Ma, Liu, Li, Zhong, Liu and Wu5 Above all, FeCoNiCrAl, as a traditional HEAs system, have been investigated widely. Besides the above-mentioned properties, the magnetic properties of FeCoNiCrAl HEAs have been one of the hot research topics. Reference Zuo, Yang, Liaw and Zhang6–Reference Lucas, Belyea, Bauer, Bryant, Michel, Turgut, Leontsev, Horwath, Semiatin, McHenry and Miller8 For instance, Chen investigated the magnetic property of Fe0.6CoNiCrAl HEA with saturation magnetization (M s) of 50.70 emu/g and coercivity (H c) of 31.3 Oe, respectively. Reference Chen, Zhou, Jiang, Lu and Li9 Lu prepared the FeCoNiCrAl HEA and showed that its M s was 59 emu/g and H c was 36.6 Oe. Reference Dong, Zhou, Lu, Gao, Wang and Li10 It is well known that electromagnetic (EM) wave absorbers can effectively absorb EM waves by either dissipating EM wave loss or converting EM energy into thermal energy. Reference Zhang, Tian, Wang, Luo, Hu, Shen and Xie11–Reference Zhao, Shao, Fan, Zhao, Xie and Zhang16 Magnetic metallic powder materials, acting as one of EM wave absorption materials and combining both dielectric loss and magnetic loss, have shown a clear advantage in balancing the complex relative permittivity and permeability. Reference Wu, Han, Liu and Deng17–Reference Zhao, Shao, Fan, Zhao and Zhang21 FeCoNiCrAl HEAs with outstanding magnetic properties can be used as EM wave absorbing materials. However, as far as we know, few researches have been reported about the electromagnetic wave absorption properties of FeCoNiCrAl HEAs powders.
HEAs powders are often prepared by mechanical alloying with enough time or atomization method with gas or liquid. Reference Kunce, Polanski, Karczewski, Plocinski and Kurzydlowski22–Reference Fang, Chen and Fu24 In particular, mechanical alloying, which is of utmost interest in the last decades, allows one to produce large quantities of alloying material easily and economically, and even to prepare materials with crystalline to amorphous structure in a relatively simple way. Reference Wang, Zheng, Xu and Wang7,Reference Chen, Niu, Wei, Hao, Liu, Wang and Peng25 Fracturing and cold welding during repeated severe mechanical treatment bring particles to mutual contact with a minimal diffusion distance, leading to obtain an alloy with required composition. Reference Kuhrt and Schultz26–Reference Gheisari and Javadpour28 Therefore, mechanical alloying method is mainly used to prepare HEAs powders. At the same time, the amorphous structure of corresponding chemical composition is synthesized with the extension of milling time. Reference Chen, Niu, Wei, Hao, Liu, Wang and Peng25
In this paper, FeCoNiCrAl0.8 HEA and amorphous alloy powders were prepared by high energy ball milling under different milling time. The thermal stability and magnetic properties of FeCoNiCrAl0.8 HEA and amorphous alloy powders were investigated. We mainly focus on the EM wave absorption properties of FeCoNiCrAl0.8 HEA powders in comparison with amorphous alloy powders of corresponding at the same chemical composition.
II. EXPERIMENTAL PROCEDURE
HEA and amorphous alloy powders with a nominal composition of FeCoNiCrAl0.8 (expressed in molar ratio) were prepared by wet milling for 10 and 20 h respectively in methylbenzene as a process control agent to avoid oxidation. Fe, Co, Ni, Cr, and Al elemental powders with purity higher than 99.5 wt% and particle size of 1–8 µm were mechanical alloying. The MA was carried out in a high energy ball mill machine (Spex8000D, SPEX Sample Prep, Metuchen, New Jersey) at a speed of 800 rpm with a ball to powder weight ratio of 10:1 and initial powder of 2 g. Cemented carbide steel vials and balls (10 and 5 mm in diameter) were used as the milling media. To confirm the alloy formation during milling, powders were taken out after milling for 10 and 20 h.
The crystal structure of as-prepared samples was analyzed by x-ray diffraction (XRD; Rigaku Ultima-III X-ray diffractometer, Rigaku Corporation, Tokyo, Japan) using Cu Kα radiation at a scan step of 0.2. The morphology and composition of the samples were observed by scanning electron microscopy (SEM; JEOL JEM-2100, JEOL Ltd., Tokyo, Japan) equipped with energy-dispersive spectrometry (EDS). Differential scanning calorimetric analysis (DSC; Mettler-Toledo TGA/DSC-1, Gießen, Germany) was carried out in an N2 flow rate. The samples were heated to 800 °C at a rate of 20 °C/min. The magnetic properties were performed by vibration sample magnetometer. EM wave absorption properties of FeCoNiCrAl0.8 HEA and amorphous alloy powders were investigated through a vector network analyzer (VNA; Agilent E5071C, Agilent Technologies, Santa Clara, California) in the frequency range of 2–18 GHz. The specimens applied for EM measurements were prepared by homogeneously blending the samples with paraffin wax (the weight ratio of the FeCoNiCrAl0.8 HEA powders and amorphous alloy powders was around 70%), and then the mixture was pressed into a ring shape (outer diameter of 7 mm and inner diameter of 3.04 mm). The relative complex permittivity (εr = ε′ − jε″) and permeability (µr = µ′ − jµ″) were obtained by the experimental scattering parameters S11, S12, S21, and S22 through the standard Nicolson–Ross theoretical calculations.
III. RESULTS AND DISCUSSION
A. Structure and phase characterization
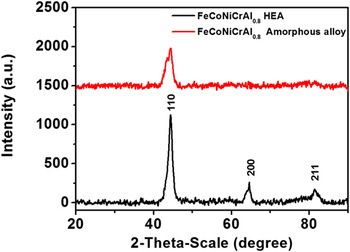
The XRD patterns of the FeCoNiCrAl0.8 HEA and amorphous alloy powders, which are ball milled for 10 and 20 h, are shown in Fig. 1. It can be seen that the FeCoNiCrAl0.8 HEA powders is formed when the milling time is 10 h, because three most intensive peaks as indicated by the sharp Bragg-peaks corresponding to body-centered cubic (BCC) structure that the lattice plane of (110), (200), and (211) can be identified. Such phenomenon deduced the formation of a simple solid solution (FeCoNiCrAl0.8 HEA). Apparently, all of other elements appear to be dissolving into Fe or Cr peaks. It is possibly explained that Fe and Cr possess BCC crystal structure, thus they may accommodate other elements without much expansion. This can be attributed to the nonequilibrium state of mechanical alloying and the effect of high mixing entropy. Reference Chen, Niu, Wei, Hao, Liu, Wang and Peng25,Reference Dong, Lu, Jiang, Wang and Li29 The FeCoNiCrAl0.8 amorphous alloy powders are formed as the milling time extending to 20 h, and most of the diffraction peaks disappear and a main phase peak can be distinguished. It is clearly observed that the peaks become slightly broaden and its intensity decrease, suggesting a more disordered crystal structure formed. Because the grain size decreases with increase of milling time, the structure ordering is reduced according to the high entropy.
XRD patterns of FeCoNiCrAl0.8 HEA and amorphous alloy powders.

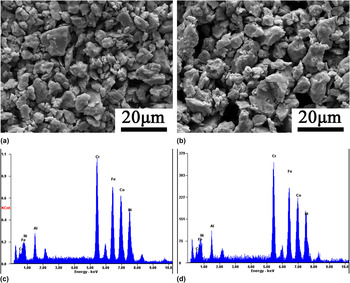
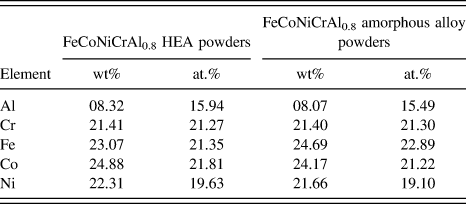
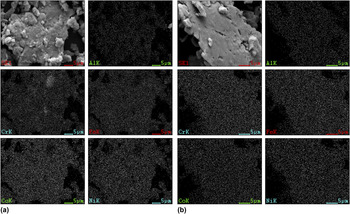
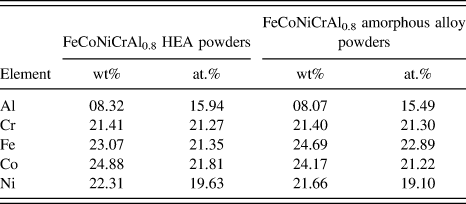
The morphology of the prepared FeCoNiCrAl0.8 HEA and amorphous alloy powders is examined as shown in Fig. 2. The ball milling process contains intensive fracture and cold welding. The powders are apt to be cold welded together to form new particles. After milling for 10 h, the alloying powders are aggregated into irregular shape particles, as shown in Fig. 2(a). It can be known that the particles are high entropy alloy powders from XRD results in Fig. 1. The shape of the particles is fairly unchanged as the milling time is increasing to 20 h [as shown in Fig. 2(b)] which forms the amorphous alloy powders. A representative result from EDS spectrum is shown in Figs. 2(c) and 2(d) and Table I. In the mixture of raw materials, the nominal composition of Fe, Co, Ni, and Cr is all 20.83% and that of Al is 16.68%. According to the EDS spectrum and chemical composition, the atomic ratio of Fe:Co:Ni:Cr:Al is nearly 1:1:1:1:0.8, indicating a little element loss for samples after the milling process. To further confirm the uniformity in the distribution of five component elements, compositional mapping of individual particles is conducted. Figure 3 also exhibits the elemental mappings of Fe, Co, Ni, Cr, and Al for a particle of HEA and amorphous alloy powders, respectively. It is clearly illustrated that all the five component elements are distributed uniformly within the particle and there is no compositional segregation in both samples. The result of EDS reveals good chemical homogeneity in the as-milled powders. It is further illustrated that the FeCoNiCrAl0.8 HEA and amorphous alloy powders are synthesized successfully.
SEM and EDS images of (a), (c) FeCoNiCrAl0.8 HEA powders and (b), (d) FeCoNiCrAl0.8 amorphous alloy powders.

Chemical composition in at.% for FeCoNiCrAl0.8 HEA and amorphous alloy powders.
Representative compositional mapping result obtained from (a) FeCoNiCrAl0.8 HEA powders and (b) FeCoNiCrAl0.8 amorphous alloy powders.

B. Thermal stability and magnetic properties
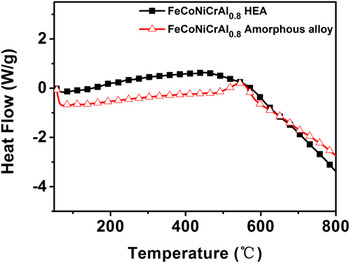
To apply the electromagnetic wave absorbing materials in harsh conditions (such as high temperature), the thermal stability should be considered. Reference Zhao, Fan, Shao, Zhao and Zhang19 TG and DSC analysis of FeCoNiCrAl0.8 HEA and amorphous alloy powders is shown in Fig. 4. It can be observed that for FeCoNiCrAl0.8 HEA powders, there are not exothermic peak in the temperature range of 50–800 °C, which indicates the relative high thermal stability of the FeCoNiCrAl0.8 HEA powders. For FeCoNiCrAl0.8 amorphous alloy powders, it contains an exothermic peak at 545 °C with DSC values of 0.2 W/g, corresponding to the crystallization of amorphous structure. Reference Wang, Zheng, Xu and Wang7 Therefore, both the thermal stabilities of FeCoNiCrAl0.8 HEA and amorphous alloy powders are excellent as the EM wave absorber and the thermal ability of FeCoNiCrAl0.8 HEA powders is superior to that of FeCoNiCrAl0.8 amorphous alloy powders.
DSC curves of FeCoNiCrAl0.8 HEA powders and FeCoNiCrAl0.8 amorphous alloy powders.

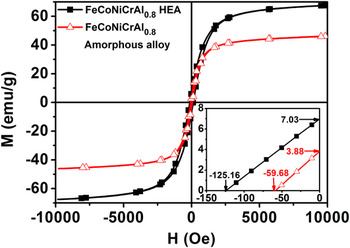
The magnetic hysteresis loops of the FeCoNiCrAl0.8 HEA and amorphous alloy powders are characterized at room temperature, as shown in Fig. 5. It can be clearly observed that the corresponding maximum saturation magnetization (M s) of HEA and amorphous alloy powders decrease from 67.52 to 46.11 emu/g and the coercivity decreases (H c) from 125.16 to 59.68 Oe. The remanent magnetization (M r) also decreases from 7.03 to 3.88 emu/g. The behavior of these two alloys is a result of the different saturation magnetization for different magnetic coupling between crystalline grains and the amorphous matrix. The strong magnetic coupling suppresses the magnetic anisotropy of HEA, contributing to the improvement of the M s. Meanwhile, for the crystalline structure it provides a geometric basis for a reasonable orientation arrangement of the magnetic moment. However, the orientational magnetic moment is destroyed because of the disordered atomic arrangement when the amorphous phase form, which also leads to a reduction of M s. In addition, the low coercive force can be found for the smallest structural correlation lengths like amorphous alloys of no grain boundaries and dislocation. At the same time, the grain boundaries could greatly hinder the shift of domain-walls. Reference Wang, Zheng, Xu and Wang7,Reference Kuhrt and Schultz26 Thus a high H c value of HEA is achieved compared to that of amorphous alloy. For the above results it suggests that the magnetic properties of FeCoNiCrAl0.8 HEA powders with solid solution phase are much better than FeCoNiCrAl0.8 powders with amorphous phase.
Hysteresis loops of FeCoNiCrAl0.8 HEA and amorphous alloy powders.

C. Electromagnetic properties
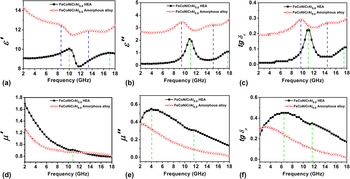
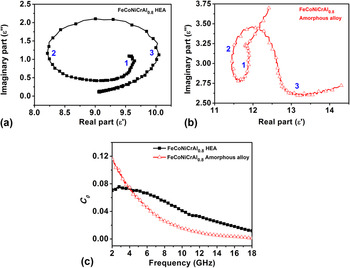
It is well known that EM wave properties of materials are mainly associated with the complex permittivity (εr = ε′ − jε″) and permeability (µr = µ′ − jµ″). Reference Zhao, Shao, Fan, Xie and Zhang30–Reference Zhao, Shao, Fan, Zhao and Zhang32 Figure 6 shows the complex permittivity and permeability of paraffin-based composites containing 70 wt% FeCoNiCrAl0.8 HEA and amorphous alloy powders in the frequency range of 2–18 GHz. In Figs. 6(a) and 6(b), it shows the real part of the complex permittivity (ε′) and imaginary part (ε″) of the two samples. Notably, the ε′ and ε″ of FeCoNiCrAl0.8 HEA powders is lower than those of FeCoNiCrAl0.8 amorphous alloy powders. The ε′ value decreases from 14.38 to 12.4 for the FeCoNiCrAl0.8 amorphous alloy powders in the range of 2–18 GHz with fluctuation and increases from 9.02 to 9.45. The ε″ value increases from 2.7 to 3.7 and 0.1 to 1.1 respectively for both samples. Generally, the ε′ and ε″ values are associated with dissipation of the EM energy and polarization existing in the material under the alternating electromagnetic fields. The relative high ε′ and ε″ values of FeCoNiCrAl0.8 amorphous alloy powders suggest the high storage and loss ability of the microwave energy. The dielectric loss tangent (tan δe = ε″/ε′) for FeCoNiCrAl0.8 HEA and amorphous alloy powders are shown in Fig. 6(c). The tan δe of amorphous alloy powders is also higher than that of HEA powders and two tan δe peaks are exhibited for both HEA and amorphous alloy powders which indicate the dielectric loss mechanism. It is well known that the polarization and its associated relaxation will increase the EM wave absorption, which can be evaluated by the Cole–Cole semicircle and each semicircle is correlated with one Debye relaxation process. Reference Zhao, Shao, Fan, Xie and Zhang30,Reference Xia, Zhang, Oyler and Chen33–Reference Zhao, Shao, Fan, Zhao and Zhang35 In Figs. 7(a) and 7(b), we show the Cole–Cole semicircles (ε″ versus ε′) for FeCoNiCrAl0.8 HEA and amorphous alloy powders in the frequency range of 2–18 GHz. Three Cole–Cole semicircles are observed for both samples, and for above results it demonstrates that multiple dielectric relaxation processes take place in the FeCoNiCrAl0.8 HEA and amorphous alloy. The dielectric properties of the material are dependent on the polarization effect of materials. Reference Wen, Liu, Zhao, Cheng and Li36 First, the powders dispersed in paraffin can provide space polarization occurs at the interface between the FeCoNiCrAl0.8 alloy powders and paraffin. Second, FeCoNiCrAl0.8 powders exist plentiful interfaces between the elements of Fe, Co, Ni, Cr, and Al which give rise to interfacial polarization to increase the dielectric loss. Third, as the milling time increases from 10 h (HEA alloy powders) to 20 h (amorphous alloy powders), the amount of defects produced during milling process for FeCoNiCrAl0.8 amorphous alloy powders is larger than that of FeCoNiCrAl0.8 HEA powders. Reference Koundinya, Babu, Sivaprasad, Susila, Babu and Baburao37 These defects can function as polarized centers; therefore, the dipoles need more and more energy to alternate the direction due to the damaged structure. Such a process may increase the attenuation electromagnetic ability leading to an additional dielectric loss in different frequency ranges.
Electromagnetic parameters of FeCoNiCrAl0.8 HEA and amorphous alloy powders in the frequency range of 2–18 GHz: (a) real part of the permittivity; (b) imaginary part of the permittivity; (c) dielectric loss; (d) real part of the permeability; (e) imaginary part of the permeability; (f) magnetic loss.

(a–b) Typical Cole–Cole semicircles and (c) Value C 0 for FeCoNiCrAl0.8 HEA and amorphous alloy powders in the frequency range of 2–18 GHz.

The real (µ′) and imaginary (µ″) parts of the complex permeability for FeCoNiCrAl0.8 HEA and amorphous alloy powders are shown in Figs. 6(d) and 6(e). It can be seen that for both samples there are decline tendency in the whole measured frequency of 2–18 GHz for the real parts (µ′) and imaginary part (µ″). The µ′ values of FeCoNiCrAl0.8 HEA powders are higher than that of amorphous alloy powders which are in the range of 0.8–1.7 and 0.8–1.3, while the µ″ values are in the range of 0.13–0.55 and 0.02–0.38 respectively. For the HEA sample, a resonance peak of µ′ is observed at 11 GHz, and the µ″ values exhibit a broad peak at around 4 GHz and a slight resonance peak at 12 GHz. Figure 6(f) is the magnetic loss tangent (tan δµ = µ″/µ′) for FeCoNiCrAl0.8 HEA and amorphous alloy powders and the tan δµ value of HEA is higher than that of amorphous alloy. There are two resonance peaks at 6.5 and 11.6 GHz for FeCoNiCrAl0.8 HEA powders. It stems from the magnetic loss in the frequency range. In general, the magnetic loss of the magnetic materials is mainly generated from magnetic hysteresis loss, domain wall resonance, eddy current effect, and natural resonance. The magnetic hysteresis loss can be neglected due to the weak electromagnetic field and domain wall movement occurs in the low frequency (<2 GHz). Reference Wen, Liu, Zhao, Cheng and Li36 Therefore, the magnetic loss of the samples is primarily attributed to the eddy current effect and natural resonance. If the reflection loss results from the eddy current loss effect, the values of C 0 [C 0 = µ″(µ′)−2 (f)−1 = 2πµ0σd 2/3] should be constant when the frequency is changing. Reference Zhu, Sun, Xue, Guo, Fan, Pan and He38–Reference Guo, Wang and Wu40 The curve of C 0 versus measured frequency of FeCoNiCrAl0.8 HEA and amorphous alloy powders is displayed in Fig. 7(c). However, the values of C 0 decrease with increasing frequency for both samples. Thus the magnetic loss of the as-obtained particles can be ascribed to natural resonance.
According to the transmission line theory, the RL of absorbers can be calculated from the measured relative complex permittivity and permeability values by the following equations Reference Wang, Han, Zhang, Hu, Zhang, Wang, Du, Wang and Xu41–Reference Zhao, Shao, Fan, Zhao, Chen and Zhang44 :
 $$RL({\rm{dB}}) = - 20\;\log \left| {{{{Z_{{\rm{in}}}} - {Z_0}} \over {{Z_{{\rm{in}}}} + {Z_0}}}} \right|\quad ,$$
 $${{{Z_{{\rm{in}}}}} \over {{Z_0}}} = \sqrt {{{{\mu _{\rm{r}}}} \over {{\varepsilon _{\rm{r}}}}}} \;\tan \!{\rm{h}}\left( {j{{2\pi fd} \over c}\sqrt {{\mu _r}{\varepsilon _r}} } \right)\quad ,$$
where Z in is the input impedance of the absorber, Z 0 is the characteristic impedance of free space, µr and εr are relative complex permeability and permittivity of the absorber, respectively, c is the speed of light, f is the frequency of microwave and d is the thickness of the absorber. The reflection loss was calculated using Eqs. (1) and (2) for different absorber thickness to analyze the change of microwave absorption properties with thickness of the absorber.
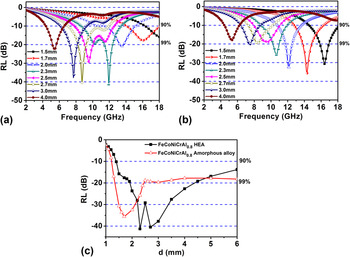
To further investigate the EM wave absorption properties of the paraffin-based samples, the RL values of the two samples were calculated as shown in Fig. 8. For FeCoNiCrAl0.8 HEA powders, it can be clearly seen that a minimum reflection loss of −41.8 dB at 11.9 GHz is exhibited corresponding to a thickness of 2.3 mm and the effective bandwidth of RL values below −10 dB (90% of microwave absorption) is 4.7 GHz (8.7–13.4 GHz) at this thickness [Fig. 8(a)]. While the minimum reflection loss of FeCoNiCrAl0.8 amorphous alloy powders is −35.5 dB at 14.6 GHz and the effective bandwidth (RL ≤ −10 dB) is 3.6 (12.7–16.3 GHz) for 1.7 mm thickness [Fig. 8(b)]. In Fig. 8(c), we show the minimum RL at different thickness in the range of 2–18 GHz for both FeCoNiCrAl0.8 HEA and amorphous alloy powders. It can be seen that the EM wave absorption below −10 dB can be achieved as long as the thickness is in the range of 1.4–6 mm for HEA powders and 1.2–6 mm for amorphous alloy powders. Moreover, an absorption exceeding −20 dB is obtained for the thickness of 2–4.4 mm of HEA powders and 1.4–2.5 mm of amorphous alloy powders. It is indicated that the EM wave absorption properties of FeCoNiCrAl0.8 HEA powders is superior to that of FeCoNiCrAl0.8 amorphous alloy powders.
Reflection loss of the FeCoNiCrAl0.8 powders in the frequency range of 2–18 GHz. (a) FeCoNiCrAl0.8 HEA powders; (b) FeCoNiCrAl0.8 amorphous alloy powders and (c) RLmin for FeCoNiCrAl0.8 HEA and amorphous alloy powders at different absorber thicknesses.

This phenomenon is ascribed to the combination of following factors. One factor is the impedance match between the material and free space, which makes the EM wave enter the interior of the absorber as much as possible. This requires the input impedance Z in equals Z 0 (377 Ω). Another factor is that the anisotropy energy which plays an important role in increasing the EM wave absorption. It is worth noting that the high-frequency resonance is also related to H c value based on the following equations Reference Wang, Wang, Gan and Lu18,Reference Lv, Liang, Ji, Zhang and Du45,Reference Liu, Cao, Zhao, Bi, Wang, Wu and Che46 :
 $${K_1} = {\mu _0}{M_{\rm{s}}}{H_{\rm{c}}}/2\quad ,$$
 $${H_{\rm{a}}} = 4\left| {{K_1}} \right|/3{\mu _0}{M_{\rm{s}}}\quad ,$$
 $${f_{\rm{r}}} = \gamma {H_{\rm{a}}}/2\pi \quad ,$$
where µ0 stands for the universal value of permeability in free space, γ is the gyromagnetic ratio, f r is the resonance frequency, K 1 is the anisotropic coefficient, and H a is the anisotropy energy. From the equations, the M s and H c will affect the EM wave absorption properties. The M s and H c of FeCoNiCrAl0.8 HEA powders are higher than those of amorphous alloy powders, and the crystal is anisotropic while amorphous is isotropic. Thus the EM wave absorption properties of FeCoNiCrAl0.8 HEA powders are much better than that of FeCoNiCrAl0.8 amorphous alloy powders.
IV. CONCLUSION
FeCoNiCrAl0.8 HEA and amorphous alloy powders were prepared using high-energy ball milling with various milling time of 10 and 20 h. From VSM results of FeCoNiCrAl0.8 HEA powders, we showed that it had higher M s (67.52 emu/g) and H c (125.16 Oe) compared with those of amorphous alloys powders (M s = 46.11 emu/g and H c = 59.68 Oe). The permittivity and permeability behaviors of the powders uniformly dispersed in paraffin matrix were investigated as a frequency range of 2–18 GHz. The FeCoNiCrAl0.8 HEA powders exhibits outstanding EM wave absorption properties compared with FeCoNiCrAl0.8 amorphous alloy powders. The maximum reflection loss of HEA powders reaches −41.8 dB at 11.9 GHz with a matching layer thickness of 2.3 mm and the absorption bandwidth less than −10 dB is 4.7 GHz (8.7–13.4 GHz). At the same time, the maximum reflection loss of amorphous alloy powders was up to −35.5 dB at 14.6 GHz and the effective bandwidth (RL ≤ −10 dB) is 3.6 (12.7–16.3 GHz) at 1.7 mm. The results indicate that the EM wave absorption properties of FeCoNiCrAl0.8 HEA powders are superior to that of FeCoNiCrAl0.8 amorphous alloy powders.