A potentially debilitating feature of voting systems is that collective decision making by majority rule can cycle. With three or more choice options, each could be preferred by a majority to one of the others, and thus no alternative represents the voters’ predominant majority preference.
Is concern over majority cycles warranted? Answers vary depending on the number of voters, the number of options, the similarity of voters’ political outlooks and the rules of the decision process. National elections present conditions that cut both ways, some making cycles more likely and others making them less likely. As elections are the keystone of contemporary democracies, knowing how likely they are to produce a majority cycle provides important information about voting outcomes and representation.
Our purpose is to investigate the probability and plausibility of majority cycling in national elections involving three major parties. National elections present empirical challenges because full information regarding preference profiles for all of the voters is not generally available, which makes predictions regarding whether a given election was prone to cycling subject to debate. To address this concern, we devise a means of computing the probability of cycles from the number of first-place votes for each candidate in a three-candidate election.Footnote 1 Our calculation uses the realistic condition that each alternative is the first-place preference of at least one voter. We find that the probability of cycling, while not large, is not remote. Generalizing, when the vote percentages split more evenly than 45-45-10, majority cycles can be expected in about one in six outcomes. When plausibility considerations are brought to bear, the realistic chances of cycling are reduced but not eliminated. We conclude that majority cycling does hamper representation in three-party elections, though only occasionally.
Probability Of Cycling Over Three Alternatives
Concern over cyclic election outcomes has a long literature, starting with the eighteenth-century work of Marquis de Condorcet and continuing with Duncan Black, Kenneth Arrow, Amartya Sen, Peter Fishburn and many others.Footnote 2 The branch of the literature on the likelihood of cycles that followed arrived at a variety of conclusions depending on the emphasis given to various conditions. Majority cycles are almost certain where there are many voters with strict preferences over a large number of options.Footnote 3 More recently, however, Bradford Jones and his colleagues have found that cycles are unlikely when a large number of voters are indifferent to many of the options.Footnote 4 Earlier, Gordon Tullock had gone further and argued that, even when and where preferences are mostly strict, cycles ‘will seldom be of much importance’ because societal processes create agreement in political outlooks.Footnote 5 Bernard Grofman observes that in highly institutionalized settings ‘hunting for the [cycling] paradox is much like hunting for the Loch Ness monster: appearances are few and far between, and some of the sightings are suspect’.Footnote 6 That is, institutional arrangements can inhibit cycles, as when an agenda is restricted to a small number of options, and often prohibit cycles being made visible, as when no provision for a second and third round of voting has been made.
National elections with three-party systems present a set of conditions that fall between the cracks. They involve a large number of voters with, presumably, mostly strict preferences over the small number of parties. The large number of voters with strict preferences makes cycles more likely; the small number of options makes them less likely. While social processes will certainly have created similarities in political outlooks within a national context, usually there is enough disagreement for no single alternative to be preferred by a majority in the first round. The similarities make cycles less likely; disagreement makes them more likely. Also, while no country’s electoral rules call for a follow-up series of paired comparisons, an important aspect of the issue is not so much a matter of seeing an election outcomes cycle but of evaluating whether there is reason to think they would have cycled.
A twenty-first century work tends to redirect the focus to the uncovered set,Footnote 7 which constitutes a way to handle cycles and other behaviour permitted by Richard McKelvey’s chaos theorem in the 1970s.Footnote 8 The other extreme has been reflected in the claims of Michel Regenwetter and his colleagues.Footnote 9 They show theoretically and empirically that, when the choice set is restricted to a small number of options and when one abandons what they take to be the utterly implausible idea of an ‘impartial culture’, the realistic likelihood of encountering cyclic outcomes is de minimis.Footnote 10
We approach the issue in the spirit of Regenwetter and his colleagues. We restrict our attention to a small number of options – three parties. Also, rather than founding our analysis on the assumption of a completely impartial culture, we take the revealed information about the distribution of first-place preferences as our starting point. From there we pursue conclusions along two paths. What is the probability of cycles given the preferences voters expressly revealed? How plausible is it to think that the non-zero probability of cycles actually exists?
Our more general approach identifies voter choices along with all possible supporting profiles for specified plurality tallies. We then compute the portion that allows cycles. The payoffs are twofold. On a theoretical level, we devise a method for calculating the probability of cycles with some, but less than complete, information about the full-scale preference ordering of voters. On an empirical level, the theoretical calculation reveals how much uncertainty possibly exists, given three-party election results, and, in turn, discounts that uncertainty by means of plausible side-information about the partiality of the culture in which a non-zero probability exists. In other words, there is a difference between what one finds and says about the probability of cycles armed with survey data on full preference orderings, as in Regenwetter et al., and what one might say about the probability and plausibility of cycles after being presented with the information that democracy itself presents through the first-preference vote tallies.
Preliminaries
After the potential for majority cycles was rediscovered by BlackFootnote 11 and reformulated and generalized by Arrow,Footnote 12 important analyses began to explore how probable they might be.Footnote 13 Calculating a precise probability has proved formidably difficult in situations involving more than a few dozen alternatives and voters. Indeed, half a century after Black’s first attempt in 1958,Footnote 14 the calculation remained approachable only through Monte Carlo simulations and even then for electorates with only about 100,000 voters.Footnote 15
We, like others, cannot surmount the counting problem; instead, we enter through its flip side. Our formulation takes as given the distribution of first-place votes for three alternatives and asks, for any and every voter distribution, what is the probability of a cycle if voting were to be done in a series of paired comparisons.
Assuming the admissibility of all preference profiles over three alternatives – A, B and C – a voter might have one of six possible orderings: ABC, ACB, BAC, BCA, CBA or CAB. If each profile is equally likely, this case produces a 0.056 probability of cycling;Footnote 16 there are 12 cycling possibilities among 216 (63) total possibilities. With strict preferences over alternatives, the probability increases as either the number of options or the number of voters increases, with higher increases arising from more options and slower increases resulting from a growing number of voters.Footnote 17
The questionable assumption here involves equally likely voter preference profiles, as if by random draw from an impartial culture.Footnote 18 Voters in a society can have shared experiences and outlooks that encourage similarities, and this would reduce the dimensionality of the issue space and therefore the probability of cycles. This reflection suggests that there is not much need to worry about cycles.Footnote 19
However, assuming equi-probable orderings, only 48 of the 216 possibilities with three voters and three alternatives involve a situation where each alternative is the first-place preference of voters. Here, all 12 cycling possibilities exist only when one voter prefers A, another prefers B and the third prefers C. Therefore, including the proposition that an option is included only if someone prefers it, the probability of a cycle is 0.25 (12 possible cycles of 48 total possibilities). The probability is not always 0.25 with three options each preferred by at least one voter. That depends on the evenness of the distribution of first-place preferences. The 0.25 probability obtains when a third of the voters each prefer A, B and C; it is 0.0 when one more than half the voters prefer any one option; and in between when first-place preferences split, say, 40–40–20.
A Mathematical Solution
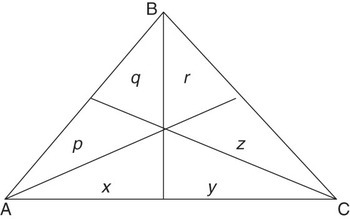
To calculate the probability of cycling for three options and n voters when at least one voter most prefers A, another most prefers B and another most prefers C, we use a variation of Donald Saari’s geometric depiction of the issue in the form of a representational triangle shown in Figure 1.Footnote 20 The three alternatives are represented at the three vertices of the triangle. Voters are located in the interior of the triangular space within one of six ranking regions defined by three bisecting lines of indifference. All voters are assumed to have strict preferences; no voter resides on a line of indifference. A voter’s regional location defines his or her ranking of alternatives.
Representational triangle depicting the preference profiles of six possible groupings of voters over three alternatives

Voters in p rank three alternatives with A > B > C
Voters in x rank three alternatives with A > C > B
Voters in q rank three alternatives with B > A > C
Voters in r rank three alternatives with B > C > A
Voters in z rank three alternatives with C > B > A
Voters in y rank three alternatives with C > A > B,
where ‘A > B’ means ‘A preferred to B’.
A cycle can exist if A > B > C > A, or the opposite. Thus, a cycle exists if:
p + x + y > q + r + z (A > B) and
p + q + r > z + y + x (B > C) and
r + z + y > q + p + x (C > A).
or the opposite.
Let the number of people who hold an alternative K as a first place preference be represented by N(K), so N(A) is the number of people who have A in first place. Drawing from the above, N(A) = x + p and N(B) = r + q and N(C) = y + z. When evaluating paired comparisons between two alternatives, the inequalities in the box hold.

By substitution, reading down, we rewrite the cycle in terms of first-place preferences as shown in Table 1.
Forward Cycle Calculations

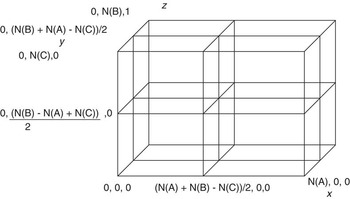
Figure 2 represents the three dimensions as a cube with length, depth and height representing first-place preferences for A, B and C. Each axis on the cube represents the division among second-place choices for any of the alternatives. For example, the length axis shows the division among those voters who place A in first place between ACB voters, x, and ABC voters, p. As the fraction of the x voters goes to zero, we approach the left of the axis. The vertical axis represents the division of N(C), or voters with C in first place, CBA voters (on the bottom) and CAB voters (on top). Likewise, the horizontal axis represents the division of B voters between BAC voters (front) and BCA (back). By depicting the voter profiles in this manner, we can grasp how different combinations of voter profiles can produce cycles. For any given set of preferences, we can identify areas (volumes) in which forward cycles can occur and those in which backward cycles can occur.
Total volume of outcomes among three alternatives Note: Sub-areas where cycling could occur include the upper-left back cube and the lower-right front cube.

The cyclic regions are based on the above calculations. The values for x, y and z determine regions in which either cycle can exist. The forward cycle (A > B > C > A) is in the lower-right front section of the box and the backward cycle (A < B < C < A) in the upper-left back section. The cyclic volume is found by multiplying the three dimensions (length, width and height) of each region.Footnote 21 These regions give information about the volume of possibilities in which cycles could occur.


Summing these two quantities yields the occurrence of all cycles, forward plus backward.Footnote 22

The probability of cycles depends on the fraction of the total three dimensional space occupied by the cycling volumes. The total volume is calculated as:

Note, N(A), N(B) and N(C) must each be non-zero for there to exist any possibility of a cycle.
Combining these, we can compute the overall likelihood of cycle.

from

Theoretical Possibilities
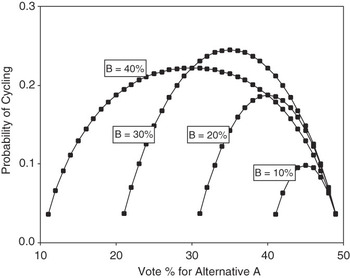
A cycle cannot exist when any alternative receives over 50 per cent of the vote on the first ballot. Moreover, with our analysis limited to three alternatives, the total vote percentage for any one of them is defined once we know the votes of the other two. Thus, we can calculate the probability of cycling across the vote percentages in the range from 0%+1 to 50% − 1 for any two alternatives as long as the sum of their percentages is greater than 50. We have done this for alternative A’s vote percentage in the range of 1 to 49 and alternative B’s vote percentage set at 10, 20, 30 and 40 (A + B not <50). The results are displayed in Figure 3.
Probabilities of cycling among three alternatives when two of them each receive 10 to 50 per cent (minus 1) of the first-place votes

Never does the probability of a cycle exceed 0.25, which, as we have remarked, occurs when first-place preferences for each alternative split 1/3, 1/3 and 1/3. This maximum probability is reached when votes split evenly because given six equally likely profiles at least two-thirds of them must satisfy Black’s single-peakedness condition and, with that, never more than a quarter of the possible combinations produces a cycle.Footnote 23 When any two alternatives each receive above 45 per cent of the vote, the probability of cycling never reaches 0.1. When all three alternatives received less that 45 per cent of the vote, however, the probability of a cycle is in the range of 0.10 to 0.25.
Briefly, cycling over three alternatives (a) has no chance of occurring when one alternative is preferred by a majority, (b) has less than a 0.10 chance of occurring when the sum of first-place votes for two alternatives receives 90 per cent or more, and (c) has a probability between 0.10 and 0.25 when all three alternatives have the first-place support of less than 45 per cent of voters. These are not non-existent probabilities unless one alternative is the first-place preference of a majority.
Arguably, the preceding analyses could be considered abstract. What would happen, one might ask, if we infuse our calculations with the realism that voters encounter alternatives A, B and C in the form of political parties whose labels are better written as L, C and R – for Left, Centre and Right. How far from reasonably probable cycles does the Left–Right dimensional understanding – or any plausible partiality of the political culture – carry the analysis? The answer, as we show below, is a considerable distance, often but not always pushing outcomes to remote boundaries of plausibility.
Application To A Three-Party System
Probability
Britain’s Labour and Conservative parties consistently contested elections during the post-war period, 1945–2005. We treat the three formations of British Liberals – namely, Liberals (1945–79), Liberal-Social Democratic Alliance (1983 and 1987), and Liberal Democrats (1992–2005) – as the third-party alternative in any one of the seventeen respective elections. Together, the three parties averaged over 95 per cent of the total valid vote, and none received less than 2.5 per cent in any one election.Footnote 24 For the following exercise, we focus on the parties’ votes by treating Britain as if it were an exclusively three-party system. That is, we calculate a party’s vote percentage from the ratio of its votes to the sum of the three parties’ votes. We then apply our formula for calculating the probability of majority cycles to these adjusted percentages. It is important to note that the election results will not account for strategic voting. This means that the data are likely to understate the potential for cycles. We attempt to address this gap between data and theory by appealing to survey data in the next section and examining the plausibility of cycles based on political evidence and understanding.
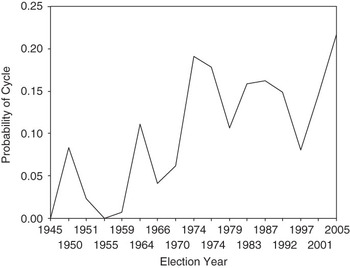
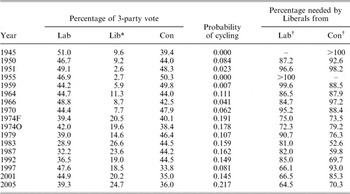
The results are shown graphically in Figure 4 (and see also Table 2 below for details). The graph reveals that elections with a cycling probability below 0.10 arises in eight of the seventeen elections and only once tops 0.20. The mean and median probabilities are 0.101 and 0.106, respectively. Interestingly, the probability took a step-jump in 1974, when the Liberals gained votes as the gulf between Labour and Conservatives grew, and the probability recorded its highest level in the 2005 election. Whether the numbers and upward tendency characterize results that are important is any reader’s choice. Cycling in these elections has been less likely than not, but for some readers, surely, it is disturbing to see that cycling has usually had a non-zero probability of occurrence and that the probability has tended to increase, if erratically so, through time.
Probability of majority cycles in British parliamentary elections, 1956–2007

UK Three Major-Party Vote Percentages, Probability of Cycling, and Percentage of Other Parties’ Votes Needed by Liberals (later Alliance and Liberal Democrats) in order to Produce a Cycle: 1945 through 2005

*Vote percentages under ‘Lib’ are for the Liberal party for 1945–79, for the Liberal and Social Democrat alliance in 1983 and 1987, and for the Liberal Democrats 1992–2005.
†These are the vote percentages Liberals (Alliance/Lib Dems) needed from one or the other major parties, but not both, for a cycle to exist. Receiving vote percentages in excess of those in both columns would make the Liberals (Alliance/Lib Dems) ‘majority preferred’. Receiving vote percentages less than those in both columns would make one of the other parties ‘majority preferred’.
Plausibility
A necessary condition for cycling is that each party wins a head-to-head competition with one but not both other parties. Satisfying this condition is difficult for the party finishing third, unless its vote percentage makes it nearly the second-place party.
Evaluating the plausibility of cycles by checking whether the third-place party could have met these conditions carries the plausibility analysis a distance. Therefore, our analysis gives attention to the vote support of the third-ranking party. Party vote percentages, calculated on the basis of just the three-party votes, are shown in Table 2.
From the mid-1940s into the 1970s, the three major British parties were not far apart on policy grounds, perhaps because the Conservative party had been willing, from the 1951 election until Margaret Thatcher became party leader, to sign on to the post-war Keynesian consensus and the development of the welfare state. By one account, the three parties were virtually indistinguishable on policy grounds in 1959; Labour stood in the centre in 1964 and 1966; and in 1970 the Liberals so cosied up to the Conservatives that the two parties appeared almost as one in policy terms.Footnote 25 This pattern of party policy positioning began to change when the Wilson-led Labour party took a decidedly leftward step in 1974.
In the eight elections before 1974 (i.e., in the period 1945–70), there is little reason to believe that cycles were likely. Labour won an outright majority (among the three parties) in 1945 and almost did so in 1951. The Conservatives won an outright majority (among the three parties) in 1955 and almost did so again in 1959. In this twenty-five-year period, a cycle was impossible twice and at other times either virtually all Conservative voters would have had to favour the Liberals over Labour or nearly all the Labour voters would have had to favour the Liberals over the Conservatives, but not both.
The February 1974 election was of a different character, and that character stayed largely in place in the October 1974 re-run. In both elections that year, arguably, cycling was plausible. Both the Conservative and the Labour voters were split on questions of Northern Ireland and joining the European Community. In addition, Wilson’s Labour party had turned noticeably leftwards. Additional testimony for the potential political flux in 1974 comes from the election results. In February, the Conservatives won a plurality of votes but finished second in seats; in October, Labour won a vote plurality.
The polarization of the two major parties in 1979, continuing through 1992, makes cycling among the three parties not very plausible in the four elections held during the period. The Thatcher–Major Conservatives won fairly large pluralities, meaning that they would have had to win only a small proportion of Liberal voters to defeat Labour and a small proportion of Labour voters to defeat the Liberals. And, were one inclined to think that could not have happened, the plausible alternative is not a cycle but the Liberal-Social Democratic Alliance or Liberal Democrats defeating both major opponents.
With Tony Blair’s arrival to Labour party leadership, New Labour moved to the middle of Britain’s political spectrum. That makes it difficult to see what could have produced a cycle in 1997 and 2001. However, the Iraq War recast New Labour for the 2005 election. In 2005, as in 1974, not only do the vote percentages make the odds of a cycle about one in five, but it is plausible to think that New Labour (plus fewer than half the Liberal voters) could have defeated the Conservatives, that Liberals (plus anti-war Conservatives) could have defeated New Labour, but that Conservatives (with pro-war New Labour voters) could have defeated Liberals. Of course, in 2005, as in 1974, for a cycle to occur, sufficient numbers of New Labour and Conservative voters would have had to forgo putting weight on the thought that the Liberals had not had government experience since the First World War.
Overall, among the elections considered, we see three plausible cases of cycles in Britain (February 1974, October 1974 and 2005). That is neither enough to sound alarm bells nor so few as to ignore the suspicion that cycling could be a problem.
Survey Data
We add evidentiary weight and clarification to our plausibility interpretations with recent survey data. By doing so, we also clarify our distinctions when referring to the probability versus plausibility of cycling and when commenting that a plausible cycle does not necessarily imply a cycle is likely.
The survey data are from the European Election Study 2004 conducted in summer 2004 shortly after June elections for the European Parliament. The national-level datasets include responses to questions about vote intentions in future national elections.Footnote 26 The first question of interest asks a respondent’s vote intention in the next general election. A set of follow-up questions asks ‘how probable is it that you will ever vote for’ party A, party B and so on.Footnote 27 We take responses to the vote intention question as a first-ranked vote preference as of 2004 and the probability statements as second-ranked and third-ranked preferences for the three major parties in the Britain. Respondents indicating a first preference for another party are given a three-party preference ordering based solely on their probability statements. Respondents reporting that they would not vote are excluded.Footnote 28
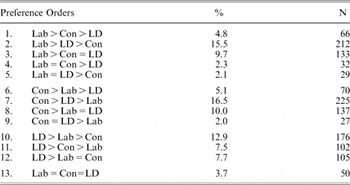
Table 3A shows the preference orders among survey respondents. There are thirteen instead of six preference orders because the six involve strict orderings (no indifference), whereas the survey data show indifference in any of seven categories – A = B (first or second), A = C (first or second), B = C (first or second), and A = B = C. The results agree with the Regenwetter et al. observation that when the full-scale preference orderings are known, a cycle is quite unlikely,Footnote 29 but also with our plausibility interpretation in the sense that whether a cycle would have existed depends on an even versus a lopsided split among those designated as indifferent between or among parties.
Distribution of United Kingdom Survey Respondent Preference Orders among Three Major Parties, 2004

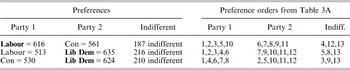
The results in Table 3B show that Labour is ahead of Conservatives 616 to 561, with 187 reporting indifference. Liberal Democrats are ahead of Labour 635 to 513, with 216 indifferent respondents. If those two outcomes hold, then for a cycle to occur, Conservatives would have to be able to defeat Liberal Democrats. That would not occur if indifferent voters split 50:50 as implied by their indifference, given the tallies of Conservative 530, Liberal Democrats 624, indifferent 210. Indeed, a cycle arises, ceteris paribus, if Conservatives somehow received more than 72 per cent of the 210 voters saying that they are indifferent between them and the Liberal Democrats. On this full-scale ranking evidence, therefore, the Liberal Democrats form the majority party, even though without knowledge of the full-scale rankings a cycle appeared plausible.
Three-way Paired Comparisons, 2004

Source: European Election Study – see fn. 26 and http://www.europeanelectionstudies.net/.
Conclusion
The issue of cycling and its effect on election procedures persists. The lack of data regarding complete preference profiles of the voters aggravates the problem, making it difficult to conclude whether a cycle was likely to have the potential to occur in a given contest. We devise a means of using first-place votes to compute a likelihood of cycles in three-party elections. Results from the model indicate that cycling probabilities are not high, and in light of the plausibility, considerations are not enough to consider cycles debilitating. However, cycling probabilities often are not so low as to conclude that cycles are no problem. When a vote split among three parties is closer than 45–45–10, there is a substantial enough probability that arguments about the uncertainty of a cycle have credibility unless information about the full-scale preference orderings are known on the basis of information other than the election results themselves.