Introduction
Insulin resistance is a common underlying factor of the metabolic syndrome and is considered as an important risk factor for cardiovascular disease both in children and adults. Reference Ormazabal, Nair, Elfeky, Aguayo, Salomon and Zuñiga1 However, few data are available on “other than” insulin derived measures of insulin resistance and their relationship with left ventricular hypertrophy in obese individuals. Reference Gutin, Treiber, Owens and Mensah2–Reference Klisic, Kavaric and Ninic7 We have recently reported independent positive association between serum uric acid levels and relative wall thickness, as well as, between increased triglycerides to high-density lipoprotein cholesterol ratio and left ventricular mass index in group of obese (both hypertensive and normotensive) children. Reference Bjelakovic, Stefanutti and Bonic8,Reference Bjelakovic, Stefanutti and Vukovic9 We have pointed out several potential mechanisms by which serum uric acid or increased triglycerides to high-density lipoprotein cholesterol ratio may influence left ventricular remodelling. As for serum uric acid, these include impaired nitric oxide generation, endothelial, dysfunction, vascular smooth muscle cell proliferation, stimulation of the rennin–angiotensin system, and inflammatory mediators such as tumor necrosis factor and mitogen-activated protein kinases, which are known to induce arterial hypertension and/or promote cardiac hypertrophy. Reference Kuczmarski, Ogden and Grummer-Strawn10,Reference Wallace, Levy and Matthews11
We also proposed a link between atherogenic dyslipidemia (high triglycerides to high-density lipoprotein cholesterol ratio), aldosterone and left ventricular hypertrophy as a possible explanation for insulin resistance concentric remodelling in obese children. Reference Bjelakovic, Stefanutti and Bonic8,Reference Bjelakovic, Stefanutti and Vukovic9
To avoid overadjustment bias caused by controlling for different mediating variables, the aims of this study were to explore the relationship between homeostasis model assessment index (commonly used insulin derived measure of insulin resistance), serum uric acid levels and triglycerides to high-density lipoprotein cholesterol ratio with left ventricular mass and geometry in normotensive obese children.
Material and methods
Study design
We analysed data of 73 obese children who were referred from January 2016 to October 2020 by local and regional health units to our institution for further clinical evaluation. The inclusion criteria were: average ambulatory systolic blood pressure <95 percentile, 24 hours BP systolic load <25%, and no history nor regular use of antihypertensive medication.
The study was approved by the Ethical Committee for Medical Research (protocol number 01-9002-6). We obtained an informed consent from parents of the children included in the study. Body mass index was calculated as weight (in kg) divided by height (in m) squared. Obesity was defined as a body mass index at or above the 95th percentile for children and teens of the same age and sex, according to the reference values published by the Centres for Disease Control and Prevention. Reference Kuczmarski, Ogden and Grummer-Strawn10
Covariates
In all study participants we measured: a) standard lipid profile (cholesterol, triglycerides, low-density lipoprotein, and high-density lipoprotein), plasma glucosae level and serum uric acid (determine on Beckman Coulter, LX20.) and b) insulin level – using a chemiluminescent assay (determine on AccessDxI800; Beckman Coulter Inc., Brea, CA). All blood specimens were taken after at least 10 hours of overnight fasting.
The 24-hour ambulatory blood pressure monitoring was performed using the Scanlight measurement device (Scanlight III; I.E.M GmbH, Germany), which, according to a certificate of equivalence DIN EN 9001:2000, 13485, CMDCAS is functionally and technically identical to the Mobil-O-Graph New Generation device that was validated in children.
The homeostasis model assessment index was calculated as a product of the fasting plasma insulin level (microU/ml) and the fasting plasma glucose level (mmol/L) divided by 22.5.Reference Wallace, Levy and Matthews11 We further calculated the triglycerides to high-density lipoprotein cholesterol ratio in every participant.
Left ventricular structure
We studied left ventricular structure (geometry) through a 2-D standard echocardiography and the left ventricular myocardial mass index was measured by M-mode echocardiography using the Devereux formula indexed by body height to the power 2.7. Relative wall thickness was defined as the insulin resistance wall thickness + septal thickness relative to the internal dimensions of the insulin resistance (12). The cutoff value ≥41% of relative wall thickness was used to define concentric left ventricular remodelling and ≥51 g/m2.7 was used to define the eccentric left ventricular remodelling.
All echocardiographic measurements were performed in triplicate by the same cardiologist (BB) who was unaware of the subject’s BP, and the average left ventricular mass index values were used across the analyses.
Statistical analysis
Descriptive analyses of the demographic and clinical characteristics of the participants, using mean, median, range and standard deviation for continuous and frequencies for the categorical variables, were performed. The assumption of normality was checked through the Shapiro–Wilk test and variables with a skewed distribution (body mass index, insulin, triglycerides, serum uric acid, glucose, triglycerides to high-density lipoprotein cholesterol and homeostasis model assessment index) were logarithmically transformed to achieve normal distribution. We used Pearson’s chi-squared test for categorical, Wilcoxon rank-sum test for nonparametric and two-sample t-test for parametric continuous variables to compare examined parameters between groups. The strength of correlation between different variables was evaluated using Pearson’s linear correlation. We also performed partial correlation analyses to evaluate the relative importance of body mass index in determining the association between insulin resistance and left ventricular mass index and relative wall thickness. Receiver operating characteristic analyses were performed to identify cutoff values of studied parameters in predicting increased left ventricular mass index and relative wall thickness. The p-value < 0.05 was considered statistically significant. All statistical analyses were performed using Stata software package v.15 (StataCorp. 2017. Stata Statistical Software: Release 15. College Station, TX: StataCorp LLC).
Results
Characteristics
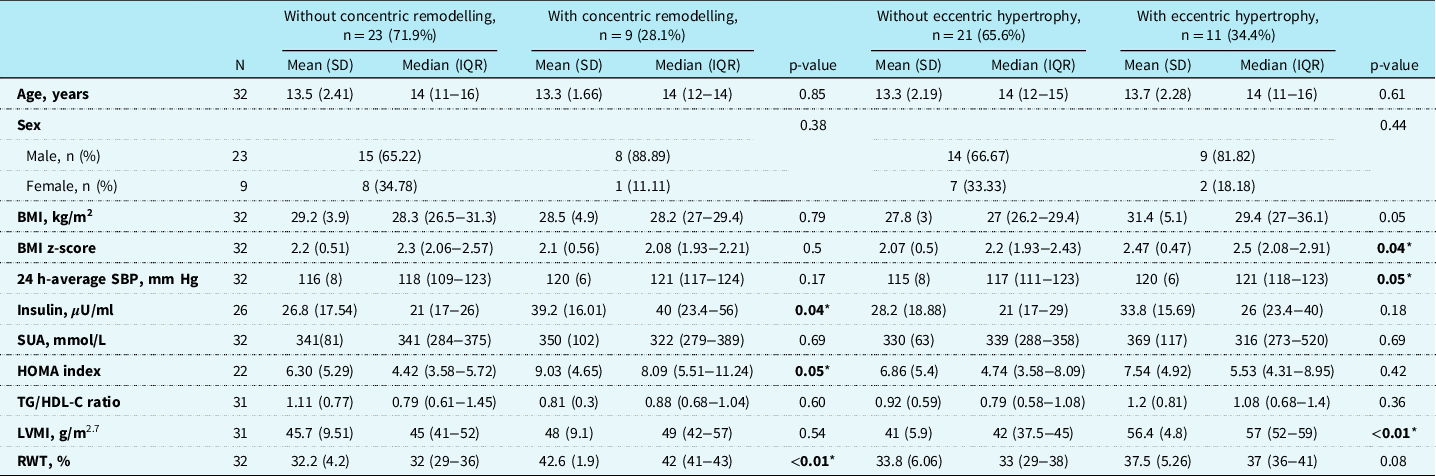
Of the initial sample of 73 obese children, 37 were excluded because of ambulatory or severe ambulatory hypertension and 4 were excluded because of the history of antihypertensive drug use. The study finally included 32 normotensive obese children. Most of the participants were boys (71.9%) and the mean age of children was 13.4 (SD = 2.20) years. Mean value of the relative wall thickness was 35.1% (SD = 5.99) and the mean left ventricular mass index was 46.3 g/m2.7 (SD = 9.3). Based on the relative wall thickness value, nine (28.1%) participants were classified as having concentric remodelling (relative wall thickness ≥ 41%), while using the left ventricular mass index value 11 (34.4%) had eccentric hypertrophy (left ventricular mass index ≥51 g/m2.7). Detailed characteristics of the participants according to the presence of concentric and eccentric hypertrophy are presented in Table 1. There was no statistically significant difference in age and sex distribution between groups with and without concentric remodelling (p = 0.85 and p = 0.38, respectively). Children with concentric remodelling had a median body mass index of 28.2 kg/m2 (IQR = 27−29.4), while those without concentric remodelling had body mass index of 28.3 (IQR = 26.5−31.3) (p = 0.79). Mean 24-hour average systolic blood pressure was 120 mm Hg (SD = 5.7) in concentric remodelling group and 116 (SD = 8) in the group without concentric remodelling (p = 0.17). Lower median serum uric acid values (322 mmol/L, IQR = 279−389) and higher median values of triglycerides to high-density lipoprotein cholesterol ratio (0.88, IQR = 0.68−1.04) were found in children with concentric remodelling but the differences were not statistically significant compared to the other group (p = 0.69 and p = 0.60). Homeostasis model assessment index was available in 22 (68.8%) children and was significantly higher (median 8.09, IQR = 5.51−11.24) in the group with concentric remodelling (p = 0.047).
General characteristics of the study participants according to the presence of concentric remodelling and eccentric hypertrophy

Indicators of significance between groups using Pearson’s chi-squared test for categorical and Wilcoxon rank-sum test for nonparametric and two-sample t-test for parametric continuous variables.
* Significance levels are given for p < 0.05.
There was no significant difference in age and sex between two groups of children with and without eccentric hypertrophy (p = 0.61 and p = 0.44, respectively). In the group with eccentric hypertrophy, median body mass index was 29.4 kg/m² (IQR = 27−36.1) while in the group without eccentric hypertrophy the median body mass index was 27.0 (IQR = 26.2−29.4) (p = 0.05). Children with eccentric hypertrophy had a higher mean 24-hour average systolic blood pressure of 120 mm Hg (SD = 6.04) with respect to those without (p = 0.048). Lower median values of serum uric acid (316, IQR = 273−520), higher homeostasis model assessment index (5.53, IQR = 4.31−8.95), and higher values of triglycerides to high-density lipoprotein cholesterol ratio (1.08, IQR = 0.68−1.4) were found in children with eccentric hypertrophy (p = 0.69, p = 0.42 and p = 0.36, respectively).
Of the investigated insulin resistance elements, we found positive correlations between homeostasis model assessment index and relative wall thickness (r = 0.47, p = 0.03) which remained significant even after controlling for the effect of body mass index z-score (r = 0.48, p = 0.03) (Table 2). The serum uric acid and triglycerides to high-density lipoprotein cholesterol ratio had positive but not significant correlations with relative wall thickness (r = 0.21, p = 0.25; and r = 0.06, p = 0.76, respectively). On the other side, none of the investigated insulin resistance elements had a significant correlation with left ventricular mass index and was even weaker after accounting for the effect of body mass index z score (serum uric acid, r = 0.001, p = 0.99; homeostasis model assessment index, r = 0.02, p = 0.95; and triglycerides to high-density lipoprotein cholesterol ratio, r = 0.24, p = 0.21). The body mass index z-score had a weak non-significant correlation with relative wall thickness (r = 0.06, p = 0.74) while it was strongly correlated with the left ventricular mass index (r = 0.45, p = 0.01).
Correlation and partial correlation analysis of RWT and LVMI with IR elements

alog transformed; §adjusted for BMI.
z-score; *p < 0.05.
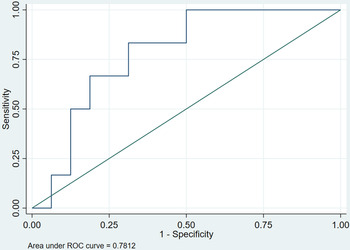
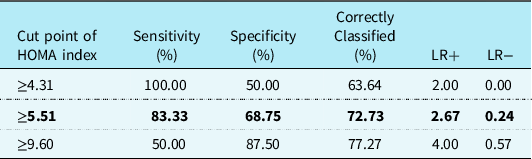
Using the receiver operating characteristic analyses of homeostasis model assessment index for prediction of concentric hypertrophy, we identified the area under receiver operating characteristic curve of 0.78 (95% CI 0.58−0.98) for homeostasis model assessment index, as presented in Fig. 1. The cutoff levels of homeostasis model assessment index with optimum sensitivity (Sn) and specificity (Sp) derived from the receiver operating characteristic curves for predicting concentric remodelling were ≥5.51 with a Sn = 83.33 and Sp = 68.75 (positive likelihood ratio (LR+) = 2.67, and negative likelihood ratio (LR−) = 0.24), as presented in Table 3.
A receiver operating characteristic (ROC) curves of HOMA index for prediction of concentric remodelling.

Sensitivity, specificity, positive and negative likelihood ratio of admission HOMA values for concentric remodelling identification

Note: in bold = best sensitivity and specificity selected.
Discussion
The main finding of our study is that homeostasis model assessment index is positively associated with relative wall thickness in normotensive obese children. The second finding is that neither serum uric acid levels nor triglycerides to high-density lipoprotein cholesterol ratio is associated with left ventricular geometry changes in normotensive obese children. We also found no correlation between homeostasis model assessment index and left ventricular mass index.
It is now well appreciated that left ventricular hypertrophy in hypertensive obese patients is not only mediated via a clear-cut increase in blood pressure, but also by various neurohormonal and metabolic factors that independently exert trophic effects on myocytes and non-myocytes in the heart. Reference Weiss, Otvos, Sinnreich, Miserez and Kark12–Reference Cheng, Lin and Chao14 A growing literature supports the view that the cardiometabolic phenotype, defined by the insulin resistance plays a critical role in left ventricular remodelling independently of the body mass index. Reference Pires, Martins and Pereira6,Reference Hsu, Chen and Chang15 In this regard, a number of studies emphasise the importance of oxidative stress, subcellular signalling abnormalities, autonomic dysfunction, activation of the renin–angiotensin–aldosterone system as a potential aetiology for cardiovascular damage and left ventricular remodelling in both “obese” and “non-obese” individuals with insulin resistance. Reference Richey, Disessa, Somes, Alpert and Jones16 Moreover, it was shown that hyperinsulinemia directly increases cardiac mass through the interaction between insulin, its receptor and insulin-like growth factor-1 receptor expressed in the myocardium. Reference Hsu, Chen and Chang15,Reference Yan, Liu and Wang17,Reference DeBosch and Muslin18 Animal studies in mice further shown that chronic insulin infusion increases the left ventricular mass and relative wall thickness. Reference Samuelsson, Bollano and Mobini5 Reduced levels of insulin-like growth factor-1 in patients with insulin resistance are also associated with higher circulating levels of growth hormone and insulin that promote hypertrophy and myocardial fibrosis. Reference DeBosch and Muslin18 However, the relative importance of the other than “insulin derived” surrogates of insulin resistance, with different underlying pathophysiologies that would be responsible for left ventricular remodelling in obese children is still not completely evaluated.
Studies in adults have reported conflicting results concerning the relationship between insulin resistance and left ventricular structural changes both in the general population and the patients with cardiovascular risk. This is possibly a consequence of different estimates of insulin resistance as well as high prevalence of common confounding risk factors in adults, such as the older age, autonomic dysfunction, hypertensive disease and atherosclerosis. Reference Bjelakovic19–Reference Sundström, Lind, Vessby, Andrén, Aro and Lithell22 All these make the inferences from these studies less accurate. In the CARDIA study, a cumulative exposure to glycemic abnormalities and high insulin resistance was associated with increased relative wall thickness depending on the obesity level. Reference Levelt, Mahmod and Piechnik23,Reference Mishra, Bedja, Amuzie, Avolio and Chatterjee24 Results of the Gubbio study showed no association between the left ventricular mass and plasma insulin, independently of the body mass index, while the MESA study reported that insulin resistance is associated with concentric left ventricular remodelling independent of body mass index, which is in agreement with our findings. Reference Ferrara, Vaccaro, Cardoni, Panarelli, Laurenzi and Zanchetti25
A few studies that have explored the relationship between insulin resistance measures and left ventricular mass in children reported conflicting results. Reference Gutin, Treiber, Owens and Mensah2,Reference Steinberger, Jacobs and Moran3,Reference Pires, Martins and Pereira6,Reference Kishi, Gidding and Reis26 Some found an association between insulin resistance and left ventricular mass, whereas others found no relation at all, after adjusting for covariates. Reference Gutin, Treiber, Owens and Mensah2,Reference Urbina, Gidding, Bao, Elkasabany and Berenson4,Reference Ferrara, Vaccaro, Cardoni, Panarelli, Laurenzi and Zanchetti25,Reference Vaccaro, Cardoni and Cuomo27–Reference Yoneyama, Venkatesh and Wu29
Gutin et al. as well as Atabek et al. found that the relationship of fatness to left ventricular mass may be due to the higher insulin concentrations in the fatter children. Reference Gutin, Treiber, Owens and Mensah2,Reference Atabek, Akyüz, Eklioǧlu and Çimen28 The Bogalusa Heart Study reported the association between fasting blood sugar and left ventricular mass in youth. Reference Urbina, Gidding, Bao, Elkasabany and Berenson4 Contrary to these results, Steinberger et al. reported that left ventricular mass was not related to insulin resistance as measured by the euglycemic clamp which is also in agreement with our findings. Reference Steinberger, Jacobs and Moran3 Although, we have not found any relationship between the serum uric acid levels and triglycerides to high-density lipoprotein cholesterol ratio with left ventricular mass and relative wall thickness which is contrary to our previous observation, we cannot exclude the possibility of over adjustment bias and confounding effects related to high blood pressure hemodynamic load on the left ventricular geometry in our previous research.
On the other hand, our results emphasise the importance of insulin’s direct anabolic effects on cardiac tissue and its role in the pathogenesis of concentric left ventricular remodelling. According to our knowledge, this is the first study to investigate the relationship between different insulin resistance estimates and the left ventricular geometry in normotensive obese children. Likewise, this is the first study to suggest the association of homeostasis model assessment index (insulin derived measure of insulin resistance) and the presence of concentric left ventricular remodelling in normotensive obese children.
There are several limitations of this study, including a small number of participants, accuracy and validity of insulin resistance estimates as well as the absence of data of the control group of lean children with insulin resistance. We also cannot exclude the effects of some potential genetic determinants and environmental effects that were not considered in our study which may have ultimately influenced the correlations reported here. Further studies with larger sample sizes are required to explore the nature of the changes in cardiac structure (geometry) as a result of insulin resistance in obese normotensive children.
Financial support
This work was supported by grant No 175092 from the Ministry of Science and Technology of Serbia.
Conflict of interest
None.
Ethical standards
The study was approved by the Ethical Committee for Medical Research (protocol number 01-9002-6). We obtained an informed consent from parents of the children included in the study.