


INTRODUCTION
E. coli O157:H7 is a foodborne pathogen that can cause serious infection in humans. Scotland, in particular, has exhibited some of the highest rates of infection in the world [Reference Reilly1]. Following a major foodborne outbreak in Wishaw, Central Scotland, in 1996, in which 21 people died after consuming meat products from a butcher's shop, research was commissioned into the prevalence of E. coli O157 in Scottish beef cattle. In particular, the Scottish Prevalence Study focused on the sampling of finishing cattle since these animals represented the group most likely to enter the human food chain in the immediate future. The survey found that 8% of cattle were shedding the organism and that 23% of ‘close to slaughter’ groups of cattle contained at least one shedding animal [Reference Synge2]. A greater understanding of the infection dynamics within a herd is required in order to reduce these unacceptably high prevalences in cattle.
There has been little modelling work in this area, with the exception of the detailed model of Turner et al. [Reference Turner3], which focuses on a deterministic representation of infection transmission within a dairy herd. We instead propose a stochastic simulation model which is able to take account of both the heterogeneities that exist in the main routes of infection transmission and the low levels of infection that can occur. This model has been developed not just to gain further insight into the infection dynamics of E. coli O157, but also to be used to determine methods of control which would be efficient in reducing the level of infection currently observed in cattle herds. The advantage of using such a model is that it can be relatively straightforward to investigate the efficacy of a wide range of control measures, including those that are currently undergoing research and development.
The development of the model is described in the Methods section below. Potential control strategies are then assessed using the model. These methods, which are aimed at reducing levels of infection within a herd, include altering the size of herds, niche engineering, improving housing hygiene and vaccination.
METHODS
Simulation model
The aim is to develop a parsimonious model that incorporates the key biological processes underlying the infection dynamics. These include two plausible routes of infection transmission: contact with bacteria in the environment and direct contact with infected animals. The incorporation of these transmission routes in a biologically realistic fashion has implications for the design of the model. For instance, bacteria are not shed randomly over a field, as faecal pats generally have a clustered distribution. Therefore, given the movement of a particular animal over a field while grazing and the aversion animals show to faeces produced by their own species, it is possible for an animal to fail to come into contact with any infection. In addition, given the relatively low herd size involved, any social behaviour which affects the interaction of animals with each other is likely to result in a heterogeneous infection process. Consequently, results emanating from a model which assumes homogeneous environmental contamination and homogeneous cattle behaviour are likely to be misleading. Therefore, it seems appropriate to construct a model which is not simply based on the evolution of the infection process in a fixed population of animals, but also considers the properties of the spatial environment.
Ideally, a realistic herd model would involve keeping track of the location of each member of a herd in a field with respect to other animals and to areas of contaminated pasture. However, a spatial model of this type has the potential to become extremely complex, and so, where possible, attempts are made to reduce the spatial complexity. Space is discretized by splitting the field to be modelled into a grid. This is appropriate since a herd size is relatively small and the movement of individuals occurs on a large spatial scale. There are also two different spatially dependent processes which promote the spread of infection, namely the movement of individuals and the interactions amongst individuals (and between individuals and the environment).
For many spatio-temporal population models, the complex nature of the process may mean that neither exact nor approximate analytical results can be obtained. Complex models can be simplified by making assumptions such as large population size and long process duration, although in the case of the herd model, neither simplification is biologically plausible. In addition, the failure of the system to be described adequately by a percolation or standard contact process [Reference Mollison4], in which the infection hosts remain spatially immobile, means that it is difficult to see how analytical results could be obtained. Therefore, in order to proceed further, it is necessary to employ computer simulations. However, this approach facilitates the incorporation of further realism into the model.
Model description
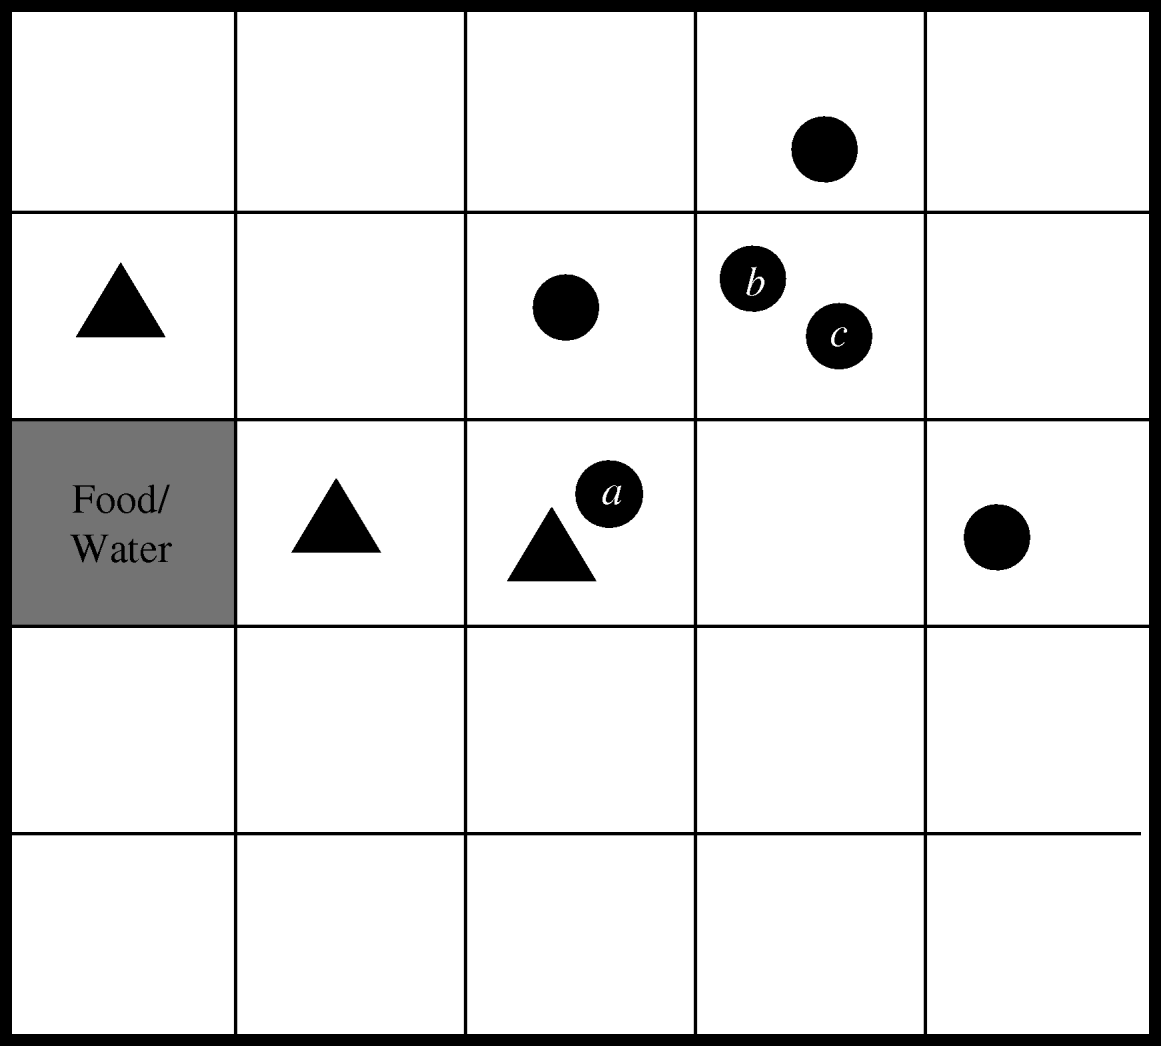
The within-herd simulation model was developed using the C++ programming language to simulate a herd of cows at pasture. The program keeps track of not only the location and infection status of each cow within the herd, but also the location of E. coli O157 contamination within the field. This is achieved by splitting the field up into a grid, a conceptual version of which is shown in Figure 1. A herd size of 20 was chosen as this was found to be the average group size of finishing cattle sampled in the 1998–2000 Scottish E. coli O157 Prevalence Study [Reference Synge2]. Each grid-square is assumed to be large enough to contain two cows in very close contact to each other. Therefore, based on the recommended population density for cattle, a grid of 150×150 squares was used to represent the grazing area for the herd [Reference Chadwick5].
Conceptual representation of herd model (circles represent cows, triangles indicate E. coli O157-contaminated squares).
Movement process
The simulation model randomly allocates initial grid-square locations for each cow using the ran1 random number generator [Reference Press6]. However, it is not appropriate to model herd behaviour using random movement, as the spatial distribution of large ruminants is influenced by factors such as food supply, topography and climate, in addition to social forces, all of which can cause animals to form groups. Given that the two methods of infection transmission in this model involve contact either with other animals or grazing where other animals have been present, it is important to incorporate some form of between-animal correlated movement into the model as otherwise the results of the simulation could be severely biased.
Initially, foraging models were considered. However, the decision-making processes described by these models tend to be very complex, as illustrated by Hutchings & Gordon [Reference Hutchings and Gordon7]. Given that in this model it is grazing distribution patterns that are of interest, not the reasoning behind each cattle movement, it is appropriate to adopt a more simplistic method which nevertheless captures the essence of the observed spatial distribution. Thus, the social dynamics of a group of grazing cattle were considered more closely. The existence of a social hierarchy amongst cattle has been known for many years; it is documented that cattle can be classified as either leaders, followers or independent movers in the social group [Reference Sato8]. Animals ranked highly in social dominance tend to be leaders, while the animals which move independently are mostly low ranking [Reference Sato8–Reference Albright and Arave10]. It has been suggested that the movement of the group, as a whole, evolves from a combination of high-ranking ‘leader’ movements and independent movers, with younger, less experienced grazers tending to distribute themselves more evenly across the group, essentially providing the cohesive force [Reference Sato8]. This notion forms the basis of the movement process in the herd model.
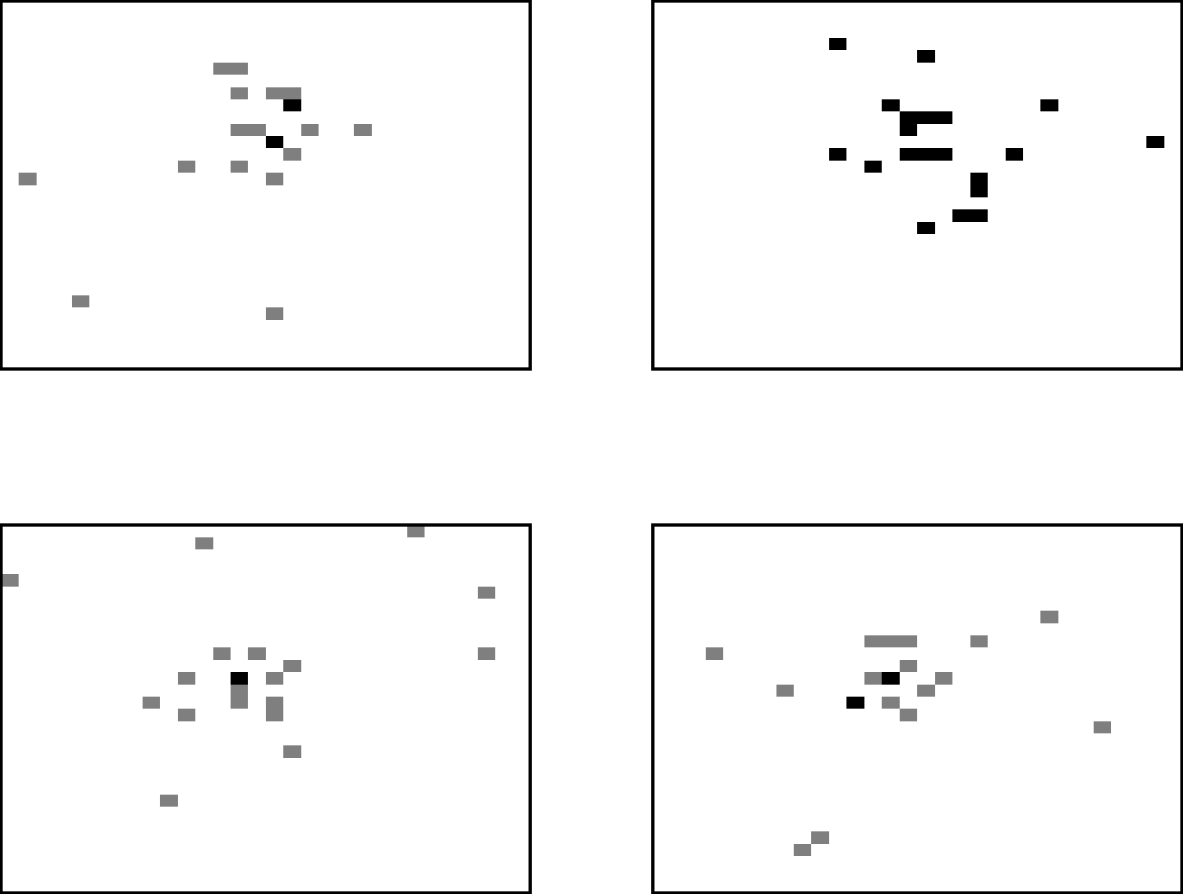
The movement process allows three types of movement. Animals can be classified as independent movers with the destination being determined by a random selection of any grid-square. Alternatively, the animal can be treated as a ‘follower’, moving towards the average location of the herd, and hence tending to create a cluster of animals. The average location of the cows is determined by summing each of the x- and y-coordinates of grid-squares containing cattle and dividing by the herd size. However, rather than just moving to the average grid-square location, some variability is added, both for the practical reasons of reducing the chance of too many cows inhabiting one square, and also because a deterministic movement does not describe realistic behaviour. The new position was generated by sampling from a normal distribution around the average location and so the cow moves approximately towards the centre of the herd. The third type of movement is known as a ‘drink’ move, where animals move directly to the grid-square containing the source of drinking water. The frequency of drinking moves was ascertained from reported drinking behaviour [Reference Arnold and Dudzinski11]. Figure 2 illustrates the spatial distribution of the herd obtained by this movement process for four different realizations, with the location of each animal being identified by a shaded grid-square. The results are based on a herd size of 20 and grid-size of 30×30 to aid clarity. Multiply occupied squares are identified by darker levels of shading. It is clear from these ‘aerial’ views that the movement method is successful in producing large-scale clustering behaviour. In each example, a few independent animals can also be observed.
Four realizations of the locations of cows within a field at 18:00 hours, modelling movement with the described movement process.
This novel approach is not meant to provide a definitive model for grazing distributions, since, as stated previously, this would be too large a task in the context of a within-herd infection model. For instance, the model fails to take account of the spatial memory seen in animals. Studies have shown that cattle will frequently return to areas of high-quality forage and avoid recently depleted patches [Reference Bailey9, Reference Bailey, Walker and Rittenhouse12]. The average movement method has no memory and places no constraints on the overall group movement. Rather, the aim of the model was to formulate a simple process which incorporated those aspects of the within-herd system most pertinent to the infection process. These plausible movement patterns give rise to considerably more contacts than would have occurred under the unrealistic assumption of purely random movement.
Each movement event involves the random determination of which cow is to be moved and the type of movement to be carried out. The movement to a new grid-square is assumed to occur instantaneously since this behaviour does not account for a large portion of the daily activities of the cow [Reference Albright and Arave10]. Time intervals between movement events are exponentially distributed using an overall transition parameter which is based on the speed of the animals multiplied by the herd size. Since cattle are crepuscular [Reference Fraser13], peak grazing times are correlated with sunrise and sunset, and hence two speed parameters were employed in order that more movement was generated in the periods 04:00–11:00 and 14:00–17:00 hours than in the remaining hours. The estimates for these parameters were determined by adjusting their values until the average daily simulated distance travelled by the cattle approximated that of real animals at around 3·14 km per day [Reference Albright and Arave10].
Infection process
It is necessary to model the environmental contamination which is assumed to arise from infected animals defecating onto the pasture. This is done by assuming that once infected with E. coli O157, there is an 18-h lag phase to allow the bacteria to pass through the digestive system of the animal [Reference Balch14], following which the cattle shed bacteria in each faecal pat they produce until cleared of the infection. When an infected animal sheds faeces, at approximately 2-hourly intervals [Reference Phillips15], the grid-square in which it is located becomes contaminated for a fixed length of time of 30 days, which is typical of the duration that infected faeces from an individual animal remain culture-positive [Reference Kudva, Blanch and Hovde16]. After this time has elapsed the grid-square is deemed to be uncontaminated. If a contaminated square is recontaminated, the length of time remaining until that square becomes uncontaminated is reset to 30 days.
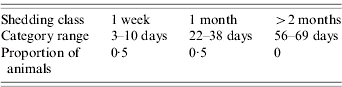
Since E. coli O157 is transmitted via the faecal–oral route only, the model assumes that the two ways in which a non-infected, susceptible cow can become infected are by grazing on contaminated land or by contact with an infected cow. Generally, cattle will avoid grazing on forage contaminated with faeces, although animals may come to prefer the mature forage that grows around faecal deposits, with the corresponding risk of inadvertent contact with infected faeces [Reference Albright and Arave10]. Hence, in the model, if a cow moves to a contaminated grid-square (for example, cow a in Fig. 1) there is a specified probability that it will become infected. This event is randomly determined using the ran1 random number generator [Reference Press6], which returns a uniformly distributed number between 0 and 1. Infection occurs if the random number is less than or equal to the transmission probability. If the animal was previously uninfected, it is reclassified as being infected. Since it is known that the length of shedding is highly variable between animals [Reference Sanderson17], the duration of shedding is determined randomly for each animal based on information from an experimental study which identified three different shedding patterns in inoculated cattle [Reference Grauke18]. Table 1 details the pertinent results from this study. Within each of these broad shedding classes there was further variability. For example, cattle classified as shedding for just one week actually shed for between 3–10 days. As there are at least 12 days separating each of the three ranges, it was concluded that the shedding classes are distinct [Reference Grauke18].
Details of the three shedding classes observed by Grauke et al. [Reference Grauke18]

Hence, when an animal becomes infected, a Uniform(0,1) random number is generated to determine into which shedding pattern it falls. To define the exact length of shedding, in the absence of further information, it is assumed that, within each range, shedding periods of each length are equally likely. For example, if the random number was <0·33, the animal would fall into the 1-week category and the duration would be modelled by sampling a random integer from a Uniform(3,10) distribution.
It has been found experimentally that re-inoculated animals shed for a shorter period than that seen following initial inoculation. Hence, if an infected animal becomes re-infected, the remaining infection duration is only increased by a week [Reference Sanderson17].
The alternative mode of transmission occurs when a susceptible animal moves into a grid-square containing an infected animal (for example, cows b and c in Fig. 1). Cattle will maintain not only their own haircoat but also those of their herd mates by licking, rubbing and grooming. However, this behaviour may cause ingestion of bacteria if the haircoat is contaminated with infected faeces, adhering, for example, when an animal has lain down to rest. A probability of ingestion is defined for use when randomly determining whether such an event occurs.
It is assumed that the probability of infection via direct contact is greater than the probability of infection resulting from inadvertent ingestion of bacteria from the environment, since cattle exhibit faecal-avoidance behaviour and relatively efficient calf-to-calf transmission has been demonstrated [Reference Besser19]. However, the true probabilities of ingesting E. coli O157 either whilst grazing or grooming are unknown. Although it seems reasonable to assume that they are very low, estimates had to be inferred from a comparison of the prevalences arising from simulation runs and the reported prevalences of E. coli O157 shedding within herds.
The values for these two transmission parameters were obtained by running the simulation model using different combinations of options generated by systematically sampling from a plausible discrete parameter space, with the combination that generated typical prevalences within the range of 7·3–10% found in the Scottish Prevalence Study [Reference Synge2] being selected. This method resulted in values of 0·0008 and 0·0001 being selected for the animal-to-animal and environmental infection transmission parameters respectively. This particular pair of values was chosen because they produced a within-herd prevalence at the higher end of the range identified by the Scottish Prevalence Study, since due to the use of a diagnostic test with a sensitivity of <100%, survey results generally underestimate the true herd prevalence [Reference Sargeant20].
Adaptability of model
The design of the model ensures that it is relatively straightforward to apply the model to more complex scenarios than that of simply a herd of adult cattle grazing in a regular field. For instance, in order to run the within-herd simulation model with a mixed-age herd, it is necessary to obtain a set of parameters for calf shedding behaviour, based on those already established for adult cattle. This can be achieved by identifying the major differences in infection behaviour between adults and calves (for instance, calves tend to shed bacteria for a longer period of time), and then adjusting the adult parameters accordingly.
In addition, as most herds in the United Kingdom are housed for at least part of the year, being able to adapt the model to describe these living conditions is desirable. While the model does not translate well for certain types, such as cubicle housing, in which stalls restrict the movement of the animals, it is possible to modify the model to describe animals kept in loose housing. Such housing allows animals to move freely within the confines of, for example, a shed. The change to the model is essentially one of population density and is implemented by reducing the grid-size to a size consistent with animals having enough space to comply with minimum comfort guidelines [Reference Britt21].
The proposed model is based only on the presence or absence of infection in the grid-square occupied by a particular animal. It is theoretically possible to convert the model to one that classifies bacterial concentrations present in the environment on a semi-quantitative scale. However, this approach requires the program to keep track of the infection status of not just every animal and grid-square, but also every single infected faecal pat and the resulting increase in CPU time proved to be prohibitive.
Statistical considerations
The assessment of differences arising from different simulation runs is problematic. Subject to sufficient computing power, a sufficient number of realizations can always be generated to ensure that estimated means are statistically significantly different at some arbitrary level of significance. The results presented in this paper are derived from simulated sample sizes of 50, a number which should guarantee a high power to detect differences with potential relevance to farm management. Results are evaluated in the context of a hypothesis test: where there is no statistically significant difference, results should be interpreted as potentially spurious.
RESULTS
Baseline scenario
In order to evaluate the efficacy of potential on-farm control strategies, it is necessary to simulate a standard grazing scenario against which the control strategies can be assessed. This baseline scenario consists of a simulated herd of 20 animals grazing on pasture. The source of the infection is an infected animal being introduced into the herd at the start of the simulation. This choice of mechanism seems reasonable given the findings of Rahn et al. [Reference Rahn22], who noted that isolates that test positive for E. coli O157 are more frequently obtained from cattle than from the farm environment. This section details the modifications that were required to simulate each of the evaluated control measures in turn, along with the results obtained from the model. In order to establish whether the results obtained are statistically significant, mean numbers from the baseline scenario are compared against those obtained from control measure scenarios at each individual time-point using a t test. Over a suitable set of temporally congruent time-points, the P values derived from this exercise are evaluated using a procedure [Reference Benjamini and Hochberg23] to control the expected false discovery rate, which is set to the standard 5% level. This approach adjusts the significance of each individual test to allow for the multiple testing which is taking place.
Herd size
It is plausible that the size of groups in which animals are managed could influence the infection dynamics and hence be used as a control measure. Results from theoretical epidemiology support this view. Taking one of the simplest stochastic models of endemic infection, the closed SIS (Susceptible–Infected–Susceptible) model as an example, since it approximates the transient nature of E. coli O157 infection dynamics, it has been demonstrated that the thresholds above which infection invasion and persistence occur depend on the population size of susceptible individuals [Reference Nåsell and Mollison24, Reference Jacquez and Simon25].
To test these theoretical results, the model was run several times, based on the standard grazing scenario, but using a different herd size each time. The results can be seen in Figure 3. The mean number of infected animals in each herd, averaged over 50 runs, are plotted over a period of just over 4 months. A clearer picture of the behaviour of the infection process for a particular herd size could have been obtained by plotting results generated over a longer time period, but since a herd is unlikely to be kept in the same field for lengthy periods of time, this long-term component of the evolution of the infection process was disregarded for infection control purposes. In addition, a purely short-term consideration of control strategies permits the seasonality often observed in the distribution of shedding levels to be ignored. The initial drop-off that is observable for all herd sizes occurs when the initial infected animal, used in every run to introduce infection, becomes clear of infection. Following that event, the only contribution to the mean infection level at each herd size are the non-primary infections caused by that initial animal.
Comparison of the mean number of animals in a herd that are infected, over time, using herds of different sizes, averaged over 50 realizations.

The mean level of infection in a herd of size 20 was found to increase to, and persist at, a level of ∼10% for the first 3 months following infection, after which a gradual decline in prevalence is apparent. As the quasi-equilibrium level is around 1–2 infected animals, it is inevitable that over time the infection will die out in an increasing number of realizations, which explains why a decline in the mean herd prevalence should occur. Given the results which follow and the theoretical certainty of infection extinction in a stochastic model, had the plot been further extended over time, it is likely to have shown that the observed decrease indicates a genuine downward trend. Nevertheless, assuming that an infected animal entered such a herd as soon as the cattle were put out to grass in the spring, it is unlikely, given the rate of decline discussed above, that the herd would be free of infection by the time the animals were due to be housed indoors again in late autumn. Achieving infection-free herd status before the animals are turned in should be an aim, given the large increase in infection prevalence reported for housed animals [Reference Synge2].
Thus, the simulation model was run using herds with fewer than 20 animals to investigate the effect of herd size as a control measure since larger groupings are likely to result in an increased herd prevalence, as demonstrated by the realizations obtained for a herd of size 25. Figure 3 shows that reducing the herd size to 19 animals has little overall effect on the mean herd prevalence by the end of the time period considered, despite the infection persisting at a slightly lower level for the majority of time. However, a reduction to 18-animal herds results in a large decrease in the level at which the infection persists over time. Nevertheless, despite being very low, the mean infection level does not clearly tend towards zero during the simulated time-period of interest. It is necessary to consider herds consisting of fewer than 18 animals before extinction can reasonably be expected to occur within 4 months of initial infection. At the upper extreme, it is found that comparing the mean number of shedding animals for the scenarios with group sizes 20 and 25, over the 66 days from day 60 to the end of the study, controlling the false discovery rate to equal 5%, the mean numbers in the two groups are statistically significantly different on 21 days, in each case the group of size 25 having the higher mean prevalence. At the lower extreme, it is found that comparing group sizes 20 and 12, over the 66 days from day 60 to the end of the study and again controlling the false discovery rate to equal 5%, the mean numbers in the two groups are statistically significantly different on every day, in each case the group of size 12 having the lower mean prevalence. Hence, consistent with related theoretical results [Reference Nåsell and Mollison24, Reference Jacquez and Simon25], a dependency has been demonstrated between herd size and infection level, in that the lower the herd size, the lower the expected infection level at any particular time-point and therefore, a shorter time to extinction ensues.
Niche engineering
Another potential method for controlling infection is to improve the quality of on-farm hygiene. This modification of environmental factors found to be important in controlling susceptibility to colonization, level of exposure, or maintenance of the reservoir of infection in a herd is referred to as niche engineering [Reference Hancock26]. Given the nature of the farming industry, it would be virtually impossible to maintain a completely hygienic farm. Fortunately, the spatio-temporal clustering of shedding cattle suggests there could be point sources of infection, which might be environmental [Reference LeJeune, Besser and Hancock27]. This suggests that concentrating efforts on the regular cleaning of a certain few key areas could be beneficial in controlling the infection.
Of all the sites in the farm environment, feed mangers and water troughs have been found to generate the highest rates of samples that test positive for E. coli O157 [Reference Rahn22]. In fact, up to 10% of water troughs have been found to be contaminated [Reference Hancock28]. Focusing on water troughs in particular, it is likely that cattle are responsible for the frequent contamination of these items, as infected faecal matter and saliva can find their way into the water when the animals drink. It has been found that the detection of E. coli O157 in animal drinking water is often preceded by, or occurs at the same time as, detection of at least one positive animal within a herd [Reference Shere, Bartlett and Kaspar29]. Indeed, in addition to the large numbers of positive samples, there is much other evidence which suggests that water troughs may play a significant role in animal-to-animal transmission. For instance, positive animals tend to have shared the same water supply [Reference Faith30], herds containing infected animals tend to have been supplied drinking water in larger tanks, and when animals have been found to shed multiple strains of E. coli O157 only the strains detected in the drinking water have persisted on the farm [Reference Shere, Bartlett and Kaspar29].
In addition, a study by LeJeune et al. [Reference LeJeune, Besser and Hancock27] has found that E. coli O157 can persist in the water of a drinking trough for over 6 months and still have the ability to colonize cattle. Hence, water troughs can act as long-term reservoirs of the infection with the potential to infect cattle over a long period of time. Fortunately, the wide variability in contamination levels of water troughs across farms suggests that these levels could be reduced if subjected to appropriate management controls [Reference Hancock31].
LeJeune et al. [Reference LeJeune, Besser and Hancock27] found that chlorination of the water resulted in a significant reduction in the concentration of bacteria, although this strategy did not reduce the levels of bacteria contained in the sediments of these troughs. Therefore, to ensure an almost complete elimination of all bacteria present in the drinking water, it appears that it may be necessary for farmers to thoroughly clean and disinfect each trough, not replenishing, but replacing existing water with clean drinking water. This could prove to be a time-consuming task depending on the number of water troughs present on a particular farm and the frequency of these actions.
To determine whether this extra work would indeed help to control the on-farm level of infection, it was decided to compare scenarios in which the water troughs were cleaned out at different frequencies against the standard grazing scenario in which no control measures were employed. The time intervals between cleaning events for the two control scenarios investigated were selected to be 1 month and 1 week. In the standard grazing scenario, water is freely available from a single site, and so in order to model a cleaning event, it was assumed that any contamination present in the grid-square in which the drinking water was located would be removed by the cleaning action. Therefore, the environmental contamination status of the relevant grid-square was set to zero (i.e. non-contaminated) at each cleaning event. Thus, this occurred every 7 simulated days in the cleaning scenario which involved thorough cleaning of the water trough once a week, and every 30 days for the monthly cleaning scenario. The results obtained from running these simulations can be seen in Figure 4, where the mean prevalence in each of the herds, averaged over 50 runs, is plotted over time.
Comparison of the mean proportion of a herd of size 20 that is infected, over time, using several cleaning scenarios.

An inspection of the plot reveals that the prevalence of infection for the monthly cleaning scenario increases at approximately the same rate as the standard scenario, except that just after each 30-day period the prevalence can be seen to level off for a short period of time, before increasing again as the effect of the cleaning event wears off. Therefore, under this cleaning scenario, the proportion of infected animals in a herd reaches the same maximum observed under the standard scenario, although the overall time taken to reach this maximum is roughly doubled (120 days compared to 60 days). Comparing the standard prevalences with the monthly cleaning prevalences, at no single time-point is there any evidence of any statistically significant differences between the groups. Thus, the only effect of this level of cleaning is to reduce the probability of further animals becoming infected for a short period each month. However, under the more intensive weekly cleaning scenario, the herd prevalence peaked earlier, and more importantly, at a lower maximum level (approximately 7·5% after 80 days), before declining towards extinction. However, comparing the standard prevalences with the weekly cleaning prevalences, at no single time-point is there ever any evidence of any statistically significant differences between the groups. The result should therefore be interpreted in a qualitative sense: the pattern of behaviour is consistent over time, and a greater number of simulations would be likely to give rise to statistically significant results.
Improved housing hygiene
Having found, in the previous section, that niche engineering can provide a means for reducing the within-herd prevalence of infection, it was decided to investigate the efficacy of the method for the several months of the year for which many cattle are housed indoors.
Two different approaches to cleaning were considered. The first approach, identical to the method described in the previous section, involved the thorough cleaning of potential environmental reservoirs at prescribed intervals. Therefore, assuming that the water trough was again the key site of interest, and there was only one water trough in a typical housed area, a cleaning event could be modelled in a similar fashion to before. Hence, any contamination present in the grid-square in which the water trough was situated was deemed to have been removed by the cleaning event and so, at the relevant time-points, the environmental contamination status of this particular grid-square was set to zero (i.e. non-contaminated).
In practice, farmers often pack extra layers of bedding over existing layers, instead of the more hygienic option of first removing the existing bedding, before cleaning and replacing with fresh material. Obviously, the second option is preferable, when considering the potential to reduce infection, since because the herd is housed in a constrained area indoors, this option allows virtually all environmental contamination to be removed. Such a management practice would involve a considerable amount of extra work, and in addition, the cattle would have to be held in a clean holding area while the cleaning took place. Nevertheless, the method has the potential to significantly reduce the effect of environmental contamination on the within-herd prevalence. Assuming that any water troughs or other foci of infection would be cleaned at the same time, a cleaning event in this scenario was modelled by assuming that all contamination present anywhere within the entire grid would be removed. Thus, at the appropriate time-points, the environmental contamination status of every grid-square was set to zero.
The effects of each cleaning approach (either cleaning just the key environmental reservoirs or cleaning the entire housed area) implemented at both weekly and monthly intervals were investigated, and therefore, four different control scenarios were considered in all.
The simulation model was modified to run under an indoor scenario as outlined in the Methods section. This resulted in a two orders of magnitude reduction in the amount of space available to each animal compared with the standard grazing scenario, and therefore an increased prevalence of infection, as a result of increased contact and greater volume of environmental bacterial ingestion, might be expected, all other things being equal.
The plot of the mean prevalence in the herd averaged over 50 runs, obtained from the baseline scenario in which no controls are applied, can be seen in Figure 5. The maximum prevalence reached, over the time period for which results are plotted, is ∼50%, which far exceeds the standard grazing scenario maximum of roughly 11%. In addition, the prevalence rate appears to be still increasing at the end of the simulated time, although over 4 months have passed since the infection was first introduced into the herd. It is clear that effective control measures are particularly important in reducing the level of infection in housed animals.
Comparison of the mean proportion of a herd of size 20 that is infected, over time, housed indoors using several cleaning scenarios.
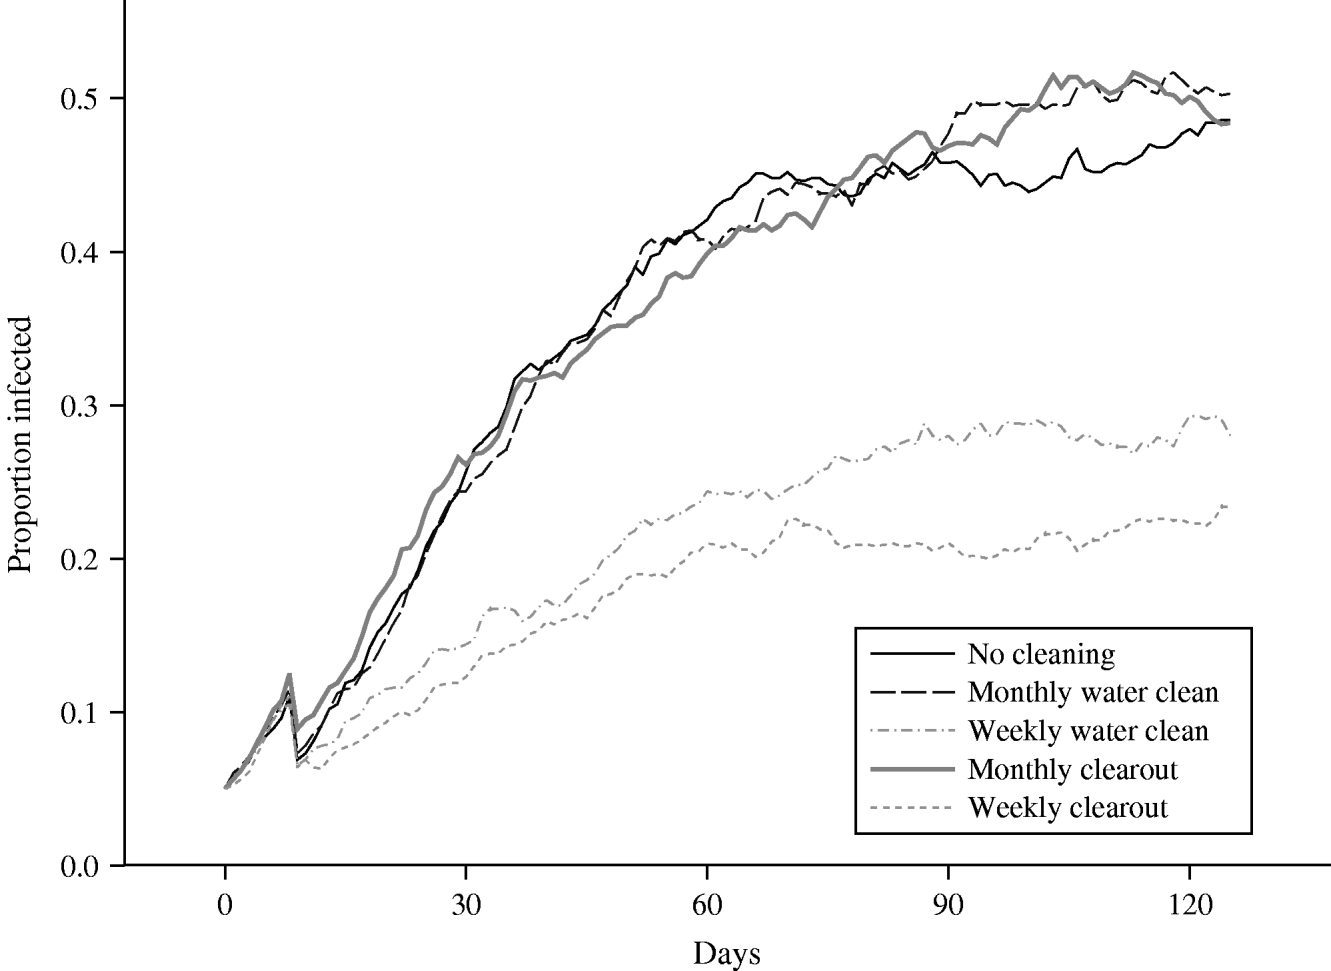
The effects of the four proposed control measures are also plotted in Figure 5. Targeting of key potential reservoirs of infection at monthly intervals appears to have little effect when the associated mean prevalence is compared to the standard prevalence rate. Towards the end of the plotted time, this mean prevalence under control is actually slightly greater than the standard prevalence, although this is probably due to stochastic variability within the runs. Comparing the mean number of shedding animals for the scenarios with no cleaning and a monthly water cleaning, at no single time-point is there any evidence of any statistically significant differences between the groups. However, cleaning out the water trough at weekly intervals results in a dramatic reduction in the proportion of animals within the herd that become infected; the prevalence is almost half that observed under the standard scenario, at all points in time. Comparing the mean number of shedding animals for the scenarios with no cleaning and a weekly water cleaning, over the 96 days from day 30 to the end of the study, and controlling the false discovery rate to equal 5%, the mean numbers in the two groups are statistically significantly different on each of the 96 days, in each case the group subject to weekly water cleaning having the lower mean prevalence. These results are encouraging because they show that even when a large proportion of a herd is infected, and thus are potentially shedding large amounts of bacteria into the environment, the relatively simple action of cleaning out the drinking water receptacle and refilling with fresh water could be highly effective in reducing the prevalence if carried out sufficiently frequently.
The second cleaning approach involves the cleaning of the entire floor area, in addition to other potential environmental reservoirs such as the water troughs. However, when this approach was performed monthly, it could be seen that this control measure is again not effective in reducing the standard prevalence. Therefore, given the amount of work required to carry out this cleaning approach and the corresponding lack of success in prevalence reduction, this control measure could not be recommended if implemented at monthly intervals. Implementing this second cleaning approach on a weekly basis results in a marked reduction in the herd prevalence. Comparing the mean number of shedding animals for the scenarios with no cleaning and a weekly clearout, over the 96 days from day 30 to the end of the study, and controlling the false discovery rate to equal 5%, the mean numbers in the two groups are statistically significantly different on each of the 96 days, in each case the group subject to a weekly clearout having the lower mean prevalence. The decrease, as expected, is even greater than that associated with weekly cleaning of water troughs, with the mean control prevalence being cut to less than half the level of the standard prevalence, at all points in time. However, comparing the mean number of shedding animals for the scenarios with a weekly water cleaning and a weekly clearout, at no single time-point is there any evidence of any statistically significant differences between the groups.
The similarity of the results obtained from the two different cleaning approaches suggests that the important factor, with regard to controlling the infection, is the frequency at which these potential control measures are implemented. This seems sensible since even if a particular cleaning event is successful in removing every single bacterium existing within the environment of a herd, if infected animals are present within the herd, there remains a significant potential for bacteria to be shed by these animals, resulting in a rapid recontamination of the environment.
Nevertheless, the stringency of the cleaning approach also influences the size of the effect on the prevalence, but while the optimal hygiene-based control strategy involves the thorough cleaning of the entire environment of the herd, the results are similar to those from the alternative strategy. A strategy which concentrates effort on removing contamination from key environmental reservoirs, on a more frequent basis may present the optimal balance of costs and benefits.
Vaccination
The simulation model can also be used to consider the potential effects of hypothetical control measures currently in development. One such control measure is vaccination. Although several groups are known to be working on E. coli O157 vaccines for cattle, the most recent developments in this area involve the identification of viable candidate strains [Reference Dean-Nystrom32], and hence, an effective cattle vaccine is not yet available. Nevertheless, the within-herd simulation model can be used to quantify the likely effect of vaccination in reducing the level of infection within a herd.
To model this hypothetical scenario, it is necessary to determine the control mechanism operating for a typical vaccine. Ideally, vaccines are being sought which completely inhibit the growth of E. coli O157 in vivo. However, if such a vaccine was developed, this would result in the mathematically trivial situation in which any infection introduced into a herd would rapidly become extinct due to the effective removal of any bacteria which inadvertently entered the animals. A more realistic and interesting situation is the case where a vaccine is not entirely effective in inhibiting the colonization of E. coli O157. It is assumed that the ‘stifling’ effect of a vaccine would result in a reduced level of shedding, and therefore the model is used to investigate whether even a modest reduction in shedding could have an impact on the within-herd dynamics of the infection, as has been previously suggested by other authors [Reference Hancock31].
Since vaccination is currently a purely hypothetical control measure, there is only limited information about the likely biological effects. Given that preliminary results from developmental vaccines indicate that a 60% reduction in shedding can be achieved [Reference Moxley33], it is decided to adopt the assumption of Jordan and colleagues [Reference Jordan34] that the concentration of bacteria in the faeces of vaccinated animals is likely to be half that of unvaccinated animals, in order to reparameterize the model.
The key modification that is required is an adjustment of the proportion of shedding animals that are likely to fall into each of the shedding categories illustrated in Table 1. Since the shedding duration typically decreases as the challenge level is reduced [Reference Besser19], the proportions were selected on the basis that a 60% reduction in shedding levels would ensure that no animals would shed for more than 1 month, as detailed in Table 2. When an animal becomes infected, the exact length of time for which it remains infected and thus sheds infected faecal pats is simulated using the algorithm outlined above in the Methods section, but using the parameters listed in Table 2.
Details of the proportions of animals that fall into each shedding pattern following vaccination
The lower concentrations of bacteria likely to be found in faeces following vaccination is likely to also have an effect on two other parameters. First, the additional length of time for which an infected animal remained infected following a re-infection event is reduced from 1 week to 100 h to reflect the lower challenge likely to be posed at the re-infection event. Second, the length of time for which an infected faecal pat remains viable in the environment is also reduced from 720 h to 360 h, since pats containing lower concentrations of bacteria have shorter ‘survival’ times [Reference Himathingkham35]. These reparameterizations involve an implicit assumption that the decay in infectivity is broadly linear with respect to time. This is a strong assumption, but no data are available to justify any more realistic but complex model relating shedding levels to ‘survival’ times.
Prophylactic use
The simulation model is used to assess the effects of vaccination under two different scenarios. The first scenario, labelled ‘A’, involves an infection entering a herd of vaccinated animals. It is assumed that the source of the infection was a bought-in infected cow, which is vaccinated on arrival. Hence, this scenario considers the effect of a vaccine when used as a prophylactic.
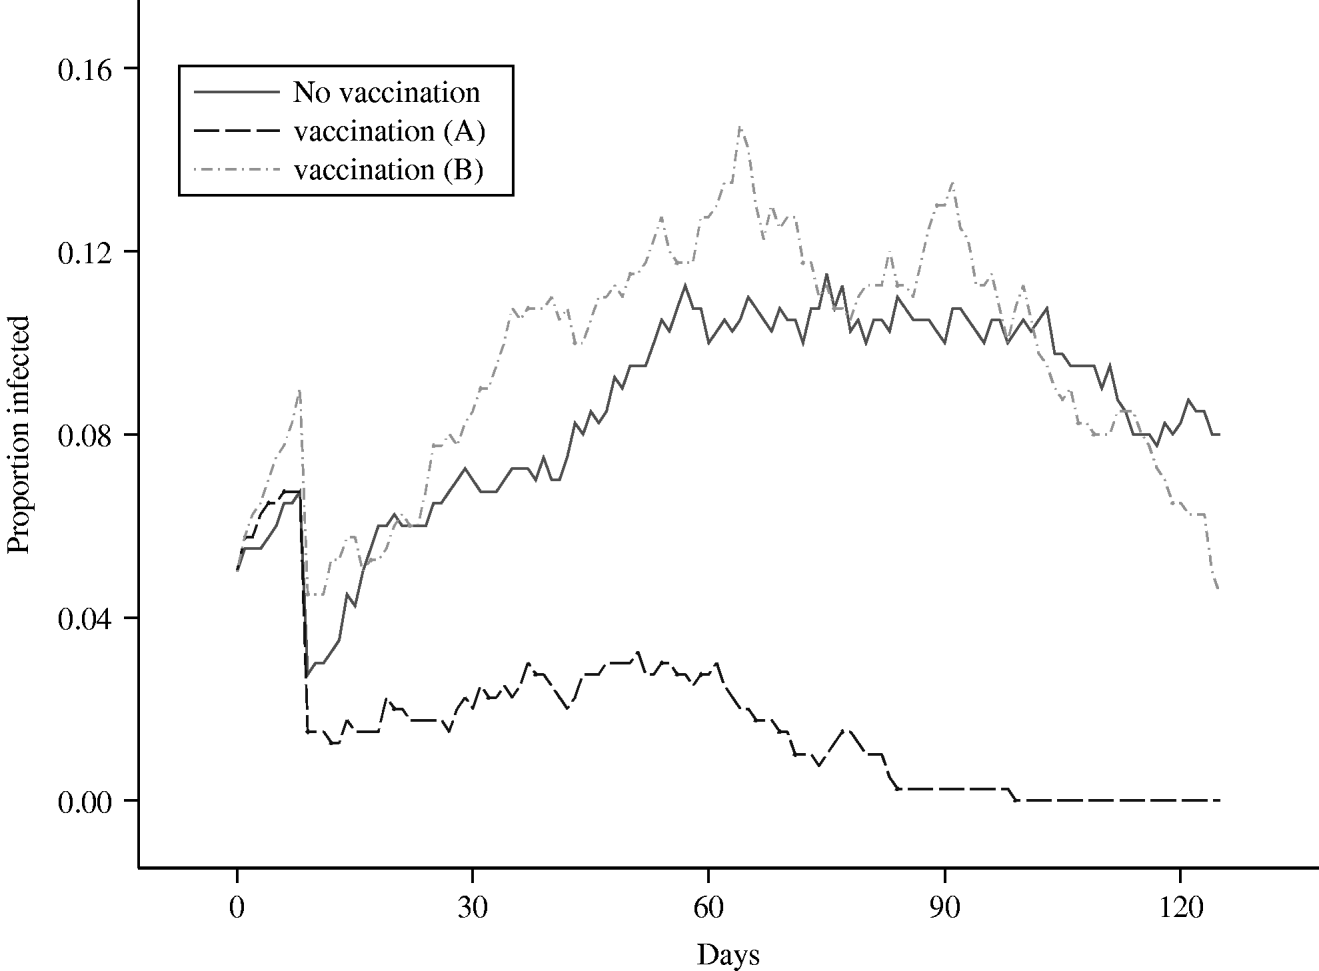
The results from this scenario can be seen in Figure 6, where the mean prevalence in the herd, averaged over 50 runs, is plotted against time and can be compared against the equivalent mean for the standard grazing model, in which no control measures are imposed. Clearly, vaccination has a dramatic effect in controlling the spread and eradicating the infection, as the maximum mean level of infection within the herd, following the initial drop-off, never exceeds 3%. Comparing the mean number of shedding animals for the scenarios with no vaccination and vaccination scenario ‘A’, over 96 days from day 30 to the end of the study, controlling the false discovery rate to equal 5%, the mean numbers in the two groups are statistically significantly different on 91 of the days, in each case the group subject to vaccination having the lower mean prevalence. The failure of the proportion of secondary infections in a herd of size 20 to exceed 0·05 indicates that, in this scenario, vaccination will allow the farmer to maintain an R 0 that lies <1, where R 0 can be defined as the average number of secondary cases that are produced in a completely susceptible population by one infected individual [Reference Anderson and May36]. It can also be inferred that infection was eradicated from the herd in every realization which contributes to the mean within 3 months of the infection having been introduced. In the majority of the realizations, the length of time to extinction was considerably shorter.
Comparison of the mean proportion of a herd of size 20 that is infected, over time, under two different vaccination scenarios.
Post-outbreak control use
The second vaccination scenario, labelled as ‘B’, considers the situation where infection enters a herd and is able to spread between the animals until it is detected, at which point the entire herd is vaccinated. In order to investigate such a scenario, it was necessary to run the simulation model using the standard grazing model parameters initially, and then switch to the vaccination parameters at the time-point at which vaccination of the herd was assumed to occur. It was decided to assess the effect of administering vaccination 60 days following initial infection, since at this point the herd prevalence in the standard model has reached its maximum, and therefore is within the typical range in which vaccination, if used as a control measure, would be implemented. Besides which, given that in this scenario vaccination is used as a control measure, the higher the prevalence the more likely the infection is to be detected. This is therefore also the time-point associated with the highest probability of detection.
The results obtained from this simulation exercise can again be seen in Figure 6, where the mean infected proportion of the herd, averaged over 50 runs, has been plotted over time. The first half of this plot is very similar to that of the standard grazing scenario, since they represent mean proportions obtained from exactly the same process, as identical parameters were used. It is interesting to note that the stochastic effects cause the mean values to vary by up to 4% at any particular time-point. This difference could be reduced by increasing the number of runs contributing to each mean, although the number of runs was restricted to 50 for each scenario due to the considerable amount of CPU time involved in running such a complex program. Nevertheless, the mean generated from the vaccination ‘B’ scenario generally lies within 1 standard error of the mean derived from the standard, no-controls, scenario over the relevant initial 60-day period. Indeed, comparing the scenarios with no vaccination and vaccination scenario ‘B’, at no single time-point is there ever any evidence of any statistically significant differences between the groups.
Looking at the latter half of the plot, the effects of vaccination can be clearly observed; in the standard grazing scenario, the maximum decrease in prevalence over the second 60-day period is 3%, while the maximum decrease in the vaccination ‘B’ scenario, over the same time-period, is 11%. This is reflected in the P values, which are latterly dropping rapidly and could be taken as evidence of an increasing divergence between the two sets of scenarios. Indeed, if the decline of the mean herd prevalence continued at the same rate in the vaccination realizations, it is possible that extinction of the infection could be achieved within one further month. By contrast, there is no evidence to suggest that infection extinction will occur in the immediate future in the unvaccinated realizations.
DISCUSSION
A simulation model of a herd of cattle that takes into account the location of the animals and environmental contamination has been developed in order to investigate the infection dynamics of E. coli O157. The model is flexible and can be applied to a wide range of management scenarios or even adapted for other pathogens. However, the key interest in developing this model has been to assess the efficacy of potential control measures.
One such measure is a restriction in the size of herds. In particular, the model is used to investigate the existence of a threshold for infection persistence and demonstrates that the level of infection and the overall duration for which a herd is infected can be reduced by decreasing the number of animals that are grouped together. However, for practical reasons, farmers are unlikely to split their animals up into groups of say, 10 or fewer animals. Indeed, while the average group size in a recent survey, which sampled groups containing animals about to enter the human food chain, was found to be approximately 20 animals [Reference Synge2], herds on dairy farms can easily exceed 100 animals [37]. Since infection with E. coli O157 does not appear to affect the health and productivity of cattle, the considerable extra work imposed on farmers in having to manage several smaller groups instead of one large one would not be rewarded by significant economic benefits. Furthermore, there is some evidence in the literature of studies where the results appear to contradict those obtained in this section. For example, Wilson et al. [Reference Wilson38] and Hancock et al. [Reference Hancock39] both found that herds which contained at least one infected animal tended to be smaller than non-infected herds.
The full explanation for these contradictory results is unknown, although there are a variety of possible reasons. Leaving aside the possibility that the model does not fully describe the infection dynamics, there may be aspects of farm management practice which could explain the discrepancy in results and which are confounded with group size. For instance, on larger, more commercial farms, it is possible that a greater emphasis is put on hygiene, and the cleaner conditions allow infection to be controlled. There may also exist other possible explanations, but it is clear that restriction of herd size alone is probably not a serious candidate for use as the main control measure on farms.
Another control strategy that could currently be implemented is niche engineering, where the environment is managed to minimize the presence of bacteria by, for instance, maintaining strict control over feeding and bedding, chlorinating water supplies and cleaning water troughs. Such measures are evaluated for both grazing and housed scenarios, with particular emphasis being placed on the cleaning of water troughs.
The simulation model demonstrates that frequent cleaning of certain key areas could control the level of infection due to the resulting slow rate of infection spread through the herd, and the correspondingly reduced number of animals infected overall. Given that many grid-squares probably become re-infected prior to the next cleaning event, the key to success is in minimizing the length of time for which more ‘attractive’ grid-squares, such as those which contain water and feed supplies, remain infected. Therefore, it is anticipated that the shorter the interval between cleaning events, the higher the level of control that can be achieved. Obviously, diminishing returns will exist, and it is likely that an optimal strategy would involve cleaning ‘attractive’ grid-squares at a frequency such that the consequent risk of infection that they pose to animals is reduced to a level which is equivalent to that posed by ‘ordinary’ grid-squares.
One possible improvement that could be made to the simulation model, with a particular impact on assessing the efficacy of the cleaning strategies defined above, would be to attempt to separate the risk of infection transmission from the grid-square in which a particular water trough is located from that of the water trough itself, i.e. model the water trough as a separate entity from the immediate vicinity. This has not been done in this model because, although the mechanisms of transmission both to and from the water trough are believed to have been established, there is a dearth of information available quantifying how often such transmission events might occur, and crucially, the concentrations of bacteria involved. The results of LeJeune et al. [Reference LeJeune, Besser and Hancock27], discussed above, suggest that E. coli O157 bacteria have an ability to survive in water for longer than if the organisms were contained in faecal pats or in soil. Therefore, the presence of a longer-term bacterial reservoir in an area inhabited by cattle would be expected to increase the prevalence of infection within the standard, no-controls, grazing scenario. Thus, implementing any measure, such as the cleaning strategy outlined in the Niche engineering section above, which, even temporarily, eliminates the risk from such reservoirs is likely to result in an even greater beneficial effect on infection levels than has been demonstrated with the existing model.
An advantage of mathematical modelling is that, despite the fact that a suitable vaccine remains to be fully developed, the potential efficacy can be assessed by making plausible assumptions regarding the likely biological effect. While the results indicate that the use of vaccination as a prophylactic would be very successful in restricting the spread of the infection, given the costs involved in mass vaccination, this control measure is unlikely to be introduced voluntarily. Hence, a scenario in which vaccination is used as a treatment to reducing the prevalence in highly infected herds is also considered. Again, the results suggest that vaccination could be a very effective means of reducing even high prevalences. These results were generated assuming that the vaccine involved had the ability to reduce the proportion of long-term shedders to zero, and (through reducing bacterial shedding levels by 60%) approximately reduce by 50% the time for which faecal pats are infective. However, it is possible that vaccines could be developed with even greater capacities to inhibit the growth of E. coli O157, in which case the effects would be even stronger. Nevertheless, on the basis of these results, it can be concluded that the use of a vaccination programme shows great potential as a control measure. Further research in this area should be strongly encouraged. However, it is worth noting that the implementation of a vaccination scheme, even if restricted in use only to herds with high prevalences, is likely to be exceedingly costly, given that the farmer will receive no economic benefit from the exercise.
CONCLUSIONS
We have found that vaccination and targeted cleaning of the local environment are particularly effective strategies in reducing levels of infection within a group of cattle. However, the list of control measures evaluated by the simulation model is not exhaustive. There are many other possible measures including the control of contact between calves and cows, the choice of communal housing used and manure management [Reference Rahn22]. In fact, it is likely that the most successful strategy will involve the implementation of a combination of several measures. The model described in this paper could potentially have an impact on the decision-making process involved in the selection of an appropriate control strategy, and may be of particular use in evaluating the effect of combinations of different strategies within an integrated control policy.
ACKNOWLEDGEMENTS
J.C.W. gratefully acknowledges the support of a BBSRC studentship. I.J.M. acknowledges support from the Scottish Executive Environment and Rural Affairs Department, project BSS/028/99 and the Wellcome Trust International Partnership Research Award for Veterinary Epidemiology.
DECLARATION OF INTEREST
None.



