





Introduction
The South Shetland Islands (SSI) are located about 160 km north of the Antarctic Peninsula, where the main islands stretch around 230 km in length and less than 35 km in width (Fig. 1). These islands are extensively covered by ice caps and permanent snowfields, although some peninsulas are ice-free (John and Sugden, Reference John and Sugden1971; Watcham et al., Reference Watcham, Bentley, Hodgson, Roberts, Fretwell, Lloyd and Larter2011). Most of the coastlines of these ice-free areas exhibit sets of prominent raised beach ridges that reach up to 20 m in elevation (Fretwell et al., Reference Fretwell, Hodgson, Watcham, Bentley and Roberts2010). The formation of these features is attributed to postglacial rebound following the last glacial maximum (LGM) deglaciation (John and Sugden, Reference John and Sugden1971; Sugden and John, Reference Sugden, John and van Zinderen Bakker1973; Bentley et al., Reference Bentley, Hodgson, Smith and Cox2005; Fretwell et al., Reference Fretwell, Hodgson, Watcham, Bentley and Roberts2010; Hall, Reference Hall2010; Watcham et al., Reference Watcham, Bentley, Hodgson, Roberts, Fretwell, Lloyd and Larter2011; Simms et al., Reference Simms, Ivins, DeWitt, Kouremenos and Simkins2012). This uplift reflects glacial isostatic adjustment (GIA), the response of the solid Earth to ice mass loss. If isostatic uplift outpaces eustatic sea-level rise, then relative sea level (RSL) falls, creating sets of raised marine shorelines around the Antarctic Peninsula (John and Sugden, Reference John and Sugden1971). These features are particularly well developed in the SSI and provide valuable archives of postglacial ice loss, crustal uplift, and the spatial variability of GIA across the northern Antarctic Peninsula region.
Modern uplift rates around the Antarctic Peninsula increased shortly after the collapse of the Larsen B ice shelf in 2002 (Thomas et al., Reference Thomas, King, Bentley, Whitehouse, Penna, Williams and Riva2011; Nield et al., Reference Nield, Barletta, Bordoni, King, Whitehouse, Clarke, Domack, Scambos and Berthier2014, Reference Nield, King, Koulali and Samrat2023). The resulting elastic response was recorded in GPS-derived uplift rates across the Antarctic Peninsula, such as at Palmer Station, where GPS velocities increased from 0.1 mm/yr to 8.8 mm/yr after the collapse of the ice shelf (Thomas et al., Reference Thomas, King, Bentley, Whitehouse, Penna, Williams and Riva2011). However, elastic response alone could not explain GPS observations; therefore, Nield et al. (Reference Nield, Barletta, Bordoni, King, Whitehouse, Clarke, Domack, Scambos and Berthier2014, Reference Nield, King, Koulali and Samrat2023) invoked a viscoelastic response of a low upper mantle viscosity within the Antarctic Peninsula to account for such a large increase in uplift rate.
The role of co-seismic uplift across the Antarctic Peninsula is still a matter of discussion. Starting in August 2020, a series of earthquakes occurred offshore of King George Island (KGI) (Fig. 1B), within the Bransfield Strait, with the largest reported earthquake having a magnitude of Mw 6.0 on November 6, 2020 (Olivet et al., Reference Olivet, Bettucci, Castro-Artola, Castro, Rodríguez and Latorres2021; Cesca et al., Reference Cesca, Sugan, Rudzinski, Vajedian, Niemz, Plank and Petersen2022). The epicenters were concentrated around the Orca seamount, an ∼900 m seafloor volcano previously thought inactive, where magma intrusion in the active rifting environment of the Bransfield Strait is thought to be responsible for these earthquakes (Olivet et al., Reference Olivet, Bettucci, Castro-Artola, Castro, Rodríguez and Latorres2021). Additionally, geodetic observations reported up to 10.7 cm of northwestward displacement across KGI as well as 1.3 cm of associated uplift during these earthquakes (Cesca et al., Reference Cesca, Sugan, Rudzinski, Vajedian, Niemz, Plank and Petersen2022). Slower tectonic processes can also drive long-term uplift and the generation of marine terraces across the globe (Malatesta et al., Reference Malatesta, Finnegan, Huppert and Carreño2022), as wave-cut surfaces are preserved above water once the land rises and RSL falls. Several marine terrace sequences preserved across the SSI are thought to be the result of similar long-term uplift (Pallàs et al., Reference Pallàs, James, Sàbat, Vilaplana, Grant and Ricci1997).
Reconstructing RSL changes in remote regions like Antarctica is critical for improving our understanding of past ice loading/unloading as well as rates of tectonic deformation. Although Antarctica is a vast, remote continent, previous efforts have been made to constrain its glacial history and past RSL changes,
(A) Location of the Antarctic Peninsula, with polar projection map on upper left corner, and the islands in the northwestern Weddell Sea (James Ross Island, Beak Island, and Joinville Island) as well as the South Shetland Islands (SSI) on the northern tip. (B) Location of the SSI and the limit of the Antarctic Plate and the Shetland Plate, as well as isobases of uplift (from 2 to 18 m) predicted to have occurred since the formation of the highest Holocene beach, adapted from Fretwell et al. (Reference Fretwell, Hodgson, Watcham, Bentley and Roberts2010). (C) Location of Nelson Island and study site: Duthoit Point. Colored circles indicate location and type of relative sea-level (RSL) record across the SSI, with full description in the legend.

Figure 1 Long description
A) Map of the Antarctic Peninsula and surrounding regions, including the South Shetland Islands, Joinville Island, Beak Island, James Ross Island and the former Larsen B Ice Shelf. The map shows the Bellingshausen Sea, Weddell Sea, and Bransfield Strait. B) Detailed map of the South Shetland Islands, including King George I., Robert I., Nelson I., Livingston I., Greenwich I., Snow I. and Deception I. Isobases of uplift are marked from 2 to 18 meters, indicating postglacial rebound. The map includes tectonic boundaries of the Shetland Plate and Antarctic Plate. C) Map of Nelson Island, highlighting Maxwell Bay, Fildes Strait, Rip Point and Duthoit Point. The legend indicates relative sea-level records with symbols for isolation basins, radiocarbon, and optically stimulated luminescence on cobbles.
particularly around the SSI (Fig. 1B). Most RSL reconstructions around the Antarctic Peninsula are derived from either radiocarbon dating of organic remains within the raised beaches at known elevations (Sugden and John, Reference Sugden, John and van Zinderen Bakker1973; Hansom, Reference Hansom1979; Curl, Reference Curl1980; Barsch and Mäusbacher, Reference Barsch and Mäusbacher1986; Tatur et al., Reference Tatur, Myrcha and Niegodzisz1997; Del Valle et al., Reference Del Valle, Montalti and Inbar2002; Bentley et al., Reference Bentley, Hodgson, Smith and Cox2005; Hall, Reference Hall2010; Lindhorst and Schutter, Reference Lindhorst and Schutter2014; Heredia Barión et al., Reference Heredia Barión, Lindhorst, Schutter, Falk and Kuhn2019; Emslie et al., Reference Emslie, Romero, Juáres and Argota2020; Zurbuchen and Simms, Reference Zurbuchen and Simms2019), optically stimulated luminescence (OSL) on cobbles from the beach ridges (Simms et al., Reference Simms, DeWitt, Kouremenos and Drewry2011a, Reference Simms, Ivins, DeWitt, Kouremenos and Simkins2012, Reference Simms, Whitehouse, Simkins, Nield, DeWitt and Bentley2018; Gernant et al., Reference Gernant, Simms, DeWitt, Theilen, Garcia and Goebel2025; Yıldırım et al., Reference Yıldırım, Çiner, Sarıkaya and Hidy2024), or sediment cores from isolation basins bracketing the transition from marine to freshwater conditions (Mäusbacher et al., Reference Mäusbacher, Müller and Schmidt1989; Yoon et al., Reference Yoon, Khim, Lee, Park and Yoo2006; Watcham et al., Reference Watcham, Bentley, Hodgson, Roberts, Fretwell, Lloyd and Larter2011).
Despite these efforts, questions remain as to the nature and timing of RSL changes across the SSI, particularly whether the elevation of raised beaches and their reconstructed RSL patterns are driven solely by ice unloading since the LGM or the result of co-seismic uplift (Sugden and John, Reference Sugden, John and van Zinderen Bakker1973; Pallàs et al., Reference Pallàs, James, Sàbat, Vilaplana, Grant and Ricci1997; Fretwell et al., Reference Fretwell, Hodgson, Watcham, Bentley and Roberts2010; Watcham et al., Reference Watcham, Bentley, Hodgson, Roberts, Fretwell, Lloyd and Larter2011; Gernant et al., Reference Gernant, Simms, DeWitt, Theilen, Garcia and Goebel2025). To address this question, we examine a set of raised beaches around Bransfield Strait (Fig. 1C), where both recently reported seismicity and rapid ice retreat indicate the potential influence of tectonic and glacial processes. We provide new imagery, elevation surveys, and radiocarbon ages from these beaches to examine their morphology and age with respect to other beaches in the SSI and the local record of glacial history.
Site description—Nelson Island
Nelson Island is located in the central-eastern SSI. It is separated from KGI by the Fildes Strait to the north and Maxwell Bay to the east, and from Robert Island by the Nelson Strait (Fig. 1C). Additionally, the Bransfield Strait separates Nelson Island from the Antarctic Peninsula. The rocks on the island are characterized by late Cretaceous and early Tertiary microgabbro and andesitic intrusions, basaltic lavas, lapillistones, and tuff, as well as agglomerates with rare mudstones (Smellie et al., Reference Smellie, Pankhurst, Thomson and Davies1984). The total land area of Nelson Island is about 165 km2, of which ∼8 km2 is ice-free (Rodrigues et al., Reference Rodrigues, Oliveira, Schaefer, Leite, Gauzzi, Bockheim and Putzke2019).
Harmony Point and Duthoit Point (Figs. 1C and 2) constitute the largest ice-free regions of the island, although other minor coastal areas, such as Rip Point, are also ice-free. Rodrigues et al. (Reference Rodrigues, Oliveira, Schaefer, Leite, Gauzzi, Bockheim and Putzke2019, Reference Rodrigues, de Oliveira, Schaefer, Leite and Pavinato2021) divided these ice-free landscapes into two different units: (1) the coastal domain containing three levels of marine terraces and (2) an upper platform dominated by cryoplanated surfaces, patterned ground, and debris slopes.
(A) Uncrewed aerial vehicle (UAV)-derived orthomosaic of Duthoit Point in Nelson Island showing the different raised beaches (i.e., upper, intermediate, and lower beaches). (B) View of lower beaches on land, including the present-day beach (PDB), as well as the glacial deposits. (C) Panoramic view from the SE looking toward the north at Duthoit Point.

Figure 2 Long description
A) Orthomosaic of Duthoit Point, Nelson Island, displaying different raised beaches labeled as upper, intermediate, and lower beaches. The map includes a scale bar indicating 100 meters. B) View of lower beaches on land, highlighting glacial deposits and the present-day beach (PDB). C) Panoramic view from the southeast looking north at Duthoit Point, showing upper beaches and lower beaches along the coastline. Snow-covered terrain and rocky formations are visible.
The largest portion of the island is occupied by an ice cap, remnant of a larger ice cap that covered the SSI during the LGM (Pallàs et al., Reference Pallàs, Vilaplana and Sàbat1995, Reference Pallàs, James, Sàbat, Vilaplana, Grant and Ricci1997; Fretwell et al., Reference Fretwell, Hodgson, Watcham, Bentley and Roberts2010; Simms et al., Reference Simms, Milliken, Anderson and Wellner2011b). The summit of this remnant ice cap reached an elevation of 324.6 m above sea level (m asl) in 1995 (Jiawen et al., Reference Jiawen, Dahe, Petit, Jouzel, Wenti, Chen and Xiaojun1995).
Methods
Fieldwork
We visited Duthoit Point (Figs. 1C and 2), Nelson Island, during the austral summer of 2021 to conduct a comprehensive topographic survey of the raised beach ridges. We employed an uncrewed aerial vehicle (UAV, DJI Phantom 3 Pro) to image the study area. Moreover, we measured beach elevations with a Trimble differential GPS (dGPS) in kinematic mode by surveying the crest of each ridge with the GPS. We also measured local ground control points (GCP) for further aerophotogrammetry processing. All global navigation satellite system (GNSS) data were obtained with a frequency of measurement of 5 s. To determine the age of beach formation, we sampled organic remains of marine organisms (n = 6), such as fragmented shells and seaweed, from within the beach ridge for radiocarbon dating. We collected the samples 20–30 cm deep in hand-dug pits and thus treat them as maximum-limiting ages of beach formation (Bentley et al., Reference Bentley, Hodgson, Smith and Cox2005; Hall, Reference Hall2010).
Topographic data processing
We employed aerophotogrammetry software (Agisoft PhotoScan 1.2.7) to analyze UAV imagery and derive orthomosaics as well as a digital elevation model (DEM) of the study area. All images were aligned, and GCPs were used to correct differences in measured elevation and flight height. After optimizing the camera parameters, we produced the DEM and orthomosaic, following the creation of a dense cloud of points derived from the photos. Differences in elevation were later corrected in QGIS through raster subtraction. Furthermore, dGPS measurements collected in the study area were corrected using Trimble software and observations from the permanent reference station at the Argentinian station, Carlini Station (DAL5), located 13 km away from the study area. The DAL5 reference station is located at 62.2407°S, 58.6782°W and has an ellipsoidal height of 44.18 m (WGS84), an orthometric height of 22.37 m (EGM2008), and a magnetic declination of 10.5°E (Zakrajsek, A., personal communication, 2021).
To convert our corrected measurements to mean sea level, we subtracted the offset of the GPS-derived local water height and the water height at the time of survey using a tide gauge located on Harmony Point deployed by the Argentinian Navy (Servicio de Hidrografía Naval) approximately 18 km west of Duthoit Point (Fig. 1C). This conversion resulted in an ∼10 cm correction, which agrees with previous estimates of a geoid height of zero used to correct to mean sea level in nearby regions (e.g., Potter Peninsula; Lindhorst and Schutter, Reference Lindhorst and Schutter2014). This correction is within the errors of the surveying method. Therefore, we report elevations with reference to mean sea level (m) for our topographic analysis (Table 1). Additionally, as a reference frame, we used the mean elevation of the present-day beach (PDB) as the indicative meaning of our raised beaches. Thus, past RSL was calculated by subtracting the elevation of the PDB from the elevation of the raised beaches (Table 1). The PDB is found at an elevation of 1.54 ± 0.62 m in our site, similar to the commonly assumed ∼2 m around the SSI (Fretwell et al., Reference Fretwell, Hodgson, Watcham, Bentley and Roberts2010), with values of 1.5 m around Maxwell Bay (Watcham et al., Reference Watcham, Bentley, Hodgson, Roberts, Fretwell, Lloyd and Larter2011) and 1.65 m on Livingston Island (Gernant et al., Reference Gernant, Simms, DeWitt, Theilen, Garcia and Goebel2025). The elevations and associated standard deviations (1σ) reported for the beaches represent the arithmetic mean of the elevations measured along the beach crest from all available surveying methods (i.e., UAV, dGPS) as well as local dGPS points measured on the beach ridges. GCPs used in the UAV processing were surveyed using a dGPS and corrected using observations from the DAL5 reference station. We base our topographic analysis primarily on the UAV-derived DEM, as it provides spatially continuous elevation data across the study area, whereas the dGPS measurements are limited to discrete locations. DEM elevations were cross-checked against dGPS observations and showed agreement within the uncertainty of the surveying methods (Table 1).
Elevation distribution of surveyed raised beaches in Duthoit Point, Nelson Island, South Shetland Islands, Antarctica, and its associated error according to the surveying method.a

Table 1 Long description
Raised-beach crest elevations are listed by beach ID using two surveying methods, DEM and dGPS, with reported measurement errors and corrected elevations relative to the present-day beach baseline. Raw elevations increase from the present-day beach at 1.54 m up to the highest raised beach, ID 12, at 16.13 m by DEM and 16.51 m by dGPS. After correction, elevations range from 0.00 m at the present-day beach to 14.59 m by DEM and 14.97 m by dGPS at ID 12. Across IDs with both methods, dGPS values are usually slightly higher than DEM. DEM error is constant at 0.14 m for all entries, while dGPS error varies from 0.30 to 0.69 m where available. Corrected elevations preserve the same ordering as raw elevations because all raised beaches are adjusted by the same baseline offset.
a The elevation in meters (m) results from the arithmetic mean of the elevations measured along the beach crest using the different surveying methods. n/a denotes not available. We report the elevations corrected relative to the present-day beach (PDB) for both methods by subtracting this value (1.54 ± 0.62 m) from the elevation of the raised beaches. DEM, digital elevation model; dGPS, differential GPS.
Radiocarbon results from samples collected from within the raised beaches of Duthoit Point and their corresponding location and elevation.a

Table 2 Long description
Radiocarbon results for six samples from raised beach ridges list coordinates, measured and corrected elevations, material type, laboratory identifiers, radiocarbon ages with errors, and calibrated age ranges with median calibrated ages. Corrected elevations span 3.23 to 11.33 m, with the highest ridge (Beach 10, shells) yielding the oldest median calibrated age, about 4760 years BP, and a calibrated range from about 4390 to 5170 years BP. Lower ridges (Beaches 3 to 6, mostly seaweed) cluster near corrected elevations of 3.23 to 5.72 m and have much younger median calibrated ages, about 500 to 540 years BP, with ranges roughly 220 to 810 years BP. Two seaweed samples from the same ridge and location (Beach 5) differ notably: NI-B5a has a median about 145 years BP, while NI-B5b is about 500 years BP, indicating variability among replicate materials from one ridge. Overall, the data suggest older ages at higher corrected elevations, with some within-ridge scatter and uncertainty reflected in the calibrated error ranges.
a Results are reported in calibrated years before present (BP) using the median probability and the average of the 2σ range of the corrected error, employing a marine radiocarbon reservoir (ΔR) of 443 ± 135 (Divola et al., Reference Divola, Simms, Sremba, Baker, Friedlaender and Southon2024). The location is reported in decimal degrees, and the elevation is derived from the arithmetic mean of the measurements along each beach ridge using the DEM as well as the corrected elevation relative to the present-day beach (PDB).
Data compilation and radiocarbon dating
We compiled existing RSL records (radiocarbon- and OSL-dated beaches and isolation basins) located along the same isobase of uplift as Nelson Island (between 14 and 16 m) as computed by Fretwell et al. (Reference Fretwell, Hodgson, Watcham, Bentley and Roberts2010; Fig. 1B). This allowed us to compare surrounding regions of the SSI with similar magnitudes of Holocene uplift. We processed new radiocarbon samples at the Keck Carbon Cycle AMS facility at the University of California Irvine, where they were treated with acid-base-acid (1 N HCl and 1 N NaOH, 75°C) before combustion. All results have been corrected for isotopic fractionation according to the conventions of Stuiver and Polach (Reference Stuiver and Polach1977), with δ13C values measured on prepared graphite using the AMS spectrometer.
We calibrated the new and existing marine samples (e.g., seaweed, shells, whale bones, and marine organic sediment) using CALIB 8.2 (Stuiver et al., Reference Stuiver, Reimer and Reimer2021) with the MARINE20 calibration curve (https://www.calib.org/marine/; Heaton et al., Reference Heaton, Köhler, Butzin, Bard, Reimer, Austin and Bronk Ramsey2020), employing a marine radiocarbon reservoir (ΔR) of 443 ± 135 derived from whale bones collected around the Antarctic Peninsula and the SSI (Divola et al., Reference Divola, Simms, Sremba, Baker, Friedlaender and Southon2024) and nonmarine samples with SHCal20 (Hogg et al., Reference Hogg, Heaton, Hua, Palmer, Turney, Southon and Bayliss2020). We explored an alternative ΔR (635 ± 42) derived by Hall et al. (Reference Hall, Henderson, Baroni and Kellogg2010) on solitary corals from the Ross Sea; however, this choice does not affect the reconstructed RSL curve or our conclusions regarding the timing of ice advance. Both compiled radiocarbon as well as newly obtained radiocarbon ages are reported as the median probability of the calibrated ages in years relative to 1950 CE (denoted as cal yr BP in the text) (Table 2).
Results
Topographic survey
Our detailed topographic analysis reveals three main sets of high-relief, prominent raised beaches, ∼100 m apart from each other. The modern and raised beaches strike in a NE–SW direction (Figs. 2 and 3A). The entire beach ridge complex ends abruptly landward, where it transitions into a nonmarine landscape. Hand-dug pits indicate all beaches consist of matrix-supported, well-sorted cobble to pebble-size basalts/andesites with occasional granitic cobbles (Fig. 4).
(A) Westward uncrewed aerial vehicle (UAV)-derived view of Duthoit Point with raised beaches highlighted across their crests. Glacial deposits east of beaches are indicated, partially overriding the lower beaches. (B) Along-crest survey of beach ridge elevations for the upper, intermediate, and lower beaches. Shading indicates the full vertical uncertainty envelope of approximately 14 cm derived from the digital elevation model (DEM)-based measurements of the beach ridges.

Figure 3 Long description
Annotated aerial view of a coastal area with a curved shoreline and adjacent land. Many beach ridges are marked with dashed crest lines and sequential labels that include “Beach 1” through “Beach 12.” A label reads “Glacial deposits.” Several circular markers appear and a legend label reads “Samples.” Line graph of multiple beach profiles. The x-axis label is “Easting (m)”. The y-axis label is “Elevation relative to PDB (m)”. Text on the plot groups the lines into “Upper beaches,” “Intermediate beaches,” and “Lower beaches.” Across the plotted easting range, the “Upper beaches” lines occupy the highest elevations, clustered around the 10 to 14 range on the y-axis. The “Intermediate beaches” lines occupy mid elevations, around the 6 to 8 range on the y-axis. The “Lower beaches” lines occupy the lowest elevations, around the 0 to 6 range on the y-axis, with several lines sloping downward as easting increases. Together, the aerial view provides the labeled beach ridge locations and sample markers and the line graph provides the elevation profiles for the labeled beach groups across easting.
Field photos of Duthoit Point on Nelson Island and beach sedimentology. (A) View of several hand-dug pits carried out along the ridge of Beach 6 (lower beaches) with a person for scale (middle right). (B) Surface material (cobbles and sandy matrix) of the lower beaches along with whale bones on the surface. (C and D) Cobbles, pebbles, and sandy matrix that constitute the beaches. Material collected from within the raised beaches is indicated in the pictures, with Beach 10 material in C and Beach 3 in D.

Each beach set consists of several (2–7) beaches clustered within the same elevation range (Fig. 3B). The upper beaches (Beaches 10 to 12; Table 1) are confined to elevations ranging between 16.1 and 12.9 m, that is, 14.6 and 11.3 m above the PDB, with three distinct beach ridges developed within this ∼3 m elevation range. The elevation of the higher set of beach ridges coincides with the highest beach ridge set at other locations within the same isobase (e.g., 16–14 m; Fretwell et al., Reference Fretwell, Hodgson, Watcham, Bentley and Roberts2010).
The intermediate beaches comprise two distinct ridges (Beaches 9 and 8; Table 1) along an altitudinal range of about 9.2–7.9 m, that is, 7.6–6.4 m above the PDB. Additionally, a larger cluster (n = 7, Beaches 7 to 1) of raised beaches is found at elevations ranging from 7.3 to 3.1 m, that is, 5.7–1.6 m above the PDB, comprising the lower beaches (Table 1). This lower beach domain is developed at lower elevations on the east compared with its western edge (Fig. 3B). The mean elevation of the PDB above modern high tide is found along the shore at ∼1.54 ± 0.62 m (Table 1).
Notably, variability in crest elevation observed along individual beach ridges, including the present-day beach, provides important insight into the precision with which raised beaches can be measured. Individual crests vary by more than 1 m over distances of a few hundred meters, highlighting the inherent geomorphic variability of these features (Fig. 3B).
Overall, the beaches do not exhibit signs of bioturbation along their crests, as penguin rookeries and/or sea lion colonies are concentrated along other shorelines or ice-free areas of the island (e.g., Harmony Point). Moreover, beaches lack vegetation and do not appear to be heavily impacted by postdepositional processes, such as fluvial incision. Other than a few signs of frost-shattering, periglacial patterned ground formation is absent within the raised beaches. Angular to subangular boulders of ∼0.5 m are found on the surface of the beaches, predominantly on the eastern portions of the ridges, likely due to their proximity to the talus slope.
In addition to the raised coastal landscape, glacial deposits are found on the eastern side of Duthoit Point (Figs. 2B, 3A, 4A, and 5). These glacial deposits show that an ice advance partly overran the lower beaches (Beaches 7 to 1), with permanent snow patches and protalus ramparts now occupying some of the area formerly covered by ice advance. These glacial deposits crosscut and overrun the raised beaches, implying that they are younger than the beaches (Fig. 5).
Glacial deposits (dashed line) overrunning lower (6–4 m) beaches on Nelson Island. (A) Uncrewed aerial vehicle (UAV) photography taken toward the east showing the lower beaches and the glacial deposits. (B) Closer view of the glacial deposits overrunning the lower beaches. Elevation ∼50 m and distance to the glacial deposits ∼150 m.

Radiocarbon dating
Six new ages were obtained from the raised beaches on Nelson Island. The higher beaches only contained material for one radiocarbon age and thus provide limited constraints on the ages of these beaches. A single radiocarbon age was obtained from fragmented shells within Beach 10, which yielded an age of 4760 ± 390 cal yr BP (Table 2). However, the lower beaches (from Beach 6 to Beach 3) contained prevalent seaweed with four ages between 540 and 500 cal yr BP (Table 2). We replicated the dating of the same beach ridge using a fifth sample; however, the small mass of the organic material recovered resulted in a young limiting age that, when calibrated, yielded an almost modern age of 145 cal yr BP (Beach 5, sample NI-B5a). Assuming that age is an outlier, the rest of the ages overlap within uncertainties with a resulting mean of 520 ± 20 cal yr BP.
Data compilation
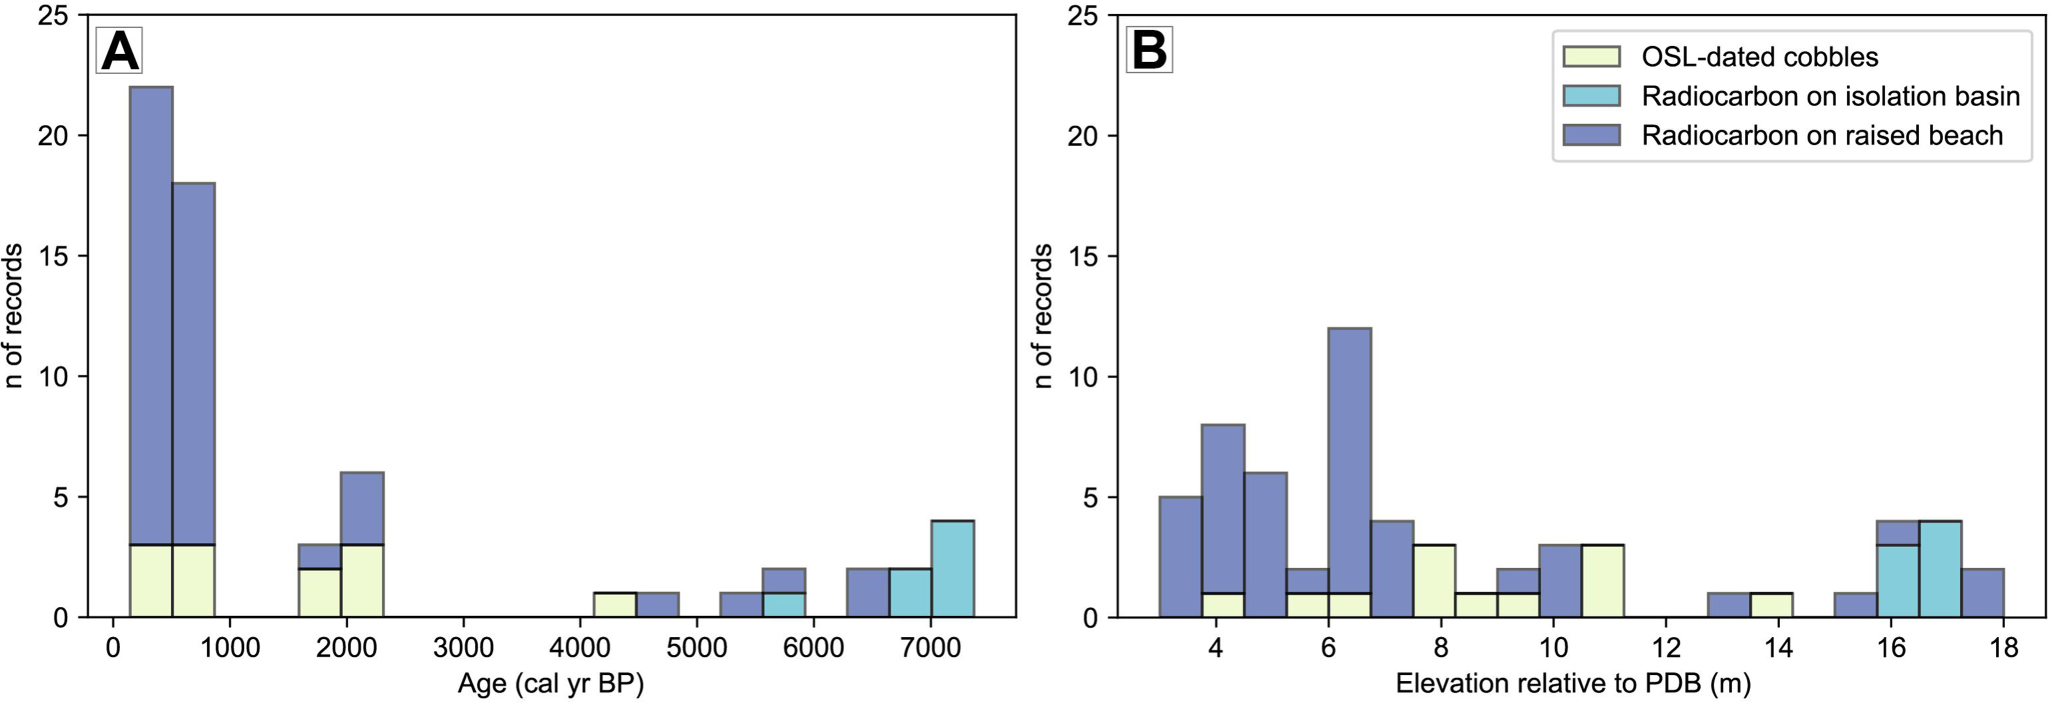
The RSL records compiled from previously published work are similar to our new results in that most dated beaches are at lower elevations (from 2.5 to 8 m) with ages abundant for the last millennium (Fig. 6). In contrast, higher-elevation beaches are constrained by fewer data points, resulting in more limited constraints on Early Holocene RSL. This uneven distribution of index points restricts our ability to resolve the spatial pattern of the Holocene marine transgression across the SSI, particularly as most isolation basin records are concentrated on Fildes Peninsula (Watcham et al., Reference Watcham, Bentley, Hodgson, Roberts, Fretwell, Lloyd and Larter2011).
Data compilation of dated relative sea-level (RSL) index points around the South Shetland Islands (SSI), including our results on Nelson Island. (A) Histogram of the age distribution of dated raised beaches in the SSI. (B) Histogram of the elevation distribution of dated beaches. Both histograms are classified according to the type of dating technique and/or archive.

Figure 6 Long description
Histogram A with a legend listing OSL-dated cobbles, Radiocarbon on isolation basin, and Radiocarbon on raised beaches. The x-axis label is Elevation relative to PDB (m). The y-axis label is n of records. Multiple bars overlap within the same elevation bins for the three legend categories. The tallest bar is near elevation 6, reaching about 12 records. Several bars between about 3 and 7 reach between about 2 and 8 records. Bars between about 8 and 11 are lower, around 1 to 3 records. Single low bars appear around 13 to 14 at about 1 record. A cluster of bars appears around 16 to 18, with heights around 2 to 4 records. Histogram B with the x-axis label Age (cal yr BP). The y-axis label is n of records. Multiple bars overlap within the same age bins for the three legend categories. The highest counts occur in the youngest ages near 0 to 1000, with the tallest bar reaching about 22 records and another near about 18 records. A smaller group appears around 1800 to 2300, with bars up to about 6 records. Isolated low bars appear around 4000 to 5200 at about 1 record. A group of low bars appears around 5600 to 7400, with bars around 1 to 4 records. Both histograms use the same three record categories and show how record counts are distributed across elevation in B and across age in A.
Discussion
Raised beach ages and the Holocene RSL record of Nelson Island
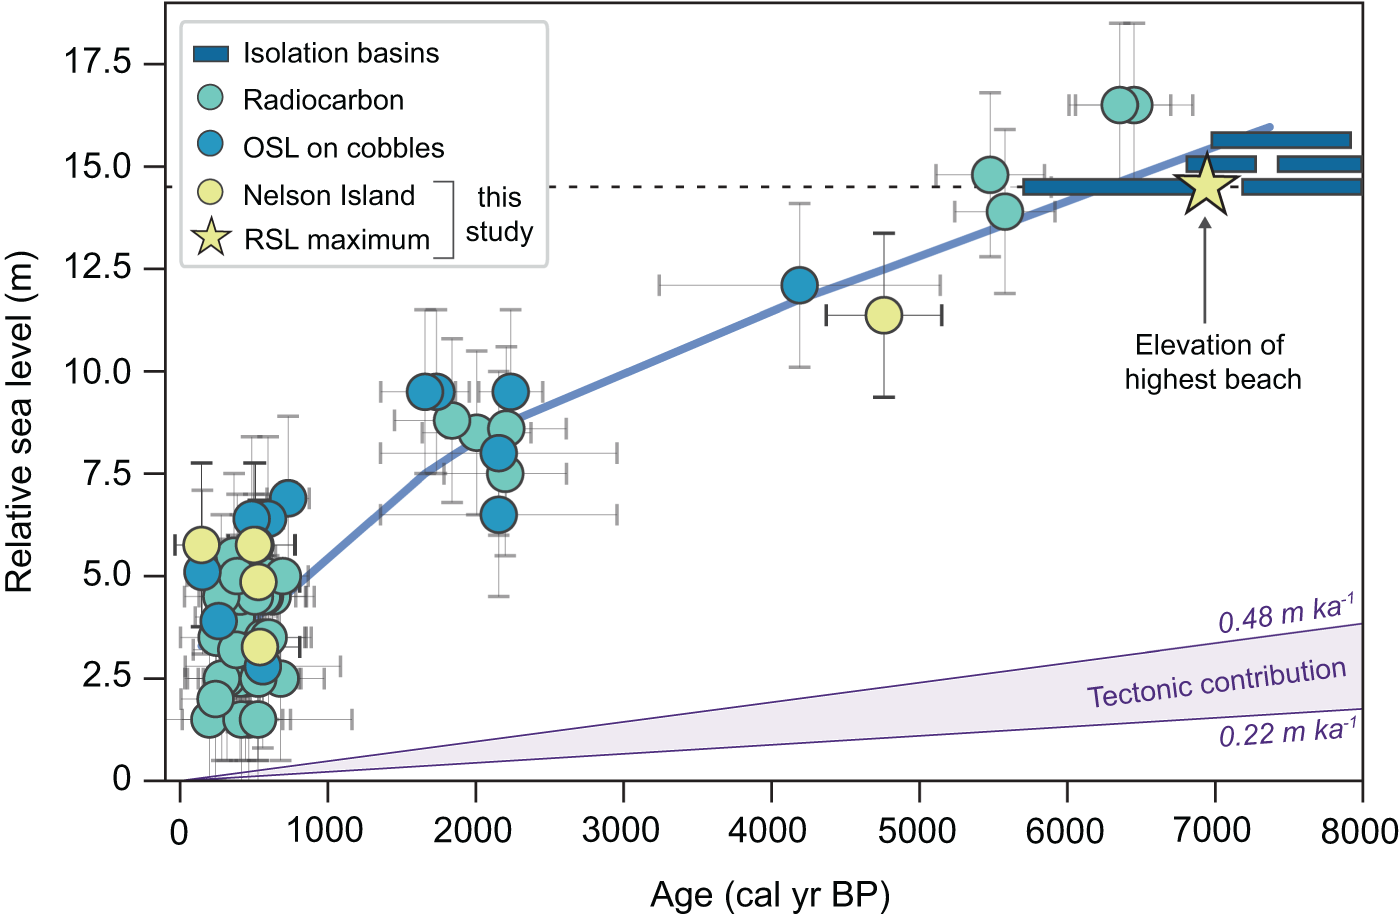
Our new data from Nelson Island provide new constraints on the age of raised beaches and the Holocene RSL record of the SSI of Antarctica (Fig. 7). On Nelson Island, and elsewhere in the SSI, the highest well-preserved beach ridge is often interpreted as the Holocene marine limit. Linear extrapolation from the highest beach dated (Beach 10: 12.9 m, i.e., 11.3 m above PDB) to the highest beach surveyed (Beach 12: 16.1 m, i.e., 14.6 m above PDB) yields an estimated age of ∼7000 cal yr BP for the Holocene marine limit on Nelson Island (Fig. 8). The elevation of this interpreted Holocene marine limit is consistent with the elevation of the highest beaches within the isobase of Fretwell et al. (Reference Fretwell, Hodgson, Watcham, Bentley and Roberts2010). Fragmented shells retrieved from Beach 10 at an elevation of ∼12.9 m (i.e., ∼11.3 m above PDB) constrain the marine transgression to before ∼4800 cal yr BP and provide one of only five radiocarbon ages of >4000 cal yr BP on beaches above 12 m in the SSI (Hall, Reference Hall2010).
(A) Digital elevation model (DEM) of Duthoit Point with location of radiocarbon-dated samples and derived ages in calibrated years before present (cal yr BP). (B) Elevation profile A–A′ with age control on dated beach ridges.

Figure 7 Long description
A) Digital elevation model of Duthoit Point, showing radiocarbon-dated samples marked with yellow circles. The samples are labeled with ages: 4760 ± 390, 510 ± 270, 530 ± 280, 500 ± 275, 145 ± 180 and 540 ± 270 calibrated years before present. The map includes a scale bar indicating distances from 0 to 100 meters and an elevation gradient from 0 to 30 meters. B) Elevation profile from A to A′, showing elevation relative to PDB in meters. The profile includes upper, intermediate and lower beaches, with elevations ranging from 0 to 15 meters. Radiocarbon ages are marked along the profile, corresponding to the samples in the elevation model. The profile illustrates the transition from upper to lower beaches, with labeled elevations and distances from 0 to 300 meters.
Regional relative sea-level (RSL) curve with data from Nelson Island. Yellow symbols are records obtained in this study and the other symbols represent compilation of the data in Figure 6 from published studies (cited in the text) located within the 16–14 m isobase of uplift (Fretwell et al., Reference Fretwell, Hodgson, Watcham, Bentley and Roberts2010). Elevations are reported relative to the elevation of the present-day beach (PDB), which is reported to be ∼1.5 m in the South Shetland Islands (SSI) (Watcham et al., Reference Watcham, Bentley, Hodgson, Roberts, Fretwell, Lloyd and Larter2011). Sea-level curve denoted in solid blue was determined by computing a LOWESS (locally weighted scatterplot smoothing) fitting. Dashed black horizontal line indicates the highest beach surveyed at Duthoit Point (Beach 12, 14.6 m) that would correspond to the Holocene marine limit on Nelson Island, with the yellow star denoting its estimated age of RSL maximum. Reported beach ages are plotted with errors derived from chronological constraints as well as vertical measurements. We use vertical error bars of ∼2 m to account for the spatially variable vertical resolution of the sampling reported by different authors. Long-term tectonic contribution from proxies such as marine platforms is plotted in purple (Watcham et al., Reference Watcham, Bentley, Hodgson, Roberts, Fretwell, Lloyd and Larter2011).

Figure 8 Long description
Relative sea level (m) Scatter plot with error bars and a fitted line. Legend entries: Isolation basins; Radiocarbon; OSL on cobbles; Nelson Island this study; RSL maximum. The x-axis is labeled Age (cal yr BP), ranging from 0 to 8000. The y-axis is labeled Relative sea level (m), ranging from 0 to 17.5. A thick fitted line rises from near 0 at age 0, passes near 5 at about 1000, near 9 at about 2000, near 12 at about 4000, near 14 at about 6000 and near 15 to 16 between about 7000 and 8000. Many circular points with vertical and horizontal error bars cluster between ages 0 and 1000 at relative sea level values roughly between 1 and 6. Another cluster of circular points lies between about 1600 and 2400 with relative sea level values roughly between 6 and 10. Additional circular points appear near about 4000 at about 12, near about 5000 at about 11, near about 5600 to 6000 at about 14 to 15 and near about 6500 to 7000 at about 16 to 17. Several horizontal rectangular markers appear between about 6000 and 8000 at relative sea level values around 14.5 to 16. A star marker is plotted near age about 7000 and relative sea level about 14.5. A dashed horizontal line is drawn at about 14.5. Text annotation near the star reads Elevation of highest beach, with an arrow pointing to the star. A shaded wedge near the bottom is labeled Tectonic contribution. Text near the upper boundary reads 0.48 m ka superscript -1 and text near the lower boundary reads 0.22 m ka superscript -1.
Beach morphology suggests that RSL did not substantially change between the formation of the youngest upper beach and the formation of the oldest intermediate beach (Figs. 7 and 8). We hypothesize that a deceleration in the rate of RSL fall may be responsible for the formation of the broad plain between the upper and intermediate beaches. This slowdown is also supported by a break in slope of the beach ridges between the upper and intermediate beach ridge sets (Fig. 7, Table 1).
Although we were unable to find material for radiocarbon dating the intermediate beaches (9.2 to 7.9 m, or 7.6 to 6.3 m relative to PDB), other studies within the SSI have dated beaches around the same elevation. On KGI, located on the same isobase as Nelson Island, Hansom (Reference Hansom1979), Curl (Reference Curl1980), Hall (Reference Hall2010), and Simms et al. (Reference Simms, Ivins, DeWitt, Kouremenos and Simkins2012) dated beach ridges at elevations ranging from 11 to 7 m (9 to 5 m relative to PDB) to ∼2000–1800 cal yr BP. Recently, Gernant et al. (Reference Gernant, Simms, DeWitt, Theilen, Garcia and Goebel2025) dated beaches to ∼2100 cal yr BP on Livingston Island at similar elevations. Based on this similarity in elevation (between 10 and 8 m or 8 to 6 m relative to PDB) (Figs. 3 and 7, Table 1) we tentatively assign an age of ~2000–1800 cal yr BP to the intermediate beaches (Hall, Reference Hall2010; Simms et al., Reference Simms, Ivins, DeWitt, Kouremenos and Simkins2012; Gernant et al., Reference Gernant, Simms, DeWitt, Theilen, Garcia and Goebel2025).
Our results show that the lower beaches on Nelson Island formed at 520 ± 20 cal yr BP, a similar time to the 6–4 m beach ridges elsewhere in the SSI, which date to between 600 and 500 cal yr BP (Hall, Reference Hall2010). At Rip Point, along the northern coast of Nelson Island (Fig. 1C), Sugden and John (Reference Sugden, John and van Zinderen Bakker1973) dated a sample from driftwood from an elevation of ∼6.5 m that yielded an age of 695 ± 50 cal yr BP, when using the updated radiocarbon reservoir of Divola et al. (Reference Divola, Simms, Sremba, Baker, Friedlaender and Southon2024). In Potter Cove, Simms et al. (Reference Simms, Ivins, DeWitt, Kouremenos and Simkins2012) dated beach cobbles on the lower beaches that yielded an age range of 450–250 yr BP.
RSL change and timing of ice fluctuations in the SSI
RSL changes across the SSI are largely modulated by GIA, with the age of the highest marine limit widely used to infer the timing of deglaciation across the SSI (Sugden and John, Reference Sugden, John and van Zinderen Bakker1973; Hall, Reference Hall2010; Gernant et al., Reference Gernant, Simms, DeWitt, Theilen, Garcia and Goebel2025). Some studies have suggested that deglaciation of the terrestrial portions of the SSI was already underway by 9000 cal yr BP in Fildes Peninsula (Watcham et al., Reference Watcham, Bentley, Hodgson, Roberts, Fretwell, Lloyd and Larter2011) and by 8200 cal yr BP in Potter Peninsula (Emslie et al., Reference Emslie, Romero, Juáres and Argota2020; Heredia Barión et al., Reference Heredia Barión, Strelin, Roberts, Spiegel, Wacker, Niedermann and Bentley2023a), although local climatic and physiographic factors likely led to spatial variability among islands. The highest beach also marks the limit of marine transgression (John and Sugden, Reference John and Sugden1971; Hall, Reference Hall2010), which has been dated to between 7000 and 6000 cal yr BP (Hall, Reference Hall2010; Watcham et al., Reference Watcham, Bentley, Hodgson, Roberts, Fretwell, Lloyd and Larter2011).
Hall (Reference Hall2010) suggested that a simple linear extrapolation of these marine limits may not be sensitive enough to capture the timing of deglaciation in the SSI and, instead, may be recording the timing of glacial advances. This shortfall is in part due to the complex nature of RSL changes across the SSI, which do not reflect continuous deglaciation, uplift, and linear RSL fall. In contrast, the RSL changes experienced across the SSI are likely influenced by glacial advances/still stands through the Holocene. These ice fluctuations may temporally pause uplift or potentially even lead to short-term RSL rise (Hall, Reference Hall2010; Gernant et al., Reference Gernant, Simms, DeWitt, Theilen, Garcia and Goebel2025) that interrupts the otherwise continuous RSL fall when uplift outpaces eustatic sea-level rise locally (Watcham et al., Reference Watcham, Bentley, Hodgson, Roberts, Fretwell, Lloyd and Larter2011; Simms et al., Reference Simms, Ivins, DeWitt, Kouremenos and Simkins2012).
Our extrapolated age for the highest beach (Beach 12) surveyed on Nelson Island is ∼7000 cal yr BP. This age coincides with dated glacial advances in the SSI of between ∼7000 and 4000 cal yr BP (Hall, Reference Hall2009; Palacios et al., Reference Palacios, Ruiz-Fernández, Oliva, Andrés, Fernández-Fernández, Schimmelpfennig and Leanni2020; Heredia Barión et al., Reference Heredia Barión, Roberts, Spiegel, Binnie, Wacker, Davies and Gabriel2023b; Gernant et al., Reference Gernant, Simms, DeWitt, Theilen, Garcia and Goebel2025) as well as in other locations around the Antarctic Peninsula between ∼7000 and ∼4000 cal yr BP (Hjort et al., Reference Hjort, Ingólfsson, Möller and Lirio1997; Kaplan et al., Reference Kaplan, Strelin, Schaefer, Peltier, Martini, Flores and Winckler2020; Romero et al., Reference Romero, Strelin, Kaplan, Martini, Flores, Barrionuevo and Heredia Barión2026).
The development of the broad plain between the upper and intermediate beaches on Nelson Island likely reflects a return to the slower, longer-lived rebound associated with retreat of the LGM ice sheet. Following this interval, renewed glacial retreat may have driven a minor acceleration in uplift and RSL fall, facilitating the formation of the intermediate raised beaches (9.2 to 7.9 m, or 7.6 to 6.3 m relative to PDB). Across the SSI, beaches at similar elevations date to between 2100 and 1800 cal yr BP (Hansom, Reference Hansom1979; Curl, Reference Curl1980; Hall, Reference Hall2010; Simms et al., Reference Simms, Ivins, DeWitt, Kouremenos and Simkins2012; Gernant et al., Reference Gernant, Simms, DeWitt, Theilen, Garcia and Goebel2025). Comparable records of glacial advances support a regional glaciological control on RSL variability during this interval, with terrestrial and lacustrine records in the SSI indicating advances at ∼2500–1000 cal yr BP (Oliva et al., Reference Oliva, Antoniades, Giralt, Granados, Pla-Rabes, Toro and Liu2016; Palacios et al., Reference Palacios, Ruiz-Fernández, Oliva, Andrés, Fernández-Fernández, Schimmelpfennig and Leanni2020; Heredia Barión et al., 2023b), and terrestrial, lacustrine, and marine records from the eastern Antarctic Peninsula indicating advances at ∼2500–1300 cal yr BP (Totten et al., Reference Totten, Anderson, Fernandez and Wellner2015; Čejka et al., Reference Čejka, Nývlt, Kopalová, Bulínová, Kavan, Lirio and Coria2020; Kaplan et al., Reference Kaplan, Strelin, Schaefer, Peltier, Martini, Flores and Winckler2020; Roman et al., Reference Roman, Píšková, Sanderson, Cresswell, Bulínová, Pokorný and Kavan2024).
Previous authors have suggested the lower beaches in the 6–4 m range (above PDB) formed due to rejuvenated uplift driven by retreat following a glacial advance during the last millennium, roughly between 600 and 500 cal yr BP, corresponding to cooling episodes during the Little Ice Age (LIA) (Clapperton and Sugden, Reference Clapperton and Sugden1988; Hall, Reference Hall2010; Simms et al., Reference Simms, Bentley, Simkins, Zurbuchen, Reynolds, DeWitt and Thomas2021). On Nelson Island, our results constrain the age of these features to 520 ± 20 cal yr BP.
Evidence of a glacial advance around this time is prevalent across the SSI (Birkenmajer, Reference Birkenmajer1979, Reference Birkenmajer1981, Reference Birkenmajer1998; Curl, Reference Curl1980; Yoon et al., Reference Yoon, Khim, Lee, Park and Yoo2006; Hall, Reference Hall2007, Reference Hall2010; Simms et al., Reference Simms, Ivins, DeWitt, Kouremenos and Simkins2012, Reference Simms, Bentley, Simkins, Zurbuchen, Reynolds, DeWitt and Thomas2021; Gernant et al., Reference Gernant, Simms, DeWitt, Theilen, Garcia and Goebel2025). For example, Hall (Reference Hall2007) dated a moraine to ∼650 cal yr BP on neighboring Fildes Peninsula. These findings support the conclusion that the 6–4 m beaches formed ∼600–500 cal yr BP, broadly contemporaneous with an earlier pulse of the LIA cooling (Simms et al., Reference Simms, Bentley, Simkins, Zurbuchen, Reynolds, DeWitt and Thomas2021). This behavior appears to extend beyond the SSI onto the nearby Antarctic Peninsula. On nearby Joinville Island (Fig. 1), Zurbuchen and Simms (Reference Zurbuchen and Simms2019) found evidence of beach ridge progradation following a period of beach erosion likely due to a minor sea-level transgression driven by local glacial advances between ∼700 and 200 cal yr BP. On James Ross Island (Fig. 1), for instance, ice core records (Mulvaney et al., Reference Mulvaney, Abram, Hindmarsh, Arrowsmith, Fleet, Triest and Sime2012), marine sediments (Totten et al., Reference Totten, Anderson, Fernandez and Wellner2015), and glacial erratics (Kaplan et al., Reference Kaplan, Strelin, Schaefer, Peltier, Martini, Flores and Winckler2020) indicate colder conditions over the last ∼500–400 years. Across the Drake Passage, ice advances in Cordillera Darwin were documented at ∼750 and 500 cal yr BP (Hall et al., Reference Hall, Lowell, Bromley, Denton and Putnam2019), broadly coinciding with the ice advance found on the SSI.
The occurrence of young, raised beaches overridden by later glacial advances suggests a more complex expression of the LIA in the SSI. If the ∼500-year-old youngest beaches are a result of isostatic rebound following retreat of the LIA advance, why are they overrun on Nelson Island by another advance (Fig. 5)? Similarly, beaches at Spark Point, on Greenwich Island, dated to 540 cal yr BP when calibrated using the reservoir of Divola et al. (Reference Divola, Simms, Sremba, Baker, Friedlaender and Southon2024), are also overrun by a more recent advance of the glaciers there (Simms et al., Reference Simms, Bentley, Simkins, Zurbuchen, Reynolds, DeWitt and Thomas2021). John and Sugden (Reference John and Sugden1971), Sugden and John (Reference Sugden, John and van Zinderen Bakker1973), and Clapperton and Sugden (Reference Clapperton and Sugden1988) also report beaches at ∼6 m elevation overridden by a more recent advance. One possible explanation is that the LIA in the SSI may have been expressed as two separate advances (Clapperton and Sugden, Reference Clapperton and Sugden1988). Simms et al. (Reference Simms, Bentley, Simkins, Zurbuchen, Reynolds, DeWitt and Thomas2021) found some support for this notion in that they obtained better statistical fits to the age data compiled in OxCal (Bronk Ramsey, Reference Bronk Ramsey2009) if considering the population of LIA ages as two distinct advances.
Differentiating GIA and tectonic signals
Our record from Nelson Island supports previous assertions that changes in RSL and raised beach ridge formation around the SSI are primarily driven by GIA (Pallàs et al., Reference Pallàs, James, Sàbat, Vilaplana, Grant and Ricci1997; Fretwell et al., Reference Fretwell, Hodgson, Watcham, Bentley and Roberts2010); however, co-seismic uplift remains a potential alternative explanation for the pattern of raised beach development within the SSI (Gernant et al., Reference Gernant, Simms, DeWitt, Theilen, Garcia and Goebel2025). A co-seismic origin for what Gernant et al. (Reference Gernant, Simms, DeWitt, Theilen, Garcia and Goebel2025) described as the “stranded” nature of the flights of raised beaches (isolated raised beach ridges with much higher relief than their neighboring raised beaches) is not out of the question given the location of the SSI over a subduction zone. However, the morphological characteristics of the stranded raised beaches do not support a co-seismic origin (Hall, Reference Hall2010; Gernant et al., Reference Gernant, Simms, DeWitt, Theilen, Garcia and Goebel2025). For example, most beaches in the SSI, including those surveyed on Nelson Island, show that the stranded beaches are fronted on their seaward sides by multiple beaches at successively lower elevations (Fretwell et al., Reference Fretwell, Hodgson, Watcham, Bentley and Roberts2010; Gernant et al., Reference Gernant, Simms, DeWitt, Theilen, Garcia and Goebel2025). At Duthoit Point, if these sets of beaches were caused by co-seismic uplift, one would not expect the development of multiple lower beaches on the flanks of the highest beach in the sets of beaches (e.g., Beaches 2–6; Figs. 3 and 7). Instead, the highest beach would be isolated with the adjacent subsequent beaches at a much lower elevation. This morphology suggests that the raised beach sets formed progressively over an extended period under varying wave conditions and sea levels, rather than during a single event. An earthquake, for example, would be responsible for forming cliffs instead of stranded beaches (Gernant et al., Reference Gernant, Simms, DeWitt, Theilen, Garcia and Goebel2025). Similar stranded raised beach morphologies have been reported elsewhere along the Antarctic Peninsula not overlying the subduction zone (e.g., Zurbuchen and Simms, Reference Zurbuchen and Simms2019; Gernant et al., Reference Gernant, Simms, DeWitt, Theilen, Garcia and Goebel2025). These other beaches (e.g., Zurbuchen and Simms, Reference Zurbuchen and Simms2019) exhibit similar stranded raised beach morphology and date to similar late Holocene times.
Furthermore, despite the occurrence of a recent magnitude 6.0 earthquake in the Bransfield Strait with an epicenter ∼30 km away from Duthoit Point (Olivet et al., Reference Olivet, Bettucci, Castro-Artola, Castro, Rodríguez and Latorres2021; Cesca et al., Reference Cesca, Sugan, Rudzinski, Vajedian, Niemz, Plank and Petersen2022), no records of larger earthquakes are known, although available records are short. Much of the recorded seismic activity has been attributed to magmatic or eruptive events from the Orca seamount (Fig. 1B) as reported by Robertson Maurice et al. (Reference Robertson Maurice, Wiens, Shore, Vera and Dorman2003). Megathrust earthquakes capable of causing up to ∼15 m of uplift are common in Alaska, Chile, and Japan, for example. However, the rupture zone in these regions is larger than in the SSI (Plafker, Reference Plafker1965, Reference Plafker1969). Additionally, many of the earthquakes in other subduction zones have left fault scarps across the landscape during these past events. However, no documentation of such features has been reported to date in the SSI, as pointed out by Simms et al. (Reference Simms, Ivins, DeWitt, Kouremenos and Simkins2012).
Wider implications
Our record from Nelson Island provides Holocene, centennial- to millennial-scale constraints on RSL change, based on raised beaches spanning ∼2–14 m (relative to PDB). These data support recent suggestions that centennial- to millennial-scale changes in ice loading and unloading can impose a recordable response of the solid Earth (Thomas et al., Reference Thomas, King, Bentley, Whitehouse, Penna, Williams and Riva2011; Simms et al., Reference Simms, Ivins, DeWitt, Kouremenos and Simkins2012, Reference Simms, Whitehouse, Simkins, Nield, DeWitt and Bentley2018; Nield et al., Reference Nield, Barletta, Bordoni, King, Whitehouse, Clarke, Domack, Scambos and Berthier2014; Zurbuchen and Simms, Reference Zurbuchen and Simms2019; Gernant et al., Reference Gernant, Simms, DeWitt, Theilen, Garcia and Goebel2025). Overall, moderate-scale changes (as opposed to continent-wide) in ice cover over time can induce significant pauses in isostatic recovery (Simms et al., Reference Simms, Ivins, DeWitt, Kouremenos and Simkins2012, Reference Simms, Whitehouse, Simkins, Nield, DeWitt and Bentley2018; Zurbuchen and Simms, Reference Zurbuchen and Simms2019) or even sea-level transgressions recorded in the architecture of raised beach ridges (Gernant et al., Reference Gernant, Simms, DeWitt, Theilen, Garcia and Goebel2025). Specifically, the rate of RSL change is likely reflecting Holocene ice fluctuations and associated sea-level changes instead of long-term, Pleistocene ice-sheet behavior (Zurbuchen and Simms, Reference Zurbuchen and Simms2019). Furthermore, the rheology beneath the Antarctic Peninsula must be weak enough to respond to these smaller changes in ice loading (e.g., Nield et al., Reference Nield, Barletta, Bordoni, King, Whitehouse, Clarke, Domack, Scambos and Berthier2014, Reference Nield, King, Koulali and Samrat2023, Reference Nield, Bentley, Koulali, Clarke, King, Wilson and Whitehouse2025). This behavior has important implications for GIA models and our current understanding of the solid Earth beneath the SSI and around the Antarctic Peninsula, which may underestimate the magnitude of observed Holocene uplift rates in the SSI and along the Antarctic Peninsula. This limitation also highlights gaps in our understanding of the solid Earth structure beneath the region and may hinder accurate simulations of future sea-level change.
Conclusions
This study provides the first comprehensive topographic survey of raised beaches of Duthoit Point on Nelson Island, Antarctica. We document the timing and nature of RSL changes on the island by providing new chronological constraints on the seldom dated upper beaches (∼15–11 m) as well as the more often dated lower beaches (∼6–4 m) of the SSI. Our findings support recent assertions that the prevalent breaks in beach ridges within the SSI (and potentially across the Antarctic Peninsula) are a reflection of GIA associated with the retreat of Holocene glacial advances. We dated these landforms to the middle to late Holocene, with the breaks in beach ridges bracketing glacial advances across the SSI to between ∼7000 and 4800 and at ∼2000 cal yr BP. Additionally, we add to the growing number of ages on the lower raised beaches (∼6–4 m) across the islands, which yield an average age of 520 ± 20 cal yr BP, broadly coinciding with cooling episodes documented during the LIA. Furthermore, glacial deposits overrunning the lower beaches suggest that glaciers on Nelson Island advanced after ∼500 cal yr BP, possibly attributed to a second late-stage cooling phase of the LIA. Our results suggest that centennial- to millennial-scale changes in ice extent drive a recordable isostatic response that should be considered when modeling GIA and future sea-level contributions from Antarctica.
Acknowledgments
We are grateful for field support as well as logistics efforts provided by the Argentinian Antarctic Program involving Instituto Antártico Argentino (IAA), the Comando Conjunto Antártico (COCOANTAR), and the Dirección Nacional del Antártico (DNA). We thank the 2020–2021 station crew from Base Carlini (Potter Peninsula) for their help in the field, especially Jazmin Fogel, Emmanuel Chang, Ignacio Carnevale, and Yanina Ciriani. Additionally, we thank Andrés Zakrajsek for information about the Carlini GNSS station and 2021 summer season Carlini Station scientific chief Dolores Deregibus. Claire Divola, Elisa Medri, and John Southon are thanked for their help with radiocarbon dating. We thank Stephen Roberts for helpful conversations regarding the SSI relative sea level record. Lastly, we thank Michael Bentley and another anonymous reviewer for their constructive comments that helped improve the quality of the article as well as editorial handling by Nicholas Lancaster and Thomas Lowell.
Financial Support
MR is grateful for support from CONICET and from the Department of Geoscience, University of Wisconsin–Madison. ARS’s research on the SSI is supported by the National Science Foundation (NSF grant no. 1644197).




 Open access

