

I. INTRODUCTION
The structure of UO2 fuel is strongly modified by the production of fission products, irradiation damage, and the high operating temperature and associated decrease in thermal conductivity. Reference Ronchi, Sheindlin, Staicu and Kinoshita1 The low thermal conductivity, in particular, is an important feature of UO2 that has motivated numerous theoretical and experimental studies over the past few decades. Theoretical considerations imply that the main reason for the low thermal conductivity of UO2 crystals, which have a fluorite structure, is the high anharmonicity of certain phonon modes. Reference Yin and Savrasov2 In addition to the initially low thermal conductivity of nonirradiated nuclear fuel, irradiation damage resulting in point defects (vacancies, interstitials) and extended defects (dislocations, voids) has a detrimental effect on the UO2 thermal performance. Reference Deng, Chernatynskiy, Shukla, Sinnott and Phillpot3 Accompanied with the irradiation damage, soluble and nonsoluble fission products populate the matrix forming precipitates and gas bubbles. Reference Noirot, Desgranges and Lamontagne4
CeO2 has been widely used as a surrogate of UO2 in regard to examining irradiation damage and microstructure evolution. Modeling work has provided evidence that the irradiation response in these ionic fluorite crystal structures of both CeO2 and UO2 is similar. Reference Aidhy, Wolf and El-Azab5 CeO2 irradiation with various ions has indicated that O vacancies may play a significant role in the defect kinetics. This role facilitates anomalous grain growth in nanocrystalline CeO2 irradiated with 3 MeV Au ions. Reference Edmondson, Zhang, Moll, Varga, Namavar and Weber6 Experiments have also shown that the Ce3+/Ce4+ ratio increased and Ce3+ induced ferromagnetism after irradiation by 200 MeV Xe ions. Reference Shimizu, Kosugi, Tahara, Yasunaga, Kaneta, Ishikawa, Hori, Matsui and Iwase7 Previous x-ray diffraction (XRD) results have shown that the CeO2 lattice has a tendency to expand upon low temperature irradiation with various ion species. Reference Chen, Zu, Xiang and Zhang8,Reference Ishikawa, Chimi, Michikami, Ohta, Ohhara, Lang and Neumann9 Postirradiation annealing has been shown to recover the lattice in the case of He2+ and N+ irradiated CeO2, Reference Chen, Zu, Xiang and Zhang8,Reference Weber10 but to our knowledge similar observations have not been reported for heavy ion irradiated CeO2.
In contrast to UO2, the CeO2 lattice can facilitate significant loss of O (CeO2−x ) which requires additional aspects taken into account in ion irradiation experiments. Reference Schwab, Steiner, Mages and Beie11 While changes in the CeO2 lattice constant have been tied to the amount of O vacancies within the CeO2 lattice, Reference Schwab, Steiner, Mages and Beie11 displacement damage also affects the lattice. In fact, displacement damage has been shown to induce lattice expansion in low temperature ion irradiations in several ionic fluorite structures Reference Weber10 regardless of whether they show hypostoichiometry, just like in metals. Reference Borodin, Ryazanov and Sherstennikov12 Concluding from the above, it may be stated that both stoichiometry and displacement damage affect the lattice constant of CeO2 and the mechanisms of lattice recovery are therefore not fully understood.
In this work, polycrystalline CeO2 was irradiated at room temperature with 400 keV Xe ions and 1 h postirradiation annealed at 1000 °C in air. The resulting changes in lattice constant were examined by XRD. Electron energy loss spectroscopy (EELS) was applied to study the spatial stoichiometry upon irradiation and postirradiation annealing.
II. EXPERIMENTAL
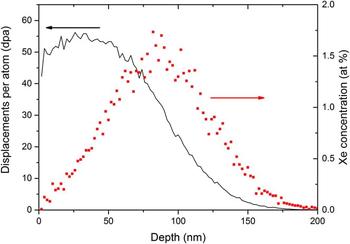
Polycrystalline CeO2 pellets with an average grain size of approximately 5 µm were purchased from Alfa Aesar. The purity of pellets was 99.9% and the density 6.9 g/cm3, which is about 96% of the theoretical density. The pellets were manually polished to a mirror finish by using diamond lapping films (0.5 µm being the finest) before XRD measurements and Xe ion irradiation. Xe ion irradiations at room temperature were performed using a 200 keV Danfysik ion implanter (Danfysik A/S, Taastrup, Denmark) at the Los Alamos National Laboratory. The Xe ion energy was 400 keV and the total fluence was 1 × 10²⁰ ions/m2. The irradiation ion flux was kept at 1 × 10¹⁶ ions/m2/s and the target temperature during the irradiation was less than 40 °C. The temperature was determined by a thermocouple placed in close proximity to the samples. The implanted Xe distribution and damage profile were calculated using the Kinchin–Pease quick damage mode calculation in the TRIM code. Reference Ziegler13,Reference Stoller, Toloczko, Was, Certain and Garner14 The results from the simulations are shown in Fig. 1.
TRIM simulation results for irradiation damage (left axis) and Xe atom percent (right axis) as a function of depth.

The irradiation-induced modification of the crystal structure was examined using XRD and scanning transmission electron microscopy (STEM) accompanied by EELS. A Siemens Stoe x-ray diffractometer using Cu Kα radiation (40 kV, 2.5 mA) was used in omega–2theta and grazing incidence (GI) geometry. The GI-XRD measurements were used to depth profile the observed XRD features. The x-ray probing depth, p, was calculated using a geometric relation Reference Guinebretiere15 :
 $$p = - {1 \over \mu }\left[ {\ln \left( {{I \over {I_0 }}} \right)} \right]\left[ {{{\sin \left( \omega \right)\sin \left( {2\theta - \omega } \right)} \over {\sin \left( \omega \right) + \sin \left( {2\theta - \omega } \right)}}} \right]\quad ,$$
where µ is the linear absorption coefficient, I and I 0 are the diffracted and incoming intensity, ω is the angle between the sample surface and the incoming x-ray beam, and 2θ is the angle between the incoming beam and the detector. A criterion for probing depth was set to be I/I 0 = 1/e, i.e., once the diffracted intensity falls 1/e of its initial values it was assumed negligible. The µ for CeO2 was calculated by using tabulated individual mass absorption coefficients Reference Hubblell and Seltzer16 (µ/ρ)Ce and (µ/ρ)O for Ce and O according to Eq. (2):
 $$\mu \left( {{\rm{CeO}}_2 } \right) = \left( {{\mu \over \rho }} \right)_{{\rm{Ce}}} \times \rho _{{\rm{Ce}}} \left( {{\rm{CeO}}_2 } \right) + \left( {{\mu \over \rho }} \right)_{\rm{O}} \times \rho _{\rm{O}} \left( {{\rm{CeO}}_2 } \right)\quad .$$
The atomic densities for Ce and O, ρCe (CeO2) and ρO (CeO2), in Eq. (2) were calculated from the given CeO2 density of 6.9 g/cm3. The XRD data were fit using Fityk software. Reference Wojdyr17 The peaks were estimated as Voigt functions and the Cu Kα1/Kα2 ratio was set to ∼2:1.
EELS was conducted on a 200 kV FEI Titan Schottky field-emission gun STEM (FEI, Burlington, MA) with a CEOS probe aberration corrector and high-resolution Tridiem GIF. The EELS spectrum images were taken in an EFSTEM mode with 24.5 mrad convergence angle, 52 mrad collection angle, and 0.8 eV energy resolution. STEM samples were prepared in a focused ion beam (FIB) system. TEM lamellae were created by coarse trenching 20 μm × 15 μm × 1 μm samples using the FIB. The samples were then lifted out and welded into a copper TEM grid for final TEM thinning. The samples were thinned to a final thickness of roughly 100 nm using 30 kV ion beam. The final cleaning of the samples was conducted using small ion energy (5 kV).
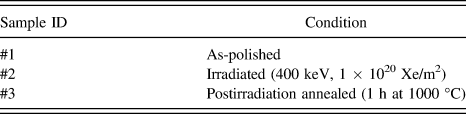
The details of the examined samples are listed in Table I. Three different conditions from the same heat of CeO2 were examined: As-polished, irradiated, and postirradiation annealed. The postirradiation annealing was done at 1000 °C for 1 h in a regular tube furnace in air.
The conditions of the examined CeO2 samples.

III. EXPERIMENTAL RESULTS
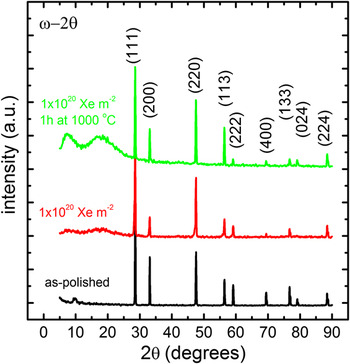
The small grain size (about 5 µm) of the CeO2 pellets allowed all the theoretically predicted reflections to appear at the long coupled ω–2θ scans as shown in Fig. 2. Only negligible differences were seen at the sharp CeO2 reflections of the nonirradiated and irradiated samples. The visible splitting of the high angle diffraction peaks is due to Cu Kα1 and Cu Kα2 x-rays contributed to the recorded XRD. The background at small 2θ values (<30°) showed a clear increase upon postirradiation annealing and similar features were also seen at the irradiated sample. These background features are tentatively assigned to an increase in surface roughness due to the ion irradiation and the postirradiation annealing.
Long ω–2θ scans showed no new additional peaks upon Xe-irradiation and postirradiation annealing of CeO2. The increased background (especially at small 2θ values) for the irradiated and postirradiation annealed samples was attributed to increased surface roughness.

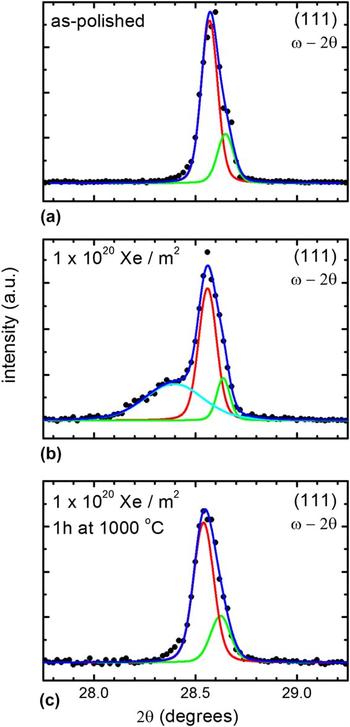
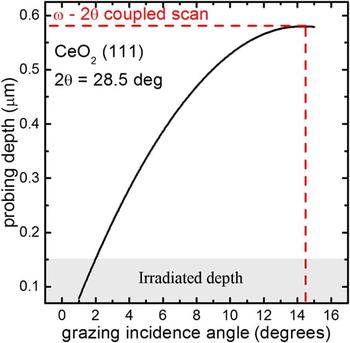
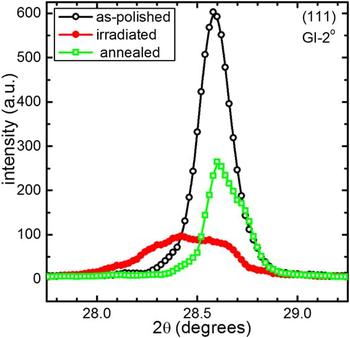
A more thorough analysis was performed for the CeO2 (111) reflections of all the examined samples. Fairly narrow peaks were found from the as-polished sample (Fig. 3). A broad shoulder peak accompanied the (111) matrix reflection at the as-irradiated sample, while the shoulder was not detected upon postirradiation annealing. To examine the depth dependency of the observed XRD features in the irradiated sample, GI measurements for the (111) peak were performed varying the angle of incidence (ω) from 2 to 10°. The x-ray probing depths calculated from Eq. (1) for different incidence angles are shown in Fig. 4 for the particular CeO2 (111) peak. For the small incidence angles (∼2°), the probing depth matches the irradiation depth [see the stopping and range of ions in solids (SRIM) results in Fig. 1]. The large GI angles (as well as the coupled ω–2θ scan) probe much deeper volume of the sample and include a significant amount of crystal information below the irradiated region.
High precision ω–2θ scans for the CeO2 (111) peak were almost similar for (a) the as-polished and (c) the postirradiation annealed samples and showed only one well defined peak. In contrary, (b) the Xe-irradiated sample showed a clear shoulder on the left side of the matrix (111) reflection. The matrix reflection was fitted with two components for Cu Kα1 and Kα2, while one component was sufficient for the broad shoulder peak.

XRD probing depth as a function of GI angle for CeO2 (111). The box shows the irradiation depth (Eq. (1)) and the dashed red line shows the probing depth of coupled ω–2θ scan for a comparison.

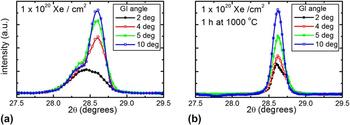
GI-XRD results for the irradiated and the postirradiation annealed sample are shown in Figs. 5(a) and 5(b), respectively. Decreasing the GI angle decreases the intensity of matrix related sharp (111) reflection in both cases. The shoulder peak in the irradiated sample shows an opposite behavior; its size and shape remain virtually unchanged when the angle of incidence is decreased. The observation clearly indicated that the origin on the broad shoulder peak must be related to the irradiated region. A comparison of surface sensitive GI 2° scans for all the samples is shown in Fig. 6. The absence of shoulder peak from the as-polished sample indicates that the feature must be related to the irradiation, while the postirradiation annealing seems to recover the lattice (i.e., the shoulder peak is not present in the annealed sample).
GI-XRD clearly shows that the (111) shoulder peak is related to near surface properties of the sample; (a) decreasing the GI angle for the irradiated sample mainly reduces the intensity of the sharp CeO2 (111) matrix peak but not the shoulder peak. In contrast, (b) the postirradiation annealed sample did not show any additional features even at small GI angle.

A 2° GI-XRD (with a probing depth of ∼150 nm) clearly shows the similarity of the as-polished and annealed samples and the presence of irradiation-induced shoulder peak for the as-irradiated sample.

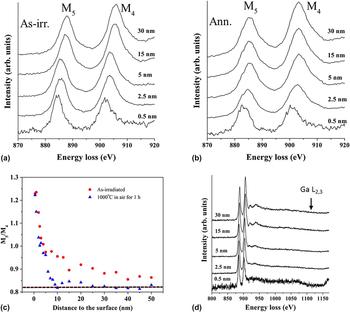
EELS measurements were conducted to explore the Ce charge state evolution over a 50 nm surface layer [Figs. 7(a) and 7(b)] for the irradiated and postirradiation annealed samples. The profile depth was limited by the sample thickness. Using the second derivative of the experimental EELS spectra and then integrating the intensity of the respective peaks above the zero-value linear function [Fig. 7(c)], it was found that the M5/M4 ratio of Ce for the as-irradiated and annealed samples decreased sharply from about 1.25 at the first 5 nm and gradually became stable around 0.85–0.88 upon increasing the depth. The major difference between the as-irradiated and annealed samples was that the M5/M4 ratio came down to the 0.85 range at much shallower depth for the annealed sample as compared to the as-irradiated sample. Also, the branching ratios for the annealed sample remained systematically lower than the ratios for as-irradiated samples at all measured depths [Fig. 7(c)]. The dashed line in Fig. 7(c) shows the M5/M4 ratio determined from similar EELS measurement for nonirradiated CeO2.
EELS spectra for Xe-irradiated (a) and postirradiation annealed (b) samples. The M5/M4 branching ratio (c), which is attributable to oxygen vacancy concentration (see text for details), showed much faster recovery for the annealed sample as compared to the as-irradiated sample. The dashed line shows the M5/M4 branching ratio for nonirradiated CeO2. (d) Ga L2,3 was not detected at any depth.

The EELS spectra were recorded over a wide energy loss range [shown in Fig. 7(d) for as-irradiated sample] to detect if Ga ions from FIB sample preparation were present in the examined material. No Ga L2,3 related features were detected at 1115 eV energy loss for any of the examined depth.
IV. DISCUSSION
XRD was performed to examine CeO2 crystal properties in three different conditions: As-polished, irradiated to 1 × 10¹⁶ Xe ions/cm2, and 1 h postirradiation annealed at 1000 °C. XRD revealed a wide shoulder peak at the low angle side of the CeO2 (111) reflection upon irradiation. The fact that the shoulder peak was located at the smaller diffraction angle than the CeO2 (111) reflection indicates a larger lattice constant. Previously, the lattice constant of CeO2−x has been shown to increase upon the increase of hypostoichiometry. Reference Schwab, Steiner, Mages and Beie11 The lattice expansion is presumably due to the Ce3+ cations. Reference Chen, Zu, Xiang and Zhang8 The presence of Ce3+ in hypostoichiometric CeO2−x is associated with the formation of oxygen vacancy, since neutral oxygen vacancy in CeO2 produces two free electrons, which localize on the f-state of the nearest Ce atoms and change the valence state from +4 to +3. Reference Skorodumova, Simak, Lundqvist, Abrikosov and Johansson18,Reference Hojo, Mizoguchi, Ohta and Yamamoto19 In stoichiometric fluorite CeO2, the Ce cations are of charge state Ce4+. Furthermore, it has been discovered that heavy ion irradiation may change the CeO2 surface to become ferromagnetic, Reference Shimizu, Kosugi, Tahara, Yasunaga, Kaneta, Ishikawa, Hori, Matsui and Iwase7 which is also proposed to originate from the localized 4f electrons at the Ce3+ cations due to O vacancies.
Postirradiation annealing under oxygen atmosphere removed the (111) shoulder peak in XRD for the irradiated sample. The lattice recovery upon annealing in O containing environment is in line with the proposed explanation of the reduced amount of oxygen vacancies. However, while the O vacancies cause CeO2 lattice expansion, the displacement damage has an effect, too. Lattice expansion is commonly observed upon ion irradiation at low temperature, Reference Borodin, Ryazanov and Sherstennikov12 and contributions from implanted gas as well as intrinsic point defects have been widely reported in UO2 and CeO2. Reference Weber10,Reference Sattonnay, Garrido and Thome20 Postirradiation annealing has also been shown to gradually remove the lattice expansion observed in XRD. Reference Weber10 The mechanism behind the lattice recovery has been proposed to originate from defect annihilation, re-organization of point defects, and diffusion of the implanted gas. The irradiation temperature in this work was ∼40 °C, which is expected to be below the threshold for activation of any point-defect process in CeO2. The created point defects are thus believed to freeze in the lattice. Again, the postirradiation annealing temperature of 1000 °C is well above the threshold for vacancy and interstitial migration in the CeO2 lattice. Reference Weber10
While XRD probes the long range order of the crystal, the evolution of irradiation damage in point defect scale requires more sophisticated techniques such as x-ray absorption spectroscopy. Reference Ohno, Iwase, Matsumura, Nishihata, Mizuki, Ishikawa, Baba, Hirao, Sonoda and Kinoshita21 The difficulty of examining irradiation damage effects with XRD was a subject of debate few decades ago. Reference Willis, Bitllough and Stoneham22 In addition of showing that the problem is complex, the early work indicated that dislocation loops caused by radiation damage contribute to lattice expansion when they are on the point defect scale. Reference Willis, Bitllough and Stoneham22 Upon increasing in dimension, they become more difficult to detect by XRD. In situ transmission electron microscopy observations have clearly shown that upon post annealing treatments and irradiations in high temperature, the dimensions of irradiation-induced features (such as loops, voids, and gas bubbles) grow. Reference Sattonnay, Vincent, Garrido and Thome23–Reference Sabathier, Vincent, Garcia, Garrido, Carlot, Thome, Martin and Valota25 Therefore, indirect XRD observations for the irradiation damage should be interpreted with caution.
EELS was performed for as-irradiated and postirradiation annealed samples. To interpret the EELS results, the observations are divided between surface (0–5 nm) and irradiated regions (5–50 nm). According to Fortner and Buck, Reference Fortner and Buck26 the average M5/M4 intensity ratio of Ce4+ is about 0.88 while it is 1.25 for Ce3+. The M5/M4 intensity ratios at the surface in both irradiated and annealed samples were close to 1.25, indicating that most Ce4+ had changed to Ce3+. The peak position of Ce M4,5-edge shifted about 2–3 eV toward lower energy with respect to the bulk areas, which also confirms that Ce4+ changed to Ce3+ at the surface. Reference Garvie and Buseck27
EELS showed that all the studied CeO2 surfaces contained Ce3+, which is a consequence of O depletion. Detailed defect disorder modeling is required to explain the O depletion in the CeO2 surface and to reveal the role of electronic carriers. Such modeling has been recently performed for UO2 (Ref. Reference Hassan, El-Azab, Yablinsky and Allen28); it was found that the defect states near the sample surface are sensitive to the temperature and oxygen partial pressure. In particular, the stoichiometry of the material was found to change over a sample thickness of tens of nanometers, with a significant role of the electronic carriers. CeO2 is a semiconductor oxide that suffers a range of disorder states depending on the thermodynamic state and also accommodates atomic defects with several charge states due to its ionic nature and the possibility to bind electrons to defects. Reference Zinkevich, Djurovic and Aldinger29,Reference Zacherle, Schriever, De Souza and Martin30 A surface introduces intrinsic and extrinsic electronic states that are occupied by electrons acquired from the oxide crystal. Reference Hassan, El-Azab, Yablinsky and Allen28,Reference DeSouza31,Reference Morrison32 Such electronic states modify the near surface composition by the buildup of electrostatic potential which neutralizes the surface charge by means of other defects. The oxygen vacancy concentration in CeO2 increases towards the surface because the vacancies are easily formed at the interface – CeO2 surface tends to be hypostoichiometric and have an effective positive charge. The variation in defect concentrations near the surface results in a strain gradient due to defect relaxation volumes and a stress field appears. The stress field contributes to the composition change in the near surface region Reference Sheldon and Shenoy33 and is likely responsible for the surface EELS observations.
While the theory of surface charge-induced hypostoichiometry agrees with the EELS observations, a special care needs to be taken when analyzing the results for the CeO2 surface. Namely, the cross-sectional CeO2 samples were fabricated by using FIB, and the ion milling process always produces unwanted irradiation damage. Even though the very first step of FIB sample preparation was to deposit a protective layer of Pt on the CeO2 surface, there is a possibility that the surface was damaged with the 30 kV Ga ions. The wide range energy loss spectrum did not show any Ga related features even at 0.5 nm from the surface [Fig. 7(d)], and the possibility of Ga ion implantation affecting the EELS measurement can therefore be excluded. However, if the deposited protective Pt layer changes the near surface charge density of CeO2, it could also explain the observed surface features. Further work is needed to clarify the near surface observations.
EELS for the irradiated region (5–50 nm) showed that the Ce3+/Ce4+ fraction decreased for the irradiated as well as for postirradiation annealed samples. However, the decrease in Ce3+/Ce4+ fraction as a function of depth took place much faster for the postirradiation annealed sample as compared to the irradiated sample, and all the measured values for the annealed sample were systematically lower than the ones for irradiated samples over the measured region. Furthermore, the Ce3+/Ce4+ fraction for the annealed sample was similar to the nonirradiated sample below the depth of 10–20 nm, while the Ce3+/Ce4+ fraction for the as-irradiated sample never reach the Ce3+/Ce4+ fraction of the nonirradiated sample. The observation indicates that the room-temperature irradiation has an effect on the stoichiometry via point defects. Previously, the argument on irradiation induced O vacancies has been suggested based on x-ray methods, Reference Ishikawa, Chimi, Michikami, Ohta, Ohhara, Lang and Neumann9,Reference Ohno, Iwase, Matsumura, Nishihata, Mizuki, Ishikawa, Baba, Hirao, Sonoda and Kinoshita21 and changes in the magnetic properties of irradiated CeO2. Reference Shimizu, Kosugi, Tahara, Yasunaga, Kaneta, Ishikawa, Hori, Matsui and Iwase7
Concluding from all the above said, the lattice recovery observed upon postirradiation annealing of low-temperature Xe-irradiated CeO2 is likely to originate from the annihilation of O vacancies, but also from the evolution of irradiation damage.
V. CONCLUDING REMARKS
Evolution of CeO2 properties upon heavy ion implantation has been reported in great detail. In the present work, combined efforts from STEM-EELS and GI-XRD observations upon Xe-ion irradiation and postirradiation annealing were presented. A lattice expansion was observed upon irradiation by GI-XRD measurements. Postirradiation annealing removed the lattice expansion. EELS indicated that the CeO2 surface contained O vacancies before and after annealing, but annealing tends to reduce the amount of these vacancies at the irradiated region. The O vacancies have been proposed to induce lattice expansion in CeO2. However, also the displacement damage upon low temperature irradiation is known to expand the lattice constant in ionic fluorite crystals. The lattice recovery upon thermal annealing at O containing environment may explain the lattice recovery via annihilation of O vacancies, but evolution of point defects and formation of extended defects may contribute to the observed lattice recovery in XRD as well. A logical next step for this work is to apply the experiments, ideas, and theory to UO2, which is known to show a variety of phases depending on the external thermo-chemical properties. Reference McEachern and Taylor34
ACKNOWLEDGMENTS
B. Valderrama and H. Hunter from University of Florida are acknowledged for their efforts in TEM lamella fabrication by FIB. The ion irradiation was supported by Center for Integrated Nanotechnologies, a DOE nanoscience center jointly operated by Los Alamos and Sandia National Laboratories. This work was supported as a part of the Center for Materials Science of Nuclear Fuel, an Energy Frontier Research Center funded by the U.S. Department of Energy, Office of Science, Office of Basic Energy Sciences.