Introduction
Scandentia (treeshrews) is an order of small-bodied, Indomalayan mammals composed of two families. Tupaiidae is the more speciose of the two, comprising the genera Tupaia, Dendrogale, and the monospecific Anathana. By contrast, Ptilocercidae includes only a single extant species, Ptilocercus lowii Gray, Reference Gray1848. Among living treeshrews, Pt. lowii is the most plesiomorphic; as such, this taxon is often considered a good living model for extinct euarchontans and, particularly, early primates (Sargis, Reference Sargis2001, Reference Sargis2002, Reference Sargis2004; Bloch et al., Reference Bloch, Silcox, Boyer and Sargis2007). During the period in which treeshrews were considered primates, they were the focus of study from a number of perspectives (e.g., Carlsson, Reference Carlsson1922; Le Gros Clark, Reference Le Gros Clark1924, Reference Le Gros Clark1925; Saban, Reference Saban1963; Napier and Napier, Reference Napier and Napier1967). As this view became less broadly accepted (e.g., Van Valen, Reference Van Valen1965; McKenna, Reference McKenna1966; Butler, Reference Butler, Joysey and Kemp1972; Luckett, Reference Luckett and Luckett1980), study of treeshrews decreased. However, interest in the order Scandentia has experienced a revival within the past two decades. For example, several recent studies have examined the relationship of treeshrews with regard to primates and colugos in Euarchonta (e.g., Sargis, Reference Sargis2002, Reference Sargis2004, Reference Sargis, Ravosa and Dagosto2007; Bloch et al., Reference Bloch, Silcox, Boyer and Sargis2007; Ni et al., Reference Ni, Gebo, Dagosto, Meng, Tafforeau, Flynn and Beard2013; O'Leary et al., Reference O'Leary2013; Chester et al., Reference Chester, Bloch, Boyer and Clemens2015; Li and Ni, Reference Li and Ni2016). The complex taxonomy within the order has also received a lot of attention recently. For example, several analyses have used morphometrics (e.g., Sargis et al., Reference Sargis, Woodman, Reese and Olson2013a, Reference Sargis, Woodman, Morningstar, Reese and Olsonb, Reference Sargis, Campbell and Olson2014a, Reference Sargis, Woodman, Morningstar, Reese and Olsonb, Reference Sargis, Woodman, Morningstar, Bell and Olson2017) to assess species boundaries among extant treeshrew taxa. Furthermore, Roberts et al. (Reference Roberts, Sargis and Olson2009, Reference Roberts, Lanier, Sargis and Olson2011) analyzed molecular data to assess the phylogenetic relationships of treeshrews and found that Urogale is not a distinct genus from Tupaia. They also used molecular evidence to show that T. moellendorffi Matschie, Reference Matschie1898 is not a distinct species from T. palawanensis Thomas, Reference Thomas1894, a conclusion that is supported by morphological evidence as well (Sargis et al., Reference Sargis, Campbell and Olson2014a).
A handful of studies have also sought to understand the ecology of living treeshrews. Emmons (Reference Emmons2000) wrote the most comprehensive analysis of treeshrew ecology currently available, addressing topics such as habitat use and activity patterns, diet and foraging, social behavior, and life history. There are also some studies that took a more general approach to examining the ecology of various species (e.g., Langham, Reference Langham1982, Reference Langham1983; Timmins et al., Reference Timmins, Duckworth, Robson and Walston2003; Kvartalnov, Reference Kvartalnov2009). Although the diet of treeshrews has not been as extensively studied as the diet of primates, Emmons (Reference Emmons1991, Reference Emmons2000), Langham (Reference Langham1982, Reference Langham1983), Wiens et al. (Reference Wiens, Zitzmann, Lachance, Yegles, Pragst, Wurst, von Holst, Guan and Spanagel2008), and Clarke et al. (Reference Clarke, Moran and Chin2010) have examined the dietary patterns of extant treeshrews and found that they consume mainly a variable mix of fruit and insects.
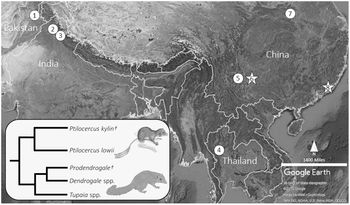
What currently remains very poorly understood is the handful of fossil treeshrew taxa that have been described in the literature. To date, some seven fossil species have been named (Table S1, Fig. 1; see Sargis, Reference Sargis2004; Li and Ni, Reference Li and Ni2016), whereas other specimens remain unassigned to a particular taxon within Scandentia. This is the case for the Miocene ptilocercid noted by Ni and Qiu (Reference Ni and Qiu2002, Reference Ni and Qiu2012) from Yuanmou, China, which may represent a new genus; the Pliocene rib cage of a possible species of Tupaia from the Upper Siwaliks of India (Dutta, Reference Dutta1975); and the Miocene tupaiid skull fragment and teeth from the Siwaliks of Pakistan (Jacobs, Reference Jacobs and Luckett1980). Aside from a recent phylogenetic analysis (Li and Ni, Reference Li and Ni2016) that included two fossil treeshrew species (Ptilocercus kylin Li and Ni, Reference Li and Ni2016 and Prodendrogale engesseri Ni and Qiu, Reference Ni and Qiu2012), and the suggestion that the Miocene and Oligocene ptilocercids are likely similar to living Ptilocercus (Ni and Qiu, Reference Ni and Qiu2002; Li and Ni, Reference Li and Ni2016) in their habits, there is very little known about extinct treeshrew systematics or ecology, in part due to the paucity of fossils.
Approximate positions of the localities of the currently known fossil treeshrew taxa. See Table S1 for more details. 1, Tupaiidae (Jacobs, Reference Jacobs and Luckett1980); 2, Tupaia sivalicus (Chopra and Vasishat, Reference Chopra and Vasishat1979; Chopra et al., Reference Chopra, Kaul and Vasishat1979; Luckett and Jacobs, Reference Luckett and Jacobs1980); 3, Tupaia sp. (Dutta, Reference Dutta1975); 4, Tupaia miocenica (Mein and Ginsburg, Reference Mein and Ginsburg1997); 5, Prodendrogale engesseri, Tupaia storchi (Ni and Qiu, Reference Ni and Qiu2012), and Ptilocercidae (an unnamed specimen) (Ni and Qiu, Reference Ni and Qiu2002, Reference Ni and Qiu2012); 6, Ptilocercus kylin (Li and Ni, Reference Li and Ni2016); 7, Eodendrogale parvum (Tong, Reference Tong1988); 8, Prodendrogale yunnanica (Qiu, Reference Qiu1986). Stars represent taxa included in the current analysis. Inlaid are the hypothesized evolutionary relationships of the included taxa based on previous, character-based analyses (Qiu, Reference Qiu1986; Li and Ni, Reference Li and Ni2016). †Indicates extinct taxon. Pt. lowii and T. belangeri illustrations adapted from those of Joseph Wolf and Joel Sartore, respectively.

Dental morphology has contributed little in terms of clarifying treeshrew systematics in the past (see Steele, Reference Steele1973; Butler, Reference Butler and Luckett1980; Olson et al., Reference Olson, Sargis and Martin2004), which is problematic as most treeshrew fossils are dentognathic (Table S1). Selig et al. (Reference Selig, Sargis and Silcox2019a) used three-dimensional (3D) geometric morphometric analysis (GMA) to study the lower second molar (m2) morphology of extant treeshrew species as a means for exploring patterns of variation and systematics within the order. They found that the two treeshrew families, Ptilocercidae and Tupaiidae, were well separated in morphospace. Moreover, they noted that many individual species plotted within morphospace in a pattern consistent with clades identified in a molecular study (Roberts et al., Reference Roberts, Lanier, Sargis and Olson2011), which implies that the morphology of the m2 tracks aspects of phylogeny among treeshrews.
In a subsequent analysis, Selig et al. (Reference Selig, Sargis and Silcox2019b) used dental topographic analysis (DTA) to examine patterns of functional dental morphology and diet in a sample of extant treeshrews. They found that treeshrews do not vary greatly in overall patterns of functional dental morphology, with much lower levels of variation than seen in primates. They did find evidence, however, for some important differences in the dietary patterns among extant scandentians. For example, they found that taxa such as T. dorsalis Schlegel, Reference Schlegel1857, T. belangeri (Wagner, Reference Wagner1841), D. melanura (Thomas, Reference Thomas1892), and Pt. lowii are the best adapted to an insectivorous diet, whereas T. salatana (Lyon, Reference Lyon1913), T. gracilis Thomas, Reference Thomas1893, T. minor Günther, Reference Günther1876, and T. palawanensis are better adapted for the consumption of fruit, judging from the varying levels of molar curvature, complexity, and relief. Overall, they found that dental topography is useful for examining patterns of variation within the dietary morphospace of Scandentia. Although the GMA (Selig et al., Reference Selig, Sargis and Silcox2019a) and DTA (Selig et al., Reference Selig, Sargis and Silcox2019b) examined the morphology of the m2 in extensively overlapping samples of treeshrews, the differences in the methodology used in each analysis provided complementary and nonredundant results. Evans (Reference Evans2013) and Winchester (Reference Winchester2016a) proposed that GMA is a ‘shape specifier’ approach to analyzing morphology as it captures the specific geometries of form, relating the position of landmarks to one another within morphospace. As such, GMA picks up on morphology more strongly related to genetics rather than to the physical properties of foods that are consumed. Alternatively, DTA provides a landmark-free method for analyzing form, and as such this method is a ‘shape descriptor,’ providing a means for measuring more functional aspects of dental morphology rather than strictly comparing the positions of cusps and other landmarks. Therefore, when both methods are used to examine the morphology of the same structures, they capture somewhat different types of information.
In the following, we have built on the analyses of Selig et al. (Reference Selig, Sargis and Silcox2019a, Reference Selig, Sargis and Silcoxb) by expanding the sample to include the two casts of extinct treeshrew species that were available for study: Prodendrogale yunnanica Qiu, Reference Qiu1986 (IVPP V8282.13) (Fig. S1) from the latest Miocene of China (Qiu, Reference Qiu1986) and Ptilocercus kylin (IVPP V20696) (Fig. S1) from the early Oligocene of China (~34 Ma) (Li and Ni, Reference Li and Ni2016). A previous study suggested that Pr. yunnanica is closely related to the extant genus Dendrogale on the basis of the overall pattern of resemblance between these two taxa (Qiu, Reference Qiu1986) (Fig. 1). Ptilocercus kylin is the oldest definitive evidence of a crown scandentian (Li and Ni, Reference Li and Ni2016). It has been hypothesized that Pt. kylin is an extinct sister taxon to the extant Pt. lowii on the basis of a phylogenetic analysis of 1,857 dental, cranial, postcranial, soft-tissue, and molecular characters (Li and Ni, Reference Li and Ni2016) (Fig. 1). Li and Ni (Reference Li and Ni2016) proposed that the morphology of Ptilocercus is highly conserved given the general resemblance of Pt. kylin to Pt. lowii and suggested that this may be a result of a relatively stable ecological niche in ptilocercids throughout the Cenozoic. Others have made similar arguments based on the apparently conservative morphology of Pt. lowii, suggesting that certain dietary habits of ptilocercids, such as the intensive intake of alcoholic nectar, may have remained unchanged over the past >55 million years (Wiens et al., Reference Wiens, Zitzmann, Lachance, Yegles, Pragst, Wurst, von Holst, Guan and Spanagel2008; Li and Ni, Reference Li and Ni2016). We used both GMA and DTA to examine the morphological distinctiveness and dietary adaptations of these two fossil treeshrew species.
Materials and methods
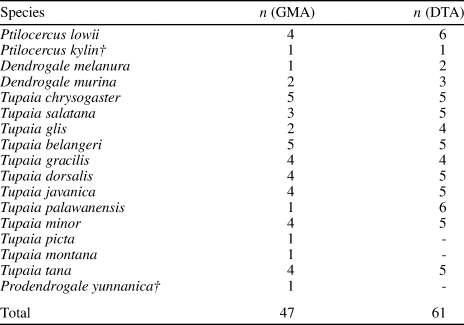
The samples included in our analyses are listed in Tables 1 and S2. Mandibles from a mixed sample of extant males and females were downloaded from MorphoSource (Boyer et al., Reference Boyer, Gunnell, Kaufman and McGeary2016) or were scanned on a Nikon XT H 225 ST High Resolution X-ray CT Scanner at the Shared Materials Instrumentation Facility at Duke University. Voxel sizes range from 10 to 29 μm. Treeshrews lack sexual dimorphism (Emmons, Reference Emmons2000, table 2.2), so mixing males and females should not add additional variation into our analyses. Mandibles were scanned so that the m2s could be analyzed. In total, the sample includes specimens representing 15 extant species and 2 extinct species (Table 1). The GMA comprises 47 specimens in total, including single specimens of both Pr. yunnanica and Pt. kylin. The specimen of Pr. yunnanica was scanned in a Scanco Medical μCT 35 machine housed in the Department of Internal Medicine at Yale University, whereas the cast of Pt. kylin was scanned in a General Electric phoenix v|tome|x s240 housed at the American Museum of Natural History Microscopy and Imaging Facility Computed Tomography Laboratory. The molars included in the GMA are relatively unworn, with little to no wear on the cusp tips, so that landmarks can be placed accurately. The sample for the DTA comprises 61 specimens in total, including the cast of the holotype of Pt. kylin. The hypoconid on the specimen of Pr. yunnanica is broken, so it could not be included in the DTA. The molars of these specimens are relatively unworn; however, some specimens may be characterized by slightly greater wear than those used in the GMA analysis because worn teeth can be included in analyses using dental topographic metrics (e.g., Ungar and M'Kirera, Reference Ungar and M'Kirera2003; Dennis et al., Reference Dennis, Ungar, Teaford and Glander2004; Pampush et al., Reference Pampush, Spradley, Morse, Harrington, Allen, Boyer and Kay2016b). As a result, the sample for the DTA is larger than that used for the GMA. For both analyses, no specimens exhibiting exposed dentine in the occlusal basin were included, a phenomenon that happens relatively quickly as the teeth are worn in thin-enameled taxa such as treeshrews (see Selig et al., Reference Selig, López-Torres, Sargis and Silcox2019c), indicating that the specimens are at most lightly worn.
Species and number of specimens (n) included in the GMA and DTA. †Indicates extinct taxon.

Using Avizo 9.01 (Visualization Sciences Group, 2009), micro-CT scans were opened and the m2s were segmented to remove adjacent teeth. Once segmented, the meshes were cropped along the cervix to isolate the crown following standard conventions for dental topographic analyses (e.g., Boyer, Reference Boyer2008; Bunn et al., Reference Bunn, Boyer, Lipman, St. Clair, Jernvall and Daubechies2011; Prufrock et al., Reference Prufrock, López-Torres, Silcox and Boyer2016b). The cropped surfaces were simplified to 10,000 faces and smoothed 100 iterations with the lambda set at 0.6 to remove noise irrelevant to the morphology of the meshes (Bunn et al., Reference Bunn, Boyer, Lipman, St. Clair, Jernvall and Daubechies2011; Pampush et al., Reference Pampush, Winchester, Morse, Vining, Boyer and Kay2016a; Prufrock et al., Reference Prufrock, Boyer and Silcox2016a, Reference Prufrock, López-Torres, Silcox and Boyerb; Winchester, Reference Winchester2016a; Spradley et al., Reference Spradley, Pampush, Morse and Kay2017; López-Torres et al., Reference López-Torres, Selig, Prufrock, Lin and Silcox2018). These protocols have been adapted for the analysis of dental topography; however, geometric morphometric landmarks can still be successfully and accurately placed on the resulting meshes (see Selig et al., Reference Selig, Sargis and Silcox2019a).
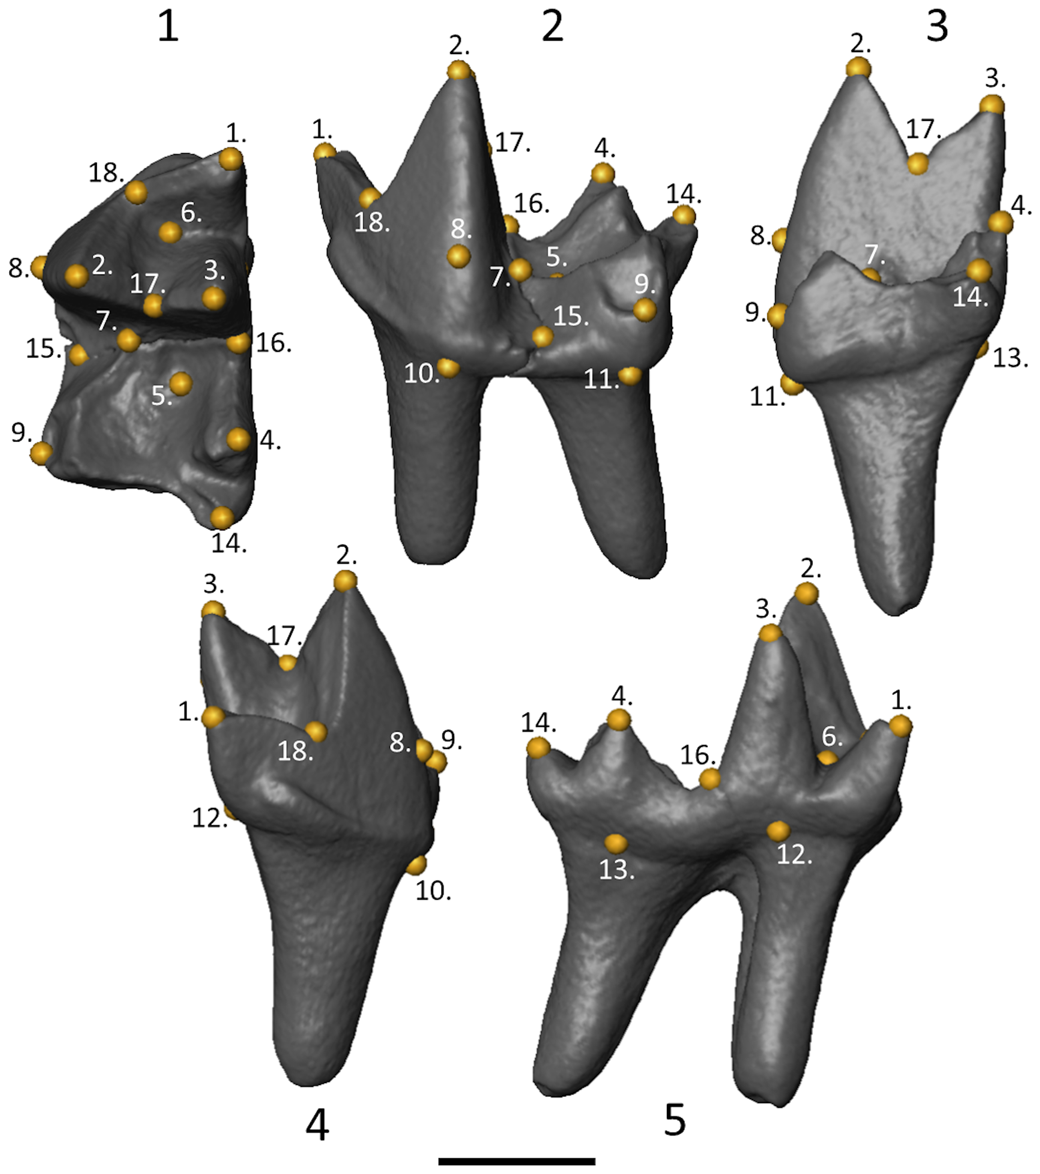
For the GMA, we collected 18 landmarks representing tips of cusps, regions where anatomical features meet, widest points along curves, and low points along crests (Fig. 2). These landmarks are the same as those collected by Selig et al. (Reference Selig, Sargis and Silcox2019a); a closely related set of landmarks was assessed in an error study by Cooke (Reference Cooke2011) and found to be highly repeatable. As the hypoconid of Pr. yunnanica is broken, the landmark at the tip of the cusp was omitted from this analysis. Landmark 9 (widest point on hypoconid) in the present analysis was not omitted, however, as the specimen of Pr. yunnanica still exhibits this landmark. This landmark was placed with the tooth mesh in occlusal orientation, but the mesh was rotated from all angles to ensure that it was placed correctly. Given that the buccal margin of the hypoconid shifts lingually toward the cusp tip, we are confident in the placement of this landmark at the widest point of the hypoconid on this specimen, even though the cusp tip is missing. We used the same landmark coordinates for the extant taxa as those collected by Selig et al. (Reference Selig, Sargis and Silcox2019a) with the addition of single specimens of P. lowii (YPM MAM 10179) and D. murina (Schlegel and Müller, Reference Schlegel and Müller1843) (UAM:Mamm:103000). Landmark coordinates were analyzed in PAST 3.14 (Hammer et al., Reference Hammer, Harper and Ryan2001), which was used for all statistical analyses. We applied generalized Procrustes superimposition, which eliminates variation in the landmark data caused by orientation, size, and translation so only variation in shape is represented. We then used principal components analysis (PCA) on the variance–covariance matrix to visualize how taxa plot in morphospace. Using the resulting PC scores of the first four PCs (which each explain at least 10% of the total variation, see below), we calculated mean PC scores for each genus of extant treeshrew and included those of each fossil taxon in an unweighted pair group method with arithmetic mean (UPGMA) cluster analysis to examine overall similarity among groups.
Landmarks included in the analysis placed on Prodendrogale yunnanica left m2 (IVPP V8282.13). (1) Occlusal; (2) buccal; (3) distal; (4) mesial; (5) lingual views. 1, Paraconid tip; 2, protoconid tip; 3, metaconid tip; 4, entoconid tip; 5, lowest point in talonid basin; 6, lowest point in trigonid basin; 7, where cristid obliqua meets trigonid; 8, widest point on protoconid (in occlusal view); 9, widest point on hypoconid (in occlusal view); 10, cervical point on protoconid; 11, cervical point on hypoconid; 12, cervical point below metaconid; 13, cervical point below entoconid; 14, distalmost point on postcristid (or hypoconulid); 15, lowest point on hypoflexid; 16, talonid notch; 17, protocristid notch; 18, lowest point on paracristid. Scale bar = 1 mm.

Once the meshes were prepared in Avizo, they were opened in MorphoTester (Winchester, Reference Winchester2016b) to conduct the DTA. Although several topographic metrics exist (e.g., Ungar and M'Kirera, Reference Ungar and M'Kirera2003; Dennis et al., Reference Dennis, Ungar, Teaford and Glander2004; Guy et al., Reference Guy, Gouvard, Boistel, Euriat and Lazzari2013, Reference Guy, Lazzari, Gilissen and Thiery2015; Ungar et al., Reference Ungar, Healy, Karme, Teaford and Fortelius2016; Berthaume et al., Reference Berthaume, Winchester and Kupczik2019), three of the most commonly used are Dirichlet normal energy (DNE; Bunn et al., Reference Bunn, Boyer, Lipman, St. Clair, Jernvall and Daubechies2011), 3D orientation patch count rotated (3D-OPCR; Evans et al., Reference Evans, Wilson, Fortelius and Jernvall2007; Winchester, Reference Winchester2016b), and relief index (RFI; M'Kirera and Ungar, Reference M'Kirera and Ungar2003; Ungar and M'Kirera, Reference Ungar and M'Kirera2003; Boyer, Reference Boyer2008). DNE is a measure of how much a surface deviates from being planar and measures the degree of curvature of a tooth, which relates to its ability to effectively shear foodstuffs (Bunn et al., Reference Bunn, Boyer, Lipman, St. Clair, Jernvall and Daubechies2011). Taxa with mechanically challenging diets, such as insectivores or folivores, tend to have teeth with higher DNE values, as their teeth have sharper crests and taller cusps. By contrast, frugivorous taxa tend to have significantly lower DNE values, as frugivores tend not to have teeth with well-developed shearing crests. The 3D-OPCR measures surface complexity on the basis of the number of discrete patches on a surface that face the same cardinal direction. As such, 3D-OPCR acts as a measurement of the number of ‘tools’ present on a tooth (Bunn et al., Reference Bunn, Boyer, Lipman, St. Clair, Jernvall and Daubechies2011) wherein higher 3D-OPCR values, and therefore more complex teeth, are found in taxa with more mechanically challenging diets such as insectivores or folivores, whereas frugivores tend to have simpler teeth. Finally, RFI measures crown height calculated as a natural log of the square root of the crown's 3D area divided by its 2D planimetric footprint (M'Kirera and Ungar, Reference M'Kirera and Ungar2003; Ungar and M'Kirera, Reference Ungar and M'Kirera2003; Boyer, Reference Boyer2008). Higher values are found for teeth that possess tall, sharp cusps and crests and tend to correlate with the consumption of insects or leaves, whereas low values indicate low, flat teeth, which relate to the consumption of fruit. As such, this method serves as a relative measure of hypsodonty. Although all three metrics tend to contrast among dietary guilds that differ in terms of mechanical complexity of their key food items, they operate on different scales, with DNE being very sensitive to subtle differences in the crown surface, 3D-OPCR being best suited to comparing quite different dental morphologies, and RFI falling somewhere in between (Prufrock et al., Reference Prufrock, López-Torres, Silcox and Boyer2016b). Note that these trends were established primarily in the study of primates. Although treeshrews were included in earlier studies of topographic trends (see Boyer, Reference Boyer2008; Bunn et al., Reference Bunn, Boyer, Lipman, St. Clair, Jernvall and Daubechies2011), contrasts noted by Selig et al. (Reference Selig, Sargis and Silcox2019b) and in the following are based on those established largely among other mammalian groups in light of the lack of ecological data for treeshrews (see Langham, Reference Langham1982; Emmons, Reference Emmons1991, Reference Emmons2000; see Selig et al., Reference Selig, Sargis and Silcox2019b for a summary of available dietary information).
The RFI values produced by MorphoTester are simply the ratio of the 3D surface area of the mesh over the 2D area of the crown. To make our results consistent with those of Selig et al. (Reference Selig, Sargis and Silcox2019b) and others (e.g., Boyer, Reference Boyer2008; Bunn et al., Reference Bunn, Boyer, Lipman, St. Clair, Jernvall and Daubechies2011; López-Torres et al., Reference López-Torres, Selig, Prufrock, Lin and Silcox2018), we recalculated RFI as the natural log of the square root of the crown's 3D area divided by its 2D area. Although species-level differences in topographic values were examined previously (see Selig et al. Reference Selig, Sargis and Silcox2019b), we used Bonferroni-corrected Mann-Whitney U tests to examine differences among genera. To examine how Pt. kylin plots with regard to the morphospace of the sampled extant treeshrew taxa, we performed a PCA of the topographic variables on the covariance matrix by including Pt. kylin in the analysis of Selig et al. (Reference Selig, Sargis and Silcox2019b) with the addition of the single specimens of Pt. lowii (YPM MAM 10179) and D. murina (UAM:Mamm:103000). We used the species means of the extant taxa in the PCA.
Finally, we used reduced major axis (RMA) regression to determine whether dental topography has any effect on the GMA and the plotting of taxa within the GMA morphospace. To do so, we calculated average PC scores for PC 1 for each species from both the GMA and DTA. We included only specimens that were used in both analyses.
Repositories and institutional abbreviations
American Museum of Natural History, New York, NY (AMNH); Field Museum of Natural History, Chicago, IL (FMNH); Institute of Vertebrate Paleontology and Paleoanthropology, Chinese Academy of Sciences, Beijing, China (IVPP); Museum of Comparative Zoology, Harvard University, Cambridge, MA (MCZ); University of Alaska Museum of the North, Fairbanks, AK (UAM); University Museum of Zoology, Cambridge, England (UMZC), United States National Museum of Natural History, Smithsonian Institution, Washington, DC (USNM); Yale Peabody Museum of Natural History, Yale University, New Haven, CT (YPM).
Results
GMA
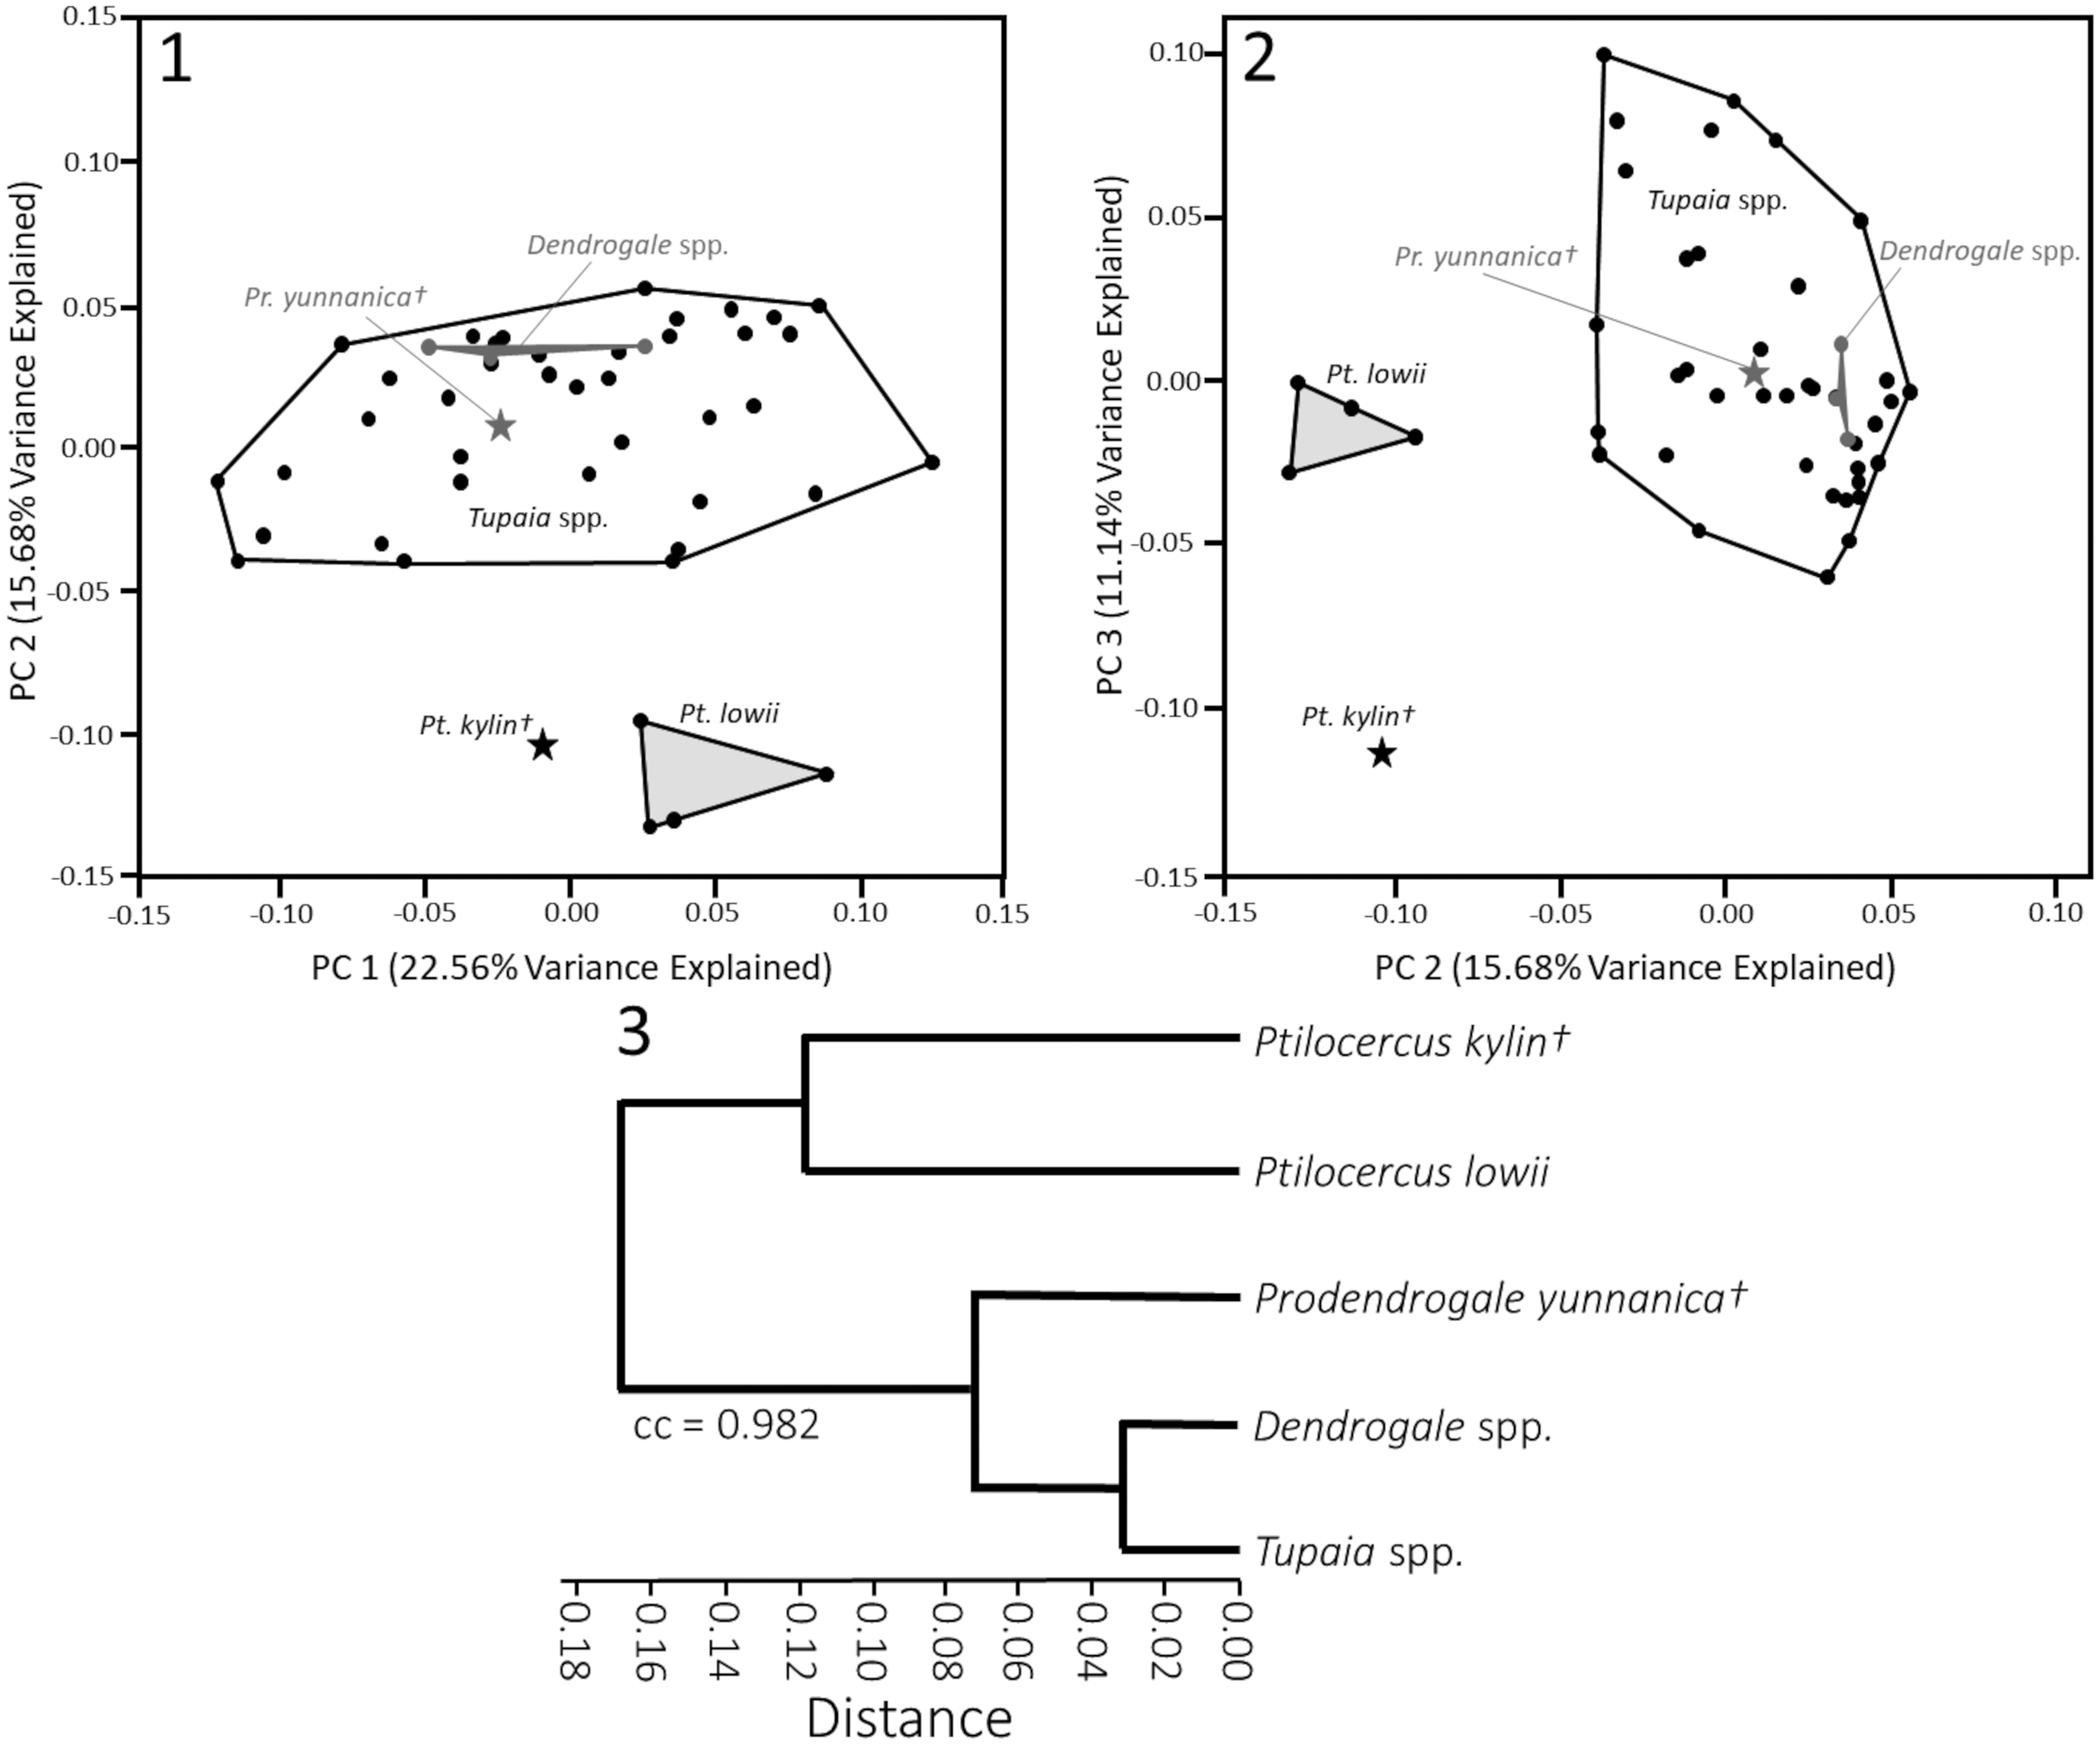
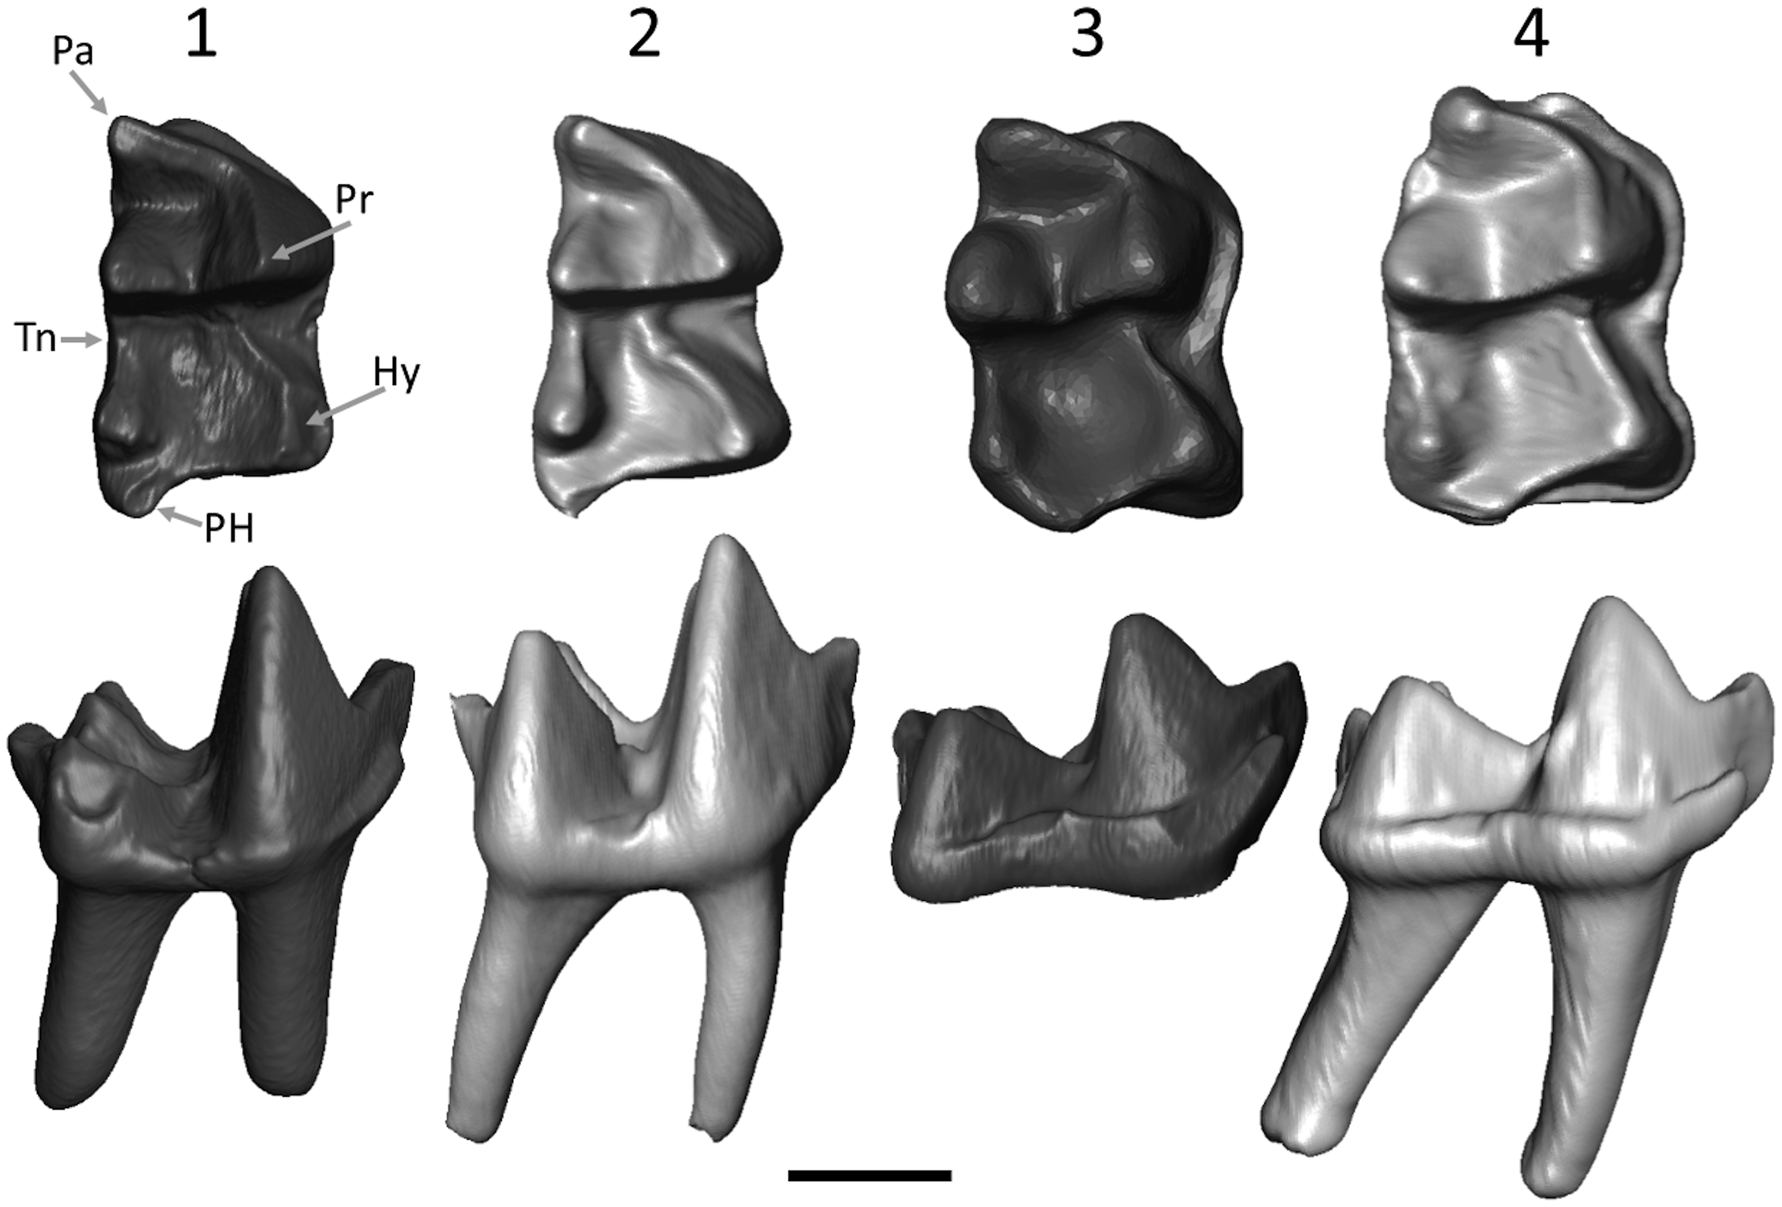
The GMA identified four PCs that each explain at least 10% of the total variation and 59.69% of the cumulative variation in the sample (Table S3). Along PC1, which explains 22.56% of the total variation, there is little separation among the included genera (Fig. 3.1). Pr. yunnanica overlaps with both Dendrogale and Tupaia, whereas Pt. kylin overlaps with the tupaiids and plots near, though not among, the specimens of extant Ptilocercus lowii. Selig et al. (Reference Selig, Sargis and Silcox2019a) found that PC1 mainly distinguished among various species of Tupaia and does not distinguish among the treeshrew genera or families. They found that taxa with lower values on PC1 plot in negative morphospace and are largely characterized by a narrower crown, a mesially shifted paraconid, and a protoconid that is taller and wider toward the cervix relative to taxa that plot in positive morphospace. With the exception of the taller protoconid, these differences are evident in the comparison between Pt. kylin (Fig. 4.3) and Pt. lowii (Fig. 4.4), which plot separately along this axis (Fig. 3.1).
(1) Bivariate plot of principal components 1 and 2 and (2) bivariate plot of principal components 2 and 3 from the geometric morphometric analysis of the Procrustes transformed landmark data. (3) Dendrogram of the UPGMA cluster analysis based on the generic-level average PC scores from the first four PCs. The cophenetic correlation (cc) is high, indicating that the dendrogram is an accurate representation of the pairwise distances among taxa. †Indicates extinct taxon.

Micro-CT renderings of the occlusal (top) and buccal (bottom) aspects of m2 of (1) Prodendrogale yunnanica (IVPP V8282.13; mirrored), (2) Dendrogale murina (UAM:Mamm:103000), (3) Ptilocercus kylin cast (IVPP V20696), and (4) Ptilocercus lowii (USNM 488052) illustrating similarities between putative closely related species and differences between the two families. Arrows denote select features that distinguish taxa in the PCA, including the hypoconid (Hy), paraconid (Pa), protoconid (Pr), postcristid/hypoconulid (PH), and talonid notch (Tn). Scale bar = 1 mm.

PC2 (15.68% of the total variation) represents a lower crown and a mesially shifted paraconid and hypoconulid/postcristid relative to the rest of the tooth in taxa that plot in negative morphospace; variation along this axis separates Ptilocercus from the tupaiids (Fig. 3.1; Selig et al., Reference Selig, Sargis and Silcox2019a). In this analysis, along PC2 Dendrogale and Prodendrogale plot separately (Fig. 3.1), which reflects subtle differences in these features (Fig. 4.1, 4.2). When PC1 and PC2 are plotted together, the specimen of Pr. yunnanica plots among extant tupaiids, but it falls more closely to specimens of Tupaia than it does to those of Dendrogale (Fig. 3.1). Ptilocercus kylin is distinct from Pt. lowii, but it does plot closer to the Pt. lowii polygon than to that of the tupaiids.
PC3 explains 11.14% of the total variation and is characterized by taxa with a wider talonid basin, with a shallower talonid notch, and in which the widest point on the hypoconid shifts toward the cusp tip and away from the cervix, moving from positive to negative morphospace (Selig et al., Reference Selig, Sargis and Silcox2019a). The separation between Pt. kylin and Pt. lowii on this axis (Fig. 3.2) reflects the previously observed differences in talonid morphology discussed by Li and Ni (Reference Li and Ni2016). As in the case of PC1, PC3 does not distinguish among the extant genera, but it does distinguish Pt. kylin from the other taxa. When plotted with PC2, Pt. kylin plots in distinctive morphospace, whereas Pr. yunnanica plots among tupaiids, falling closer to specimens of Tupaia than to those of Dendrogale (Fig. 3.2).
Although PC4 explains over 10% of the total variation and is included in a subsequent analysis (see below), it is difficult to interpret when plotted because it does not distinguish among any extant treeshrew genera, with the Ptilocercus and Tupaia specimens overlapping completely. It only distinguishes between Pt. kylin and all other specimens. Therefore, it will not be discussed further.
The average PC scores for the first four PCs (Table S3) of each genus and the fossil taxa were included in the UPGMA cluster analysis (Fig. 3.3). The cophenetic correlation is high (cc = 0.982), which indicates that the dendrogram is accurately representing the pairwise distances among taxa. According to the UPGMA, Pt. kylin is most similar to Pt. lowii, whereas Pr. yunnanica is more similar to the extant tupaiids; however, the extant tupaiids, including Dendrogale, cluster to the exclusion of Pr. yunnanica. Although Pt. kylin and Pt. lowii cluster with one another, the high distance value calculated from the PC scores implies that they are more dissimilar from one another than any of the tupaiids are from each other (including Pr. yunnanica) on the basis of the specific geometries of the m2.
DTA
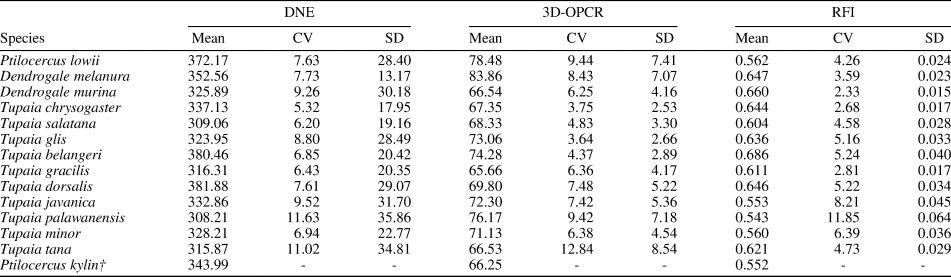
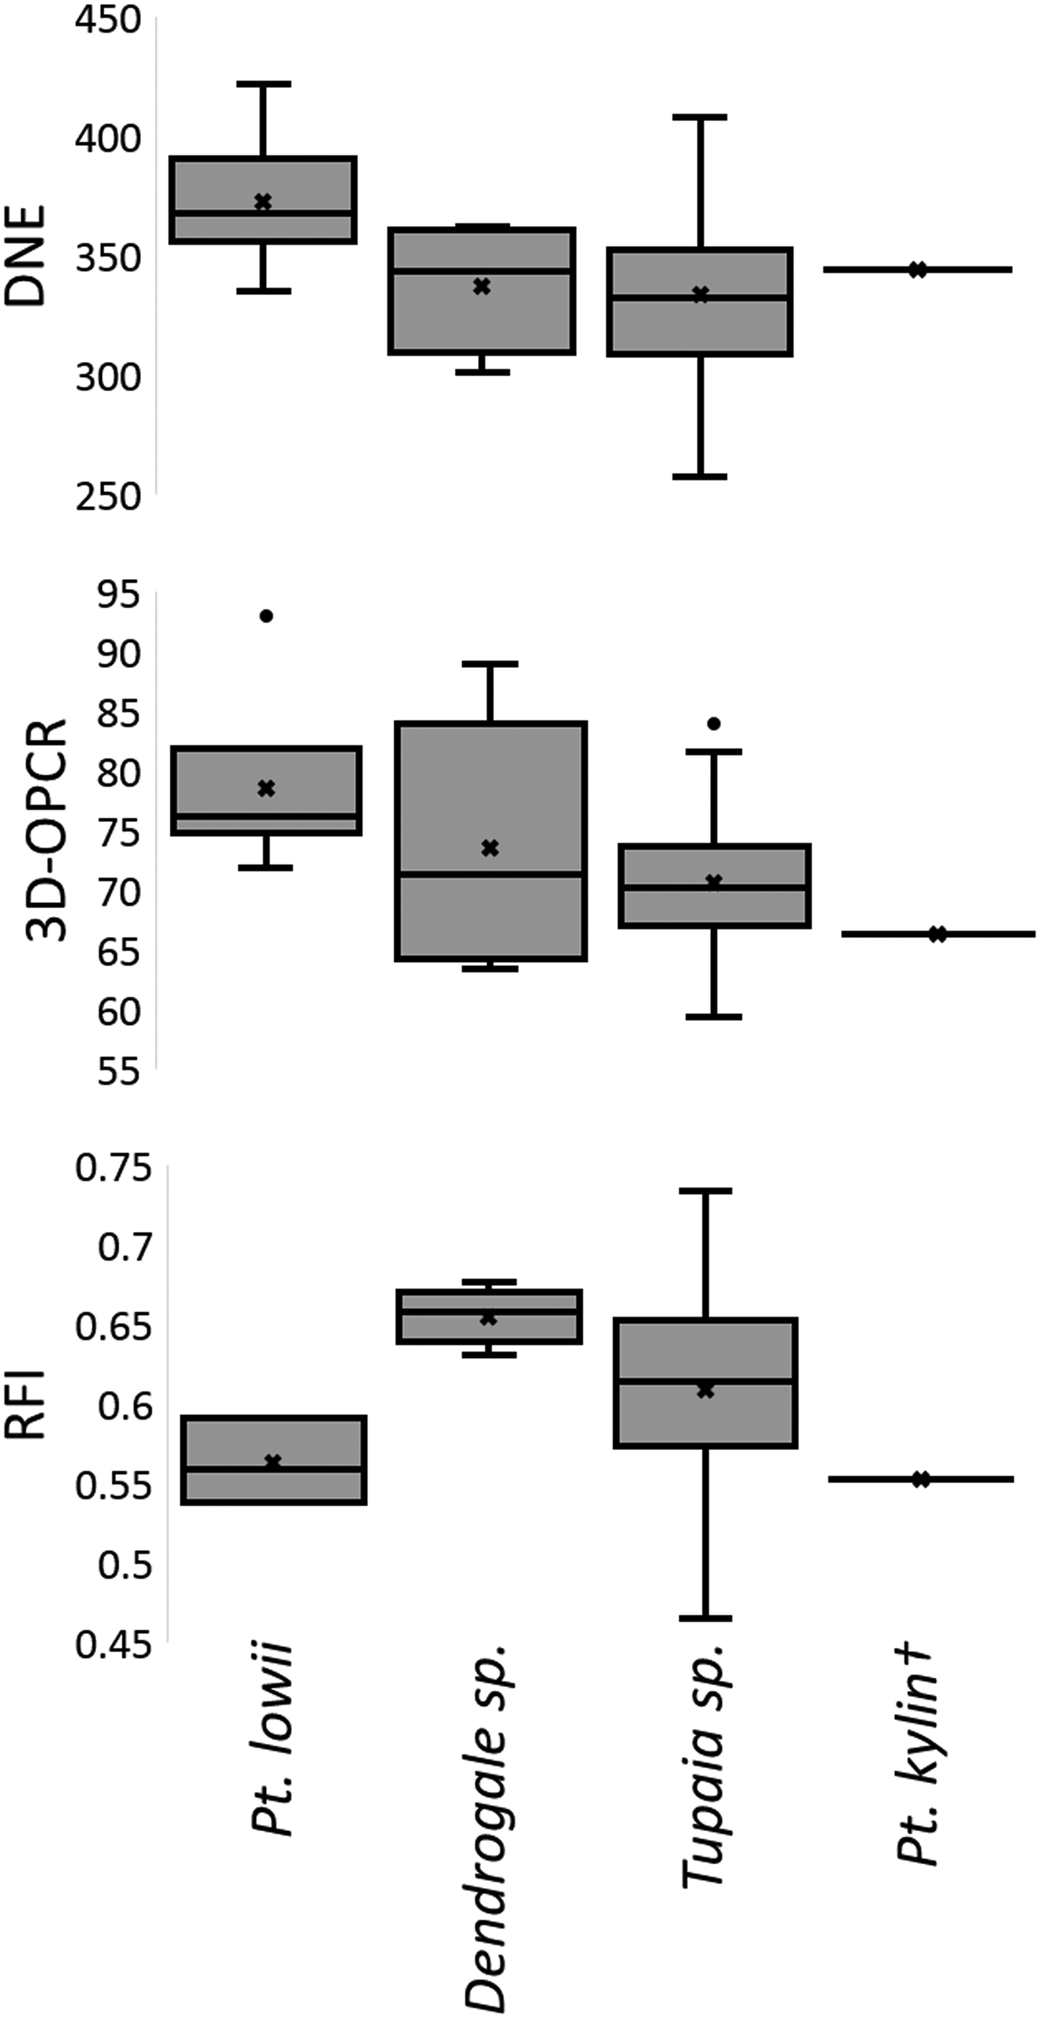
Results of the DTA are summarized in Table 2 and Figures 5 and 6. Results of the Mann-Whitney U test suggest that there are significant differences between Ptilocercus and Tupaia (p = 0.034) but not between Ptilocercus and Dendrogale (p = 0.060) or Dendrogale and Tupaia (p = 1) on the basis of the measurement of DNE. According to the measurement of 3D-OPCR, only Ptilocercus and Tupaia differ significantly (p = 0.037; Dendrogale versus Ptilocercus p = 1; Dendrogale versus Tupaia p = 0.965). There are no significant differences between Ptilocercus and Dendrogale (p = 0.060), Ptilocercus and Tupaia (p = 0.144), or Dendrogale and Tupaia (p = 0.160) on the basis of the measurement of RFI. For statistical analyses and discussion of differences among extant taxa at the species level, see Selig et al. (Reference Selig, Sargis and Silcox2019b).
Results of the dental topographic analysis listing the means, coefficients of variation (CV), and standard deviations (SD) for each taxon included in the analysis. The specimen of Prodendrogale yunnanica was not included in this analysis. †Indicates extinct taxon.

Box plots of the DTA results for DNE, 3D-OPCR, and RFI for each genus (and fossil species) included in the analysis. The X represents the mean, the horizontal lines represent the median, the boxes represent the upper and lower quartiles, and whiskers denote the highest and lowest values for each taxon. Note that Pt. lowii differs from the tupaiids in having low RFI values and relatively high DNE and 3D-OPCR values. Although Pt. kylin is similar to Pt. lowii in its RFI value, it is actually more tupaiid-like in having lower values for DNE and 3D-OPCR.

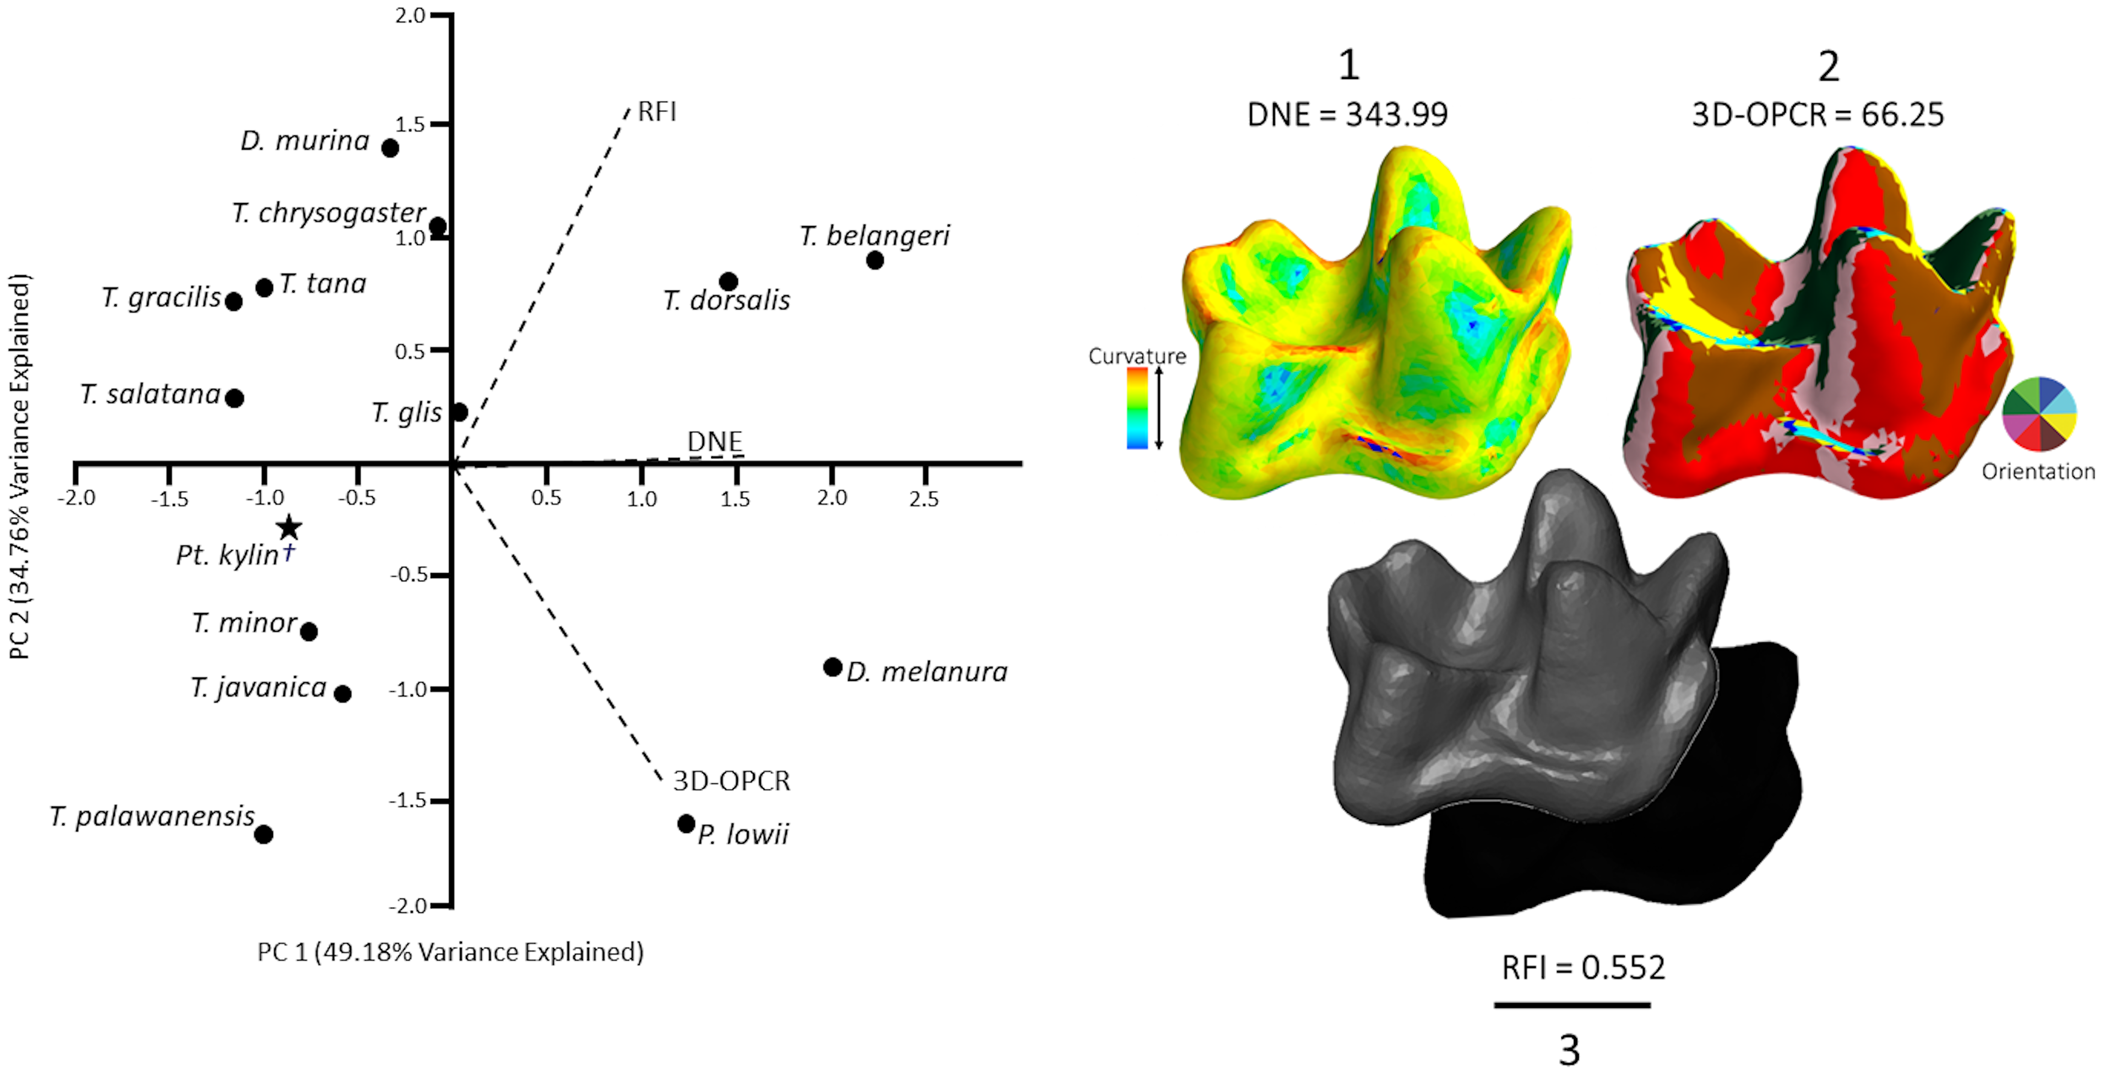
Left: plot depicting PC 1 and 2 of species means for all three topographic variables. The biplot indicates how curvature (DNE), complexity (3D-OPCR), and relief (RFI) load along the axes. Taxa inferred to be more insectivorous sit on the right side of the plot, whereas taxa inferred to be more frugivorous sit on the left. Right: reconstructed meshes showing the topographic maps of (1) DNE, (2) 3D-OPCR, and (3) RFI for the Ptilocercus kylin m2 cast (IVPP V20696). Scale bar = 1 mm.

Ptilocercus kylin is characterized by a DNE value of 343.99 and a 3D-OPCR value of 66.25, which are both considerably lower than the mean values reported for extant Ptilocercus (372.17 and 78.48, respectively), falling at the lower end of the range of Ptilocercus variation for DNE and outside the range of Ptilocercus variation for 3D-OPCR (Fig. 5). Ptilocercus lowii is characterized by a distinctive pattern of dental topography relative to other treeshrews included in the analysis of Selig et al. (Reference Selig, Sargis and Silcox2019b) by having high DNE and 3D-OPCR but low RFI. The absence of an ectoloph in Pt. kylin (Li and Ni, Reference Li and Ni2016) is likely why that taxon has a relatively low RFI (see below), within the range of Pt. lowii (Fig. 5). However, it more closely resembles the tupaiids in having lower DNE and 3D-OPCR values (Fig. 5). As such, this taxon has a more typical combination of dental topographic values than Pt. lowii, with low scores for all three metrics.
The PCA identified three PCs, of which the first two explain nearly 84% of the cumulative variation in the analysis (Table S3). The addition of two extant and one fossil specimen in the analysis does not change the results very much from those reported by Selig et al. (Reference Selig, Sargis and Silcox2019b). The first PC (49.18% of the total variation) should separate taxa based primarily on higher levels of insectivory in positive morphospace and more frugivory in negative morphospace on the basis of the fact that all three variables are loaded positively along PC1 (Table S4). According to Selig et al. (Reference Selig, Sargis and Silcox2019b), PC2 (34.76% of the total variation in the present analysis) may separate taxa on the basis of the physical properties of the food rather than strict differences between levels of insectivory and frugivory. It has previously been shown, for example, that taxa that consume the same plant species but differ in terms of which part of the plant they consume differ in terms of their molar complexity (Godfrey et al., Reference Godfrey, Winchester, King, Boyer and Jernvall2012). Similarly, treeshrews might differ in molar complexity due to differences in the mechanical properties of the insect and plant species they consume. In the plot of PCs 1 and 2 in the present analysis (Fig. 6), Pt. kylin plots in more frugivorous morphospace along PC1, near the mean values for T. tana Raffles, Reference Raffles1821 and T. palawanensis, taxa that are considered more frugivorous compared with taxa such as T. belangeri, T. dorsalis, D. melanura, and Pt. lowii (see Selig et al., Reference Selig, Sargis and Silcox2019b and references therein).
The RMA regression of species-average PC scores from the GMA and DTA suggests that dental topography does not have a significant effect on the plotting of taxa within the GMA morphospace (slope = –2.614, intercept = 6.366, R2 = 0.077, p = 0.338).
Discussion
A previous assessment of the dental morphology of Pr. yunnanica suggested that this taxon is closely related to and potentially the ancestor of Dendrogale (Qiu, Reference Qiu1986). A phylogenetic analysis that included another species of Prodendrogale, Pr. engesseri (Li and Ni, Reference Li and Ni2016), found that Prodendrogale and Dendrogale were likely sister taxa, although only one species of Dendrogale, D. melanura, was included in the study. The results of our analyses indicate that Pr. yunnanica is very similar in dental morphology to modern tupaiids, although it is not more similar to Dendrogale than it is to other tupaiids. In fact, our UPGMA cluster analysis groups modern tupaiids to the exclusion of Pr. yunnanica. Our PCA shows that Pr. yunnanica consistently plots closer to specimens of Tupaia than it does to those of Dendrogale. This could be a product of the smaller sample size representing Dendrogale, as it is likely that the true morphospace occupied by this genus is greater than that represented in our analysis. Alternatively, it could suggest that the phylogenetic position of Prodendrogale with respect to Tupaia and Dendrogale may warrant further consideration. In particular, Pr. yunnanica has never been included in a cladistic analysis; our results suggest that a closer relationship of this species to Dendrogale than to Tupaia is a hypothesis that should be tested further in a future phylogenetic analysis. Unfortunately, the hypoconid of the Pr. yunnanica specimen is broken, so its dental topography could not be measured, and its diet could not be assessed.
It has previously been suggested that Ptilocercus lowii is an example of a ‘living fossil,’ having gone relatively unchanged since at least the early Oligocene (Li and Ni, Reference Li and Ni2016). The results of our GMA do suggest that the early Oligocene Pt. kylin is more similar in dental morphology to extant Ptilocercus than it is to other members of Scandentia. Although the UPGMA cluster analysis does group Pt. kylin with Pt. lowii, it is notable that the distance between them is greater than that among all the tupaiids. Moreover, certain aspects of dental morphology, particularly functional aspects as inferred by DTA, suggest that Pt. kylin differs from Pt. lowii. The results of our topographic analysis suggest that Pt. kylin and Pt. lowii likely differed ecologically, with Pt. kylin showing a pattern of m2 morphology consistent with higher levels of frugivory than in extant Ptilocercus and more like that of Tupaia. Relief does not differ greatly between Pt. kylin and Pt. lowii, which potentially relates to the lack of an ectoloph on the upper molars in both taxa (see Selig et al., Reference Selig, Sargis and Silcox2019b), as having an ectoloph requires that lower molars be characterized by tall cusps to allow for proper occlusion during mastication. Therefore, the relatively brachydont lower molars of Ptilocercus may relate to their brachydont upper molars that lack ectolophs. However, Pt. kylin has lower curvature and complexity than Pt. lowii, suggesting that Pt. kylin may have been more reliant on fruit. Whereas the ptilocercids are similar in m2 morphology in that they both possess a buccal cingulum (Li and Ni, Reference Li and Ni2016) and low molar relief, the shearing ability and dental complexity of Pt. kylin is more comparable to that of extant tupaiids such as T. minor and T. javanica Horsfield, Reference Horsfield1824, which are hypothesized to be more frugivorous than Pt. lowii (Emmons, Reference Emmons2000; Selig et al., Reference Selig, Sargis and Silcox2019b). This suggests that Ptilocercus has not gone unchanged since the Oligocene, and it is likely that this taxon has varied in ecology through time. Although it is possible that certain dietary behaviors of extant Ptilocercus, such as feeding on alcoholic floral nectar (Wiens et al., Reference Wiens, Zitzmann, Lachance, Yegles, Pragst, Wurst, von Holst, Guan and Spanagel2008), were present in extinct species of Ptilocercus, our results suggest that the ecology of modern Ptilocercus cannot be assumed to mirror precisely the ecology of extinct species of Ptilocercus. These differences could reflect the geological age of this specimen, as it is likely that many of the prey and fruit species this animal would have consumed in the Oligocene would have been different from those available to treeshrews today. These differences could also reflect the fact that the specimen of Pt. kylin was recovered from an area much farther north than the current distribution of extant Ptilocercus, which could suggest that access to different prey species or plant resources may help explain the difference in inferred ecology between these two species.
Ptilocercus lowii is commonly regarded as a good modern analogue for the ancestral euarchontan and primate (Sargis, Reference Sargis2001, Reference Sargis2002, Reference Sargis2004; Bloch et al., Reference Bloch, Silcox, Boyer and Sargis2007). Selig et al. (Reference Selig, Sargis and Silcox2019b) found that the dental morphology of Pt. lowii is suggestive of high levels of insectivory relative to plesiomorphic stem primate taxa such as Purgatorius, which is the oldest known euarchontan to begin to rely partly on fruits (Chester et al., Reference Chester, Bloch, Boyer and Clemens2015; Silcox et al., Reference Silcox, Bloch, Boyer, Chester and López-Torres2017). This contrast may have been less marked with more plesiomorphic ptilocercids. Our findings highlight the fact that very little is known about extinct ptilocercids or extinct scandentians in general. Although Ptilocercus is monospecific today, it is possible that the ptilocercid evolutionary tree was bushier and more ecologically diverse in the past, especially given the potential adaptive differences in dental morphology between Pt. lowii and Pt. kylin.
Overall, our study demonstrates the value of using both 3D GMA and DTA in the study of fossil taxa. Our results provide further evidence that these methods offer complementary, nonredundant information on dental morphology, and both provide insight into important paleobiological questions. As in the case of Selig et al. (Reference Selig, Sargis and Silcox2019b), who found that the patterns of dental topography did not necessarily reflect those of the GMA (Selig et al., Reference Selig, Sargis and Silcox2019a), our results show that the functional morphology of the m2 of Pt. kylin is not necessarily well reflected by the specific geometry of occlusal features such as the position of cusps and other landmarks. If this were the case, we would expect Pt. kylin to plot closer to Pt. lowii in the topographic morphospace, as it does in the GMA. Therefore, both methods should be used in future analyses of fossil taxa.
Acknowledgments
We thank the curators and collections staff of the AMNH, FMNH, MCZ, UAM, UMZC, USNM, and YPM who allowed the scanning and/or upload of specimens to MorphoSource. We thank X. Ni (IVPP) for providing access to analyze the two fossil specimens and M. Fox (YPM) for preparing, molding, and casting Pr. yunnanica. We thank E. Hoeger, E. Westwig, B. O'Toole, and N. Duncan from the AMNH for facilitating the loan of several treeshrew specimens, L. Olson and A. Gunderson from the UAM for the loan of D. murina, and K. Zyskowski from the YPM for the loan of Pt. lowii. We also thank D. Boyer for accepting loans on our behalf and lending space in his lab for specimen preparation. We thank J. Gladman and C. Crawford of the Shared Materials Instrumentation Facility at Duke University, J. Van Houten of the Department of Internal Medicine, Yale University, and M. Hill and A. Smith of the Microscopy and Imaging Facility, American Museum of Natural History, for help with CT scanning specimens. We thank D. Ward for scanning and providing access to the CT scans of T. picta and T. montana from the UMZC. We thank J. Wolf and J. Sartore for producing the original images of Pt. lowii and T. belangeri in Figure 1. This research was supported by a grant from the University of Toronto Scarborough International Research Collaboration Fund and an NSERC Discovery Grant to MTS, a Pilot Research Grant from the Department of Anthropology and a School of Graduate Studies Research Travel Grant from the University of Toronto to KRS, and a PSC CUNY Award, jointly funded by The Professional Staff Congress and The City University of New York, to SGBC.
Accessibility of Supplemental Data
Data available from Dryad Digital Repository: https://doi.org/10.5061/dryad.kwh70rz1f.