Introduction
One of the greatest challenges for modern materials science is extending our knowledge and control of functional materials beyond ideal systems and equilibrium conditions. Studying materials under in operando conditions is challenging, because often they function far from equilibrium, with processes that occur at ultrafast time scales and at microscopic dimensions. X-ray free-electron lasers (FELs) provide extremely intense and ultrashort x-ray pulses to be able to image these processes as they occur at their natural femtosecond time scale and nanometer length scale.
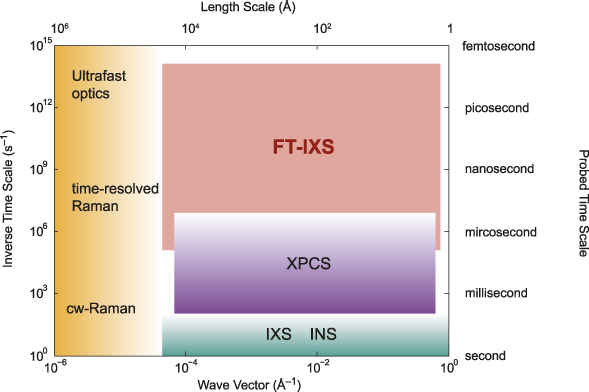
There are several scattering techniques available for probing materials dynamics. Figure 1 schematically shows the time scales and wave vectors (length scales) that each technique can access. Here, the y-axis indicates the time scale for the ultrafast processes of interest such as electron–phonon or phonon–phonon scattering. Ultrafast pump-probe optical spectroscopy can probe extremely fast transients, but is restricted to small momentum transfers, while conventional inelastic neutron (INS) or inelastic x-ray (IXS) scattering can probe large wave vectors with high-frequency resolution, but are restricted to equilibrium states and thus lack access to the short-lived transient states of interest here. The ultrashort x-ray pulses from x-ray FELs enable probing such transient dynamics with large wave vector and Angstrom spatial resolution.
Time scales and wavelength scales covered by various scattering techniques. Optical probes can only access near Q = 0, but can cover a wide range of time scales. Frequency-domain inelastic neutron and x-ray scattering can probe large wave vectors, but lack access to transient dynamics. Fourier transform inelastic x-ray scattering (FT-IXS) can cover a broad range of the missing space. Note: cw, continuous wave; XPCS, x-ray photon correlation spectroscopy; INS, inelastic neutron scattering; IXS, inelastic x-ray scattering.

While most ultrafast x-ray experiments to date have focused on probing the dynamics by looking at diffraction peaks, these typically only reflect the average long-range order of the material. While the Debye–Waller effect (decrease of the Bragg peak intensity due to thermal vibrations) can provide limited information on the disorder, the momentum dependence of the perturbations from perfect order is inaccessible from such measurements. X-ray FEL sources are sufficiently intense to probe the diffuse intensity between diffraction peaks with femtosecond resolution, and thus capture the dynamics of the deviations from perfect crystalline order.
As demonstrated, for perfect crystals of germanium in References Reference Trigo, Fuchs, Chen, Jiang, Cammarata, Fahy, Fritz, Gaffney, Ghimire, Higginbotham, Johnson, Kozina, Larsson, Lemke, Lindenberg, Ndabashimiye, Quirin, Sokolowski-Tinten, Uher, Wang, Wark, Zhu and Reis1 and Reference Zhu, Robert, Henighan, Lemke, Chollet, Glownia, Reis and Trigo2, the x-ray diffuse intensity at finite wave vector, q, in the Brillouin zone can exhibit oscillations due to inelastic scattering from phonons at those wave vectors when excited by a laser pump. Thus, provided the pump can induce a time-dependent coherence in the lattice at large wave vectors, the oscillatory dynamics of the diffuse intensity can be Fourier transformed to obtain the phonon dispersion of the material without additional monochromators or analyzers.Reference Trigo, Fuchs, Chen, Jiang, Cammarata, Fahy, Fritz, Gaffney, Ghimire, Higginbotham, Johnson, Kozina, Larsson, Lemke, Lindenberg, Ndabashimiye, Quirin, Sokolowski-Tinten, Uher, Wang, Wark, Zhu and Reis1 Since this scattering by phonons is inelastic, this was termed Fourier transform inelastic x-ray scattering (FT-IXS). As with any time-domain approach, the frequency resolution of this measurement is, in principle, only limited to the inverse of the measured time window, yielding extreme frequency resolution, particularly for low-frequency modes.Reference Zhu, Robert, Henighan, Lemke, Chollet, Glownia, Reis and Trigo2 More importantly, the dispersion obtained this way is that of the electronically excited state, and thus can be used to extract information on how electrons are coupled to the lattice.
Here, we review recent advances of FT-IXS for measuring lattice dynamics, particularly when applied to systems out of equilibrium or for probing rare events, such as phonon–phonon scattering, which are impossible to disentangle with conventional inelastic scattering methods. In the first section, we review the principle behind FT-IXS, followed by two examples of applications of this method to probing electron–phonon and phonon–phonon coupling effects in solids. Finally, we close with an overview of promising future directions. We note that a complementary technique, x-ray photon correlation spectroscopy (XPCS),Reference Sutton3 can potentially be extended to cover a similar range of time scales using split-and-delay x-ray optics.Reference Osaka, Hirano, Sano, Inubushi, Matsuyama, Tono, Ishikawa, Yamauchi and Yabashi4 This method is under active development and holds promise to measure the intermediate scattering function directly in the time domain. We refer the reader to other reviews on this topic.Reference Sutton3,Reference Shpyrko5
Principles of femtosecond x-ray diffuse scattering
In nearly perfect crystals, x-ray- (or neutron- or electron-) thermal diffuse scattering (TDS) measures the root-mean-square (rms) displacements of the atoms away from their nominal equilibrium positions due to thermal vibrations or phonons.Reference Warren6 For small displacements, the intensity at a given momentum transfer Q is approximately
 $$I\left( {\bf{Q}} \right) \approx {\left| F \right|^2} + 2\,{\rm{Re}}\left\{ {F\left( {{\bf{Q}}cdot {u_q}\left( t \right)} \right)} \right\} + {\left| {{\bf{Q}}cdot {u_q}\left( t \right)} \right|^2} = {I_0} + {I_1} + {I_2},$$
where F is the static structure factor, t is time, and u q(t) is the phonon amplitude at wave vector q. The first term, I 0, is the static elastic scattering from the average lattice and terms I 1 and I 2 are linear and quadratic in the phonon displacements, respectively. In a typical experiment, one measures a time average over the possible instances of the atomic positions, and since the thermal motion is uncorrelated, I(Q) does not depend on time. We assume that the crystal is harmonic, and thus in equilibrium, the linear term I 1 ∼ 〈u q(t)〉 = 0, since u q(t) is equally likely to be positive or negative. Thus, I 1 is negligible in most cases unless, for example, the pump pulse produces a coherent phonon, for which 〈u q(t)〉 ≠ 0. In this case, the expectation value is taken over the initial thermal distribution of phases and amplitudes. Unlike the linear term, I 2 is always present because 〈(Q· ${u_q}{)^2}$〉 ≠ 0 even in thermal equilibrium; this is the source of the Debye–Waller factor that diminishes the intensity of Bragg peaks and produces the thermal diffuse background.
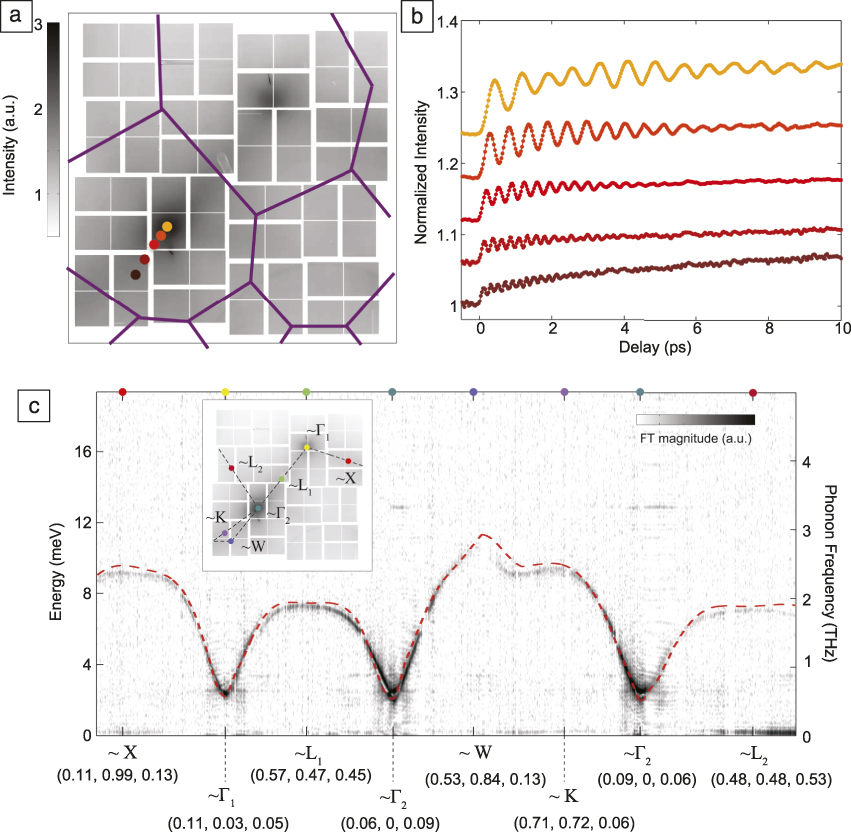
Figure 2a shows I(Q) for germanium at room temperature on a two-dimensional section of reciprocal space spanned by the Cornell-SLAC Pixel Array Detector (CSPAD).Reference Zhu, Robert, Henighan, Lemke, Chollet, Glownia, Reis and Trigo2 The dominant contribution here is I 2; the intensity distribution reflects the rms displacements due to the vibrations of germanium at room temperature. In a pump-probe situation, however, the pump can set an initial phase for all vibrations, and expectation values such as 〈(Q·u q(t))2〉 are not stationary but oscillate in time;Reference Garrett, Rojo, Sood, Whitaker and Merlin7 thus, if measured with sufficiently short x-ray pulses, I(Q, Δt) shows oscillations as a function of pump-probe delay, Δt, as seen in Figure 2b for a few representative q-points.
Fourier transform inelastic x-ray scattering from Ge at the Linac Coherent Light Source. (a) Two-dimensional (2D) section of reciprocal space showing the static x-ray diffuse scattering intensity of Ge at 300 K captured with the Cornell-SLAC pixel array detector. The purple lines indicate the boundaries of the Brillouin zone. (b) Differential dynamics of selected wave vectors (labeled with the same color as the corresponding points in [a]) showing that the diffuse intensity oscillates in time with a sub-picosecond time scale after the pump pulse strikes the sample. (c) The dispersion obtained along a 1D curve of the 2D data after a time Fourier transform (FT) of traces such as those in (b). The intensity scale (color bar, where darker color denotes higher intensity) is the magnitude of the FT and indicates the amplitude of the oscillations at each wave vector. The inset shows the selected path out of the 2D detector. Pixels near high-symmetry q-points (Χ, Γ1, Γ2, L1, L2, W, K) are indicated in cubic reciprocal lattice units and marked with colored dots in (c) and in the inset. The dashed red line is the lowest acoustic phonon branch calculated from harmonic forces.Reference Zhu, Robert, Henighan, Lemke, Chollet, Glownia, Reis and Trigo2 The dashed black line in the inset shows the 1D path taken to obtain the data in (c).

Photoexcitation in the optical regime can excite coherent phonons of significant amplitude,Reference Cheng, Vidal, Zeiger, Dresselhaus, Dresselhaus and Ippen8 but in crystals, this process is restricted to Raman-active modes (i.e., modes that modulate the polarizability of the material)Reference Cardona9 near q = 0, because the pump wave vector is small compared with the wave vector of the Brillouin zone edge. More generally, light can couple to the lattice to second order in the phonon amplitude, which is equivalent to a process where the pump creates pairs of excitations at any q and –q such that the total wave vector sums to zero;Reference Garrett, Rojo, Sood, Whitaker and Merlin7 this is, for example, how two-magnon excitations (deviations of the perfect magnetic order) are observed by light scattering in antiferromagnets. This provides effective coupling between the incident pump light to a continuum of modes spanning the Brillouin zone and explains how long-wavelength radiation can generate high-wave vector excitations without breaking wave vector conservation. Intuitively, ultrafast excitation of charge carriers produces an instantaneous step-like change, albeit small, in the spring constant (or the frequency) for all phonon modes in the crystal. Such a sudden step leaves each mode in a state in which the equilibrium position 〈u q(t)〉 = 0, but 〈u q2(t)〉 oscillates at twice the phonon frequency of the excited state, 2ω(q).Reference Garrett, Rojo, Sood, Whitaker and Merlin7 Recent work by Henighan et al.Reference Henighan, Trigo, Chollet, Clark, Fahy, Glownia, Jiang, Kozina, Liu, Song, Zhu and Reis10 showed that this second-order coupling is indeed the dominant mechanism that generates the vibrations in the x-ray diffuse intensity observed in Reference Reference Trigo, Fuchs, Chen, Jiang, Cammarata, Fahy, Fritz, Gaffney, Ghimire, Higginbotham, Johnson, Kozina, Larsson, Lemke, Lindenberg, Ndabashimiye, Quirin, Sokolowski-Tinten, Uher, Wang, Wark, Zhu and Reis1.
The Fourier transform (FT) of the oscillatory dynamics in I 2 (as those in Figure 2b) yields the second harmonic of the phonon dispersion along the sampled wave vectors. Figure 2c shows a one-dimensional (1D) slice of the FT of the full data set, which reveals the phonon dispersion along a particular cut of reciprocal space. Note that because the scattering vectors Q subtended the detector lie on a sphere, the 1D slice of the detector is not a straight line in Q-space, and in what follows, we specify the three coordinates of the wave vector when plotting such 1D slices. The dashed lines represent the calculated dispersion of the lowest phonon branch of germanium, and the inset shows the image of TDS along with the path taken (dashed line in inset). This geometry was chosen to avoid the intense Bragg peaks that could damage the detector, and because of this, the acoustic phonon branches do not reach zero frequency. Furthermore, the term 〈(Q·u q)2〉 provides a way to isolate the direction of the eigenvectors, since for a given scattering geometry, only modes with an appreciable projection along Q contribute to the intensity; this is the reason only one acoustic branch is visible in Figure 2c. Provided the ultrafast excitation can induce the phase coherence of the modes, the phonon dispersion can be obtained with extreme frequency resolution from a Fourier transform of the oscillatory dynamics in the diffuse intensity.
Thus far, we have only considered lattice motions that modulate the quadratic term in Equation 1 and assumed that I 1 ∼ 〈u q(t)〉 = 0. This linear term, however, is not necessarily zero and can oscillate if the pump produces coherent phonons. In crystals with few defects or impurities, this is only allowed for modes near q = 0 because the wave vector is conserved, and thus I 1 contributes to the Bragg peak intensity, but does not extend into the diffuse region of reciprocal space. This conservation of quasi-momentum is relaxed if the translational symmetry of the crystal is broken, providing a mechanism for generating large-wave vector coherent phonons.
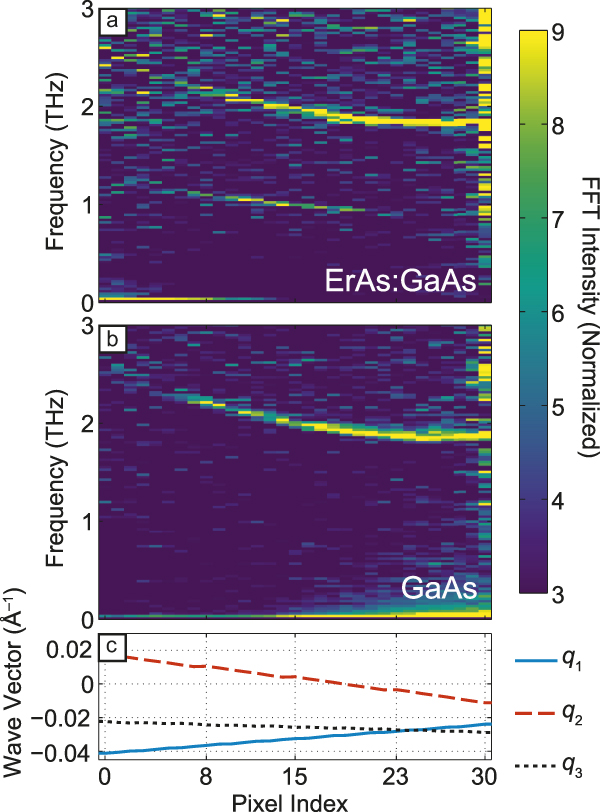
As an example, embedding ErAs nanoparticles in a GaAs matrix, thus breaking the translational symmetry of the GaAs substrate, allows for generation of coherent transverse acoustic (TA) phonons with a broad range of qs determined by the size of the ErAs islands.Reference Kozina, Trigo, Chollet, Clark, Glownia, Gossard, Henigan, Jiang, Lu, Majumdar, Zhu and Reis11 An FT-IXS experiment was performed on a superlattice of ErAs islands of typical size ∼2–4 nm in diameter grown epitaxially on a GaAs substrate. A double-sided polish finish to the GaAs substrate enabled using the reverse side of the wafer as the control sample. Figure 3 shows the dispersion of the lowest TA branch of GaAs obtained from a FT of the oscillations in the diffuse scattering along a 1D path in reciprocal space for the sample with and without the ErAs. The dispersion seen in Figure 3a–b near ∼2 THz is the second harmonic of the lowest TA branch of pure GaAs and originates from the I 2 term in Equation 1. On the other hand, the sample with ErAs inclusions, Figure 3a, has an additional feature at half the TA frequency, near ∼1 THz, which originates from I 1 in Equation 1. Since I 1 is linear in the displacements, it oscillates at the fundamental phonon frequency rather than at the second harmonic.
Fourier transform inelastic x-ray scattering (FT-IXS) spectrum similar to Figure 2c for (a) the ErAs:GaAs sample and (b) pure GaAs along a curved path in reciprocal space. The common dispersive feature in (a) and (b) at ∼ 2 THz frequency originates from phonons modulating the diffuse intensity (the I 2 term in Equation 1) while the additional feature in (a) near 1 THz is due to the I 1 term, which is not present in the pure GaAs sample. Since the points are taken along 1D cuts of a 2D surface spanned by the detector, the abscissa represents a local coordinate along this 1D path; for reference, (c) shows the Cartesian coordinates of the momentum transfer (q 1, q 2, q 3) along this 1D path. The false-color intensity represents the magnitude of the FT.Reference Kozina, Trigo, Chollet, Clark, Glownia, Gossard, Henigan, Jiang, Lu, Majumdar, Zhu and Reis11

Interestingly, I 1 ∼  $F\,{\bf{Q}}cdot {u_q}\left( t \right)$, is a product of the elastically scattered field, F, with the inelastic component by the phonons, resulting in mutual interference and an enhancement of the inelastic component by a factor F. In perfect crystals, F is negligible away from Bragg peaks and this term vanishes, but in the case of the ErAs particles, the nanoparticles provide sufficient intensity away from Bragg peaks for the cross term to be important.Reference Kozina, Trigo, Chollet, Clark, Glownia, Gossard, Henigan, Jiang, Lu, Majumdar, Zhu and Reis11 Interestingly, unlike the quadratic terms in Equation 1, the heterodyne term is proportional to the displacements and hence is sensitive to the initial phase of the motion.
Effects of electron–phonon coupling in materials
One of the strengths of FT-IXS is that it allows for probing the phonon dispersion of nonequilibrium transient states. Jiang and colleaguesReference Jiang, Trigo, Savić, Fahy, Murray, Bray, Clark, Henighan, Kozina, Chollet, Glownia, Hoffmann, Zhu, Delaire, May, Sales, Lindenberg, Zalden, Sato, Merlin and Reis12 used FT-IXS to yield insight into how electron–phonon coupling leads to the soft mode behavior of PbTe, which represents a class of materials with high thermoelectric power because of their low thermal conductivity.Reference Lee, Esfarjani, Luo, Zhou, Tian and Chen13 The low thermal conductivity is linked to the presence of a soft transverse optical (TO) phonon branch, that is, the frequency of one of the phonon branches is particularly small, which does not completely freeze into a static distortion (thus the material is what is called an incipient ferroelectric). The soft branch increases the phase space for phonon–phonon scattering and reduces the lattice thermal conductivity. The softening of the TO branch has been linked to the presence of long-range interatomic forces and to the resonant bonding nature of the electronic structure.Reference Lee, Esfarjani, Luo, Zhou, Tian and Chen13 Pump-probe experiments could potentially yield new insight into the coupled nature of its electronic and lattice structures.
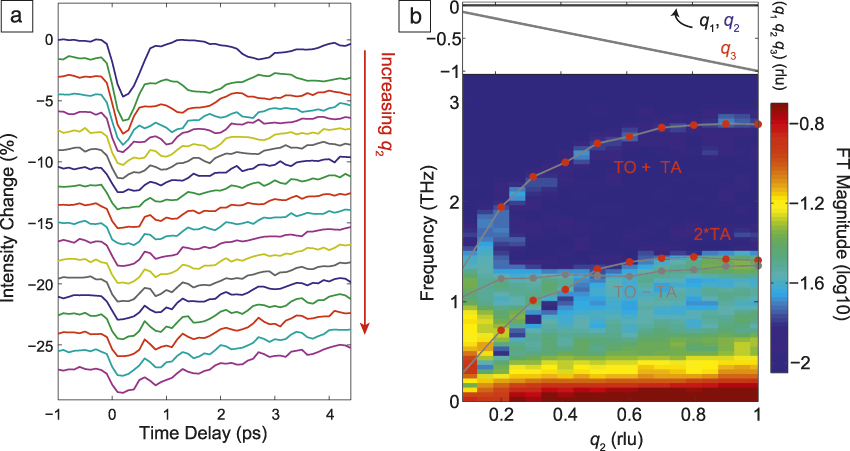
FT-IXS experiments on a single crystal of PbTe were performed at the Linac Coherent Light Source using a 50-fs infrared laser pump (with photon energy of 0.6 eV) and 10-fs pulses of 9.5-keV x-ray photons as the probe.Reference Jiang, Trigo, Savić, Fahy, Murray, Bray, Clark, Henighan, Kozina, Chollet, Glownia, Hoffmann, Zhu, Delaire, May, Sales, Lindenberg, Zalden, Sato, Merlin and Reis12 Figure 4 shows the differential diffuse scattering intensity as a function of pump-probe delay for various wave vectors along the (100) direction (a), and its Fourier transform (b). There are striking differences with the data in Figure 2b. First, the intensity in Figure 4a decreases immediately after Δt = 0. In equilibrium, the intensity is inversely proportional to the square of the frequency of the mode, hence the fact that the intensity decreases after photoexcitation suggests a slight hardening, or an increase of the frequency, of the modes responsible for the intensity. This was supported by density functional theory (DFT) simulationsReference Jiang, Trigo, Savić, Fahy, Murray, Bray, Clark, Henighan, Kozina, Chollet, Glownia, Hoffmann, Zhu, Delaire, May, Sales, Lindenberg, Zalden, Sato, Merlin and Reis12 that predicted a hardening of the TO branch by the photoexcited charge density.
(a) Differential diffuse scattering intensity as a function of pump-probe delay Δt for wave vectors with Cartesian coordinates (q 1, q 2, q 3) in the Brillouin zone (BZ) of PbTe (top to bottom is increasing q 2 component). As in Figure 2b, the diffuse intensity oscillates with the frequency of the modes with the respective wave vectors sampled here. This scattering geometry was mostly sensitive to transverse phonons and the traces are displaced vertically for clarity. (b) Fourier transformation (FT) of the time domain data in (a) showing the appearance of combination modes TO ± TA in addition to the overtone 2 TA. These combination modes indicate that the phonon eigenvectors are rotated in the photoexcited state, and can yield microscopic information on how electrons couple to the lattice. The false-color intensity is the base-10 logarithm of the absolute value of the FT. The red symbols represent the frequencies of the combination modes obtained from the known dispersion for PbTe.Reference Jiang, Trigo, Savić, Fahy, Murray, Bray, Clark, Henighan, Kozina, Chollet, Glownia, Hoffmann, Zhu, Delaire, May, Sales, Lindenberg, Zalden, Sato, Merlin and Reis12 The top panel in (b) shows the reduced wave vector components, mostly along (0, q 2, 0). Note: TO, transverse optical; TA, transverse acoustic; rlu, reciprocal lattice units.

Second, in contrast with the case of germanium, the FT (Figure 4b) shows that the spectrum contains combination modes that involve different branches (TO ± TA) as well as the overtone at 2 TA. The reason for this is that photoexcitation not only perturbs the spring constant of each mode, but can also modify the mode eigenvectors. The subsequent dynamics in the scattered intensity is proportional to the overlap between the mode eigenvectors before and after Δt = 0, thus a slight rotation of their direction mixes their character and results in combinations modes, seen here as TO ± TA. This apparently is not the case in the semiconductors studied earlier (Figure 2c), but it is possible in general. This feature is self-referencing in the sense that the sole observation of combination modes implies, without any additional input from theory, that the eigenvectors after photoexcitation are rotated from those in the ground state. In Reference Reference Jiang, Trigo, Savić, Fahy, Murray, Bray, Clark, Henighan, Kozina, Chollet, Glownia, Hoffmann, Zhu, Delaire, May, Sales, Lindenberg, Zalden, Sato, Merlin and Reis12, this was used to validate DFT simulations, which predicted the mode rotations and that removing electrons from the valence band suppresses the long-range forces responsible for the incipient ferroelectric behavior, which also explains the hardening of the TO branch after Δt = 0 and the sign of the intensity change in Figure 4a. This suggests that, indeed, long-range forces produce the softening of the TO branch in the ground state and are responsible for the incipient ferroelectricity of PbTe. This work demonstrates that by measuring how the dispersion and the mode eigenvectors change in the excited state, we can gain insight into the underlying electron–lattice coupling that produces the equilibrium properties of materials.
Anharmonic phonon–phonon coupling
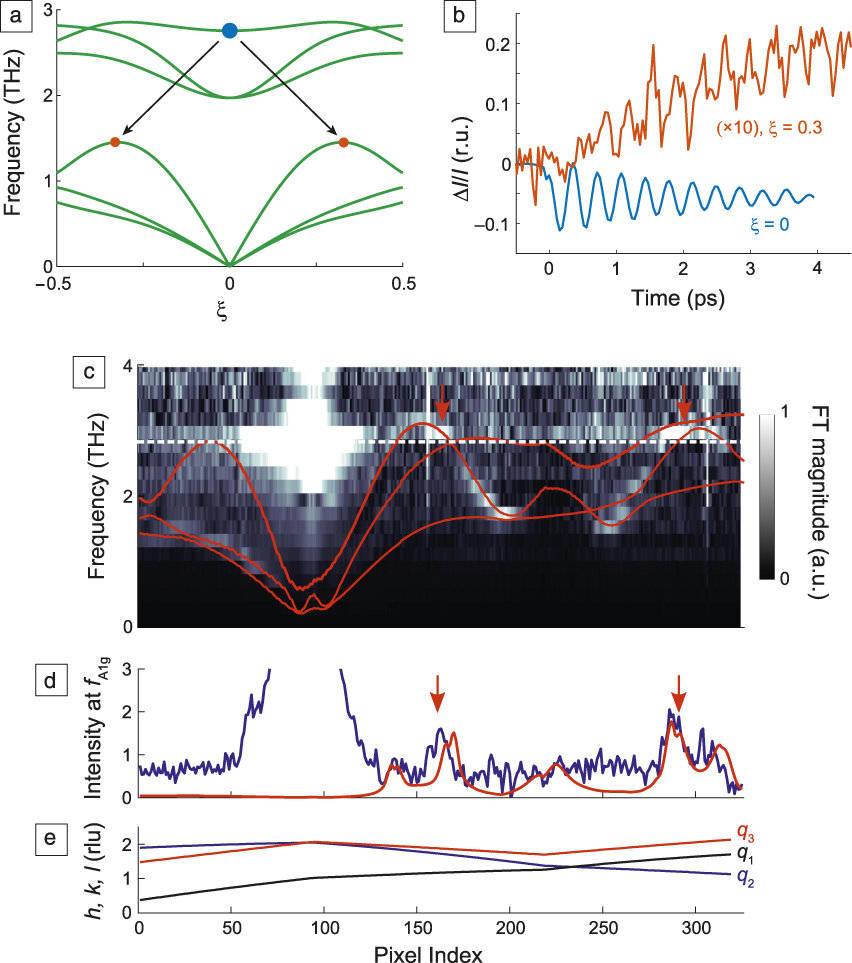
A unique feature of time-domain experiments is that they allow for measuring the coupling between various degrees of freedom by pumping a subset of the relevant modes and watching the dynamics of the rest. Anharmonicity, or phonon–phonon scattering, governs many energy-related processes such as heat transport, the lattice thermal equilibration, and technologically relevant parameters such as the thermal conductivity and thermoelectric power of materials. More recently, we have seen progress toward the prospect of controlling the phase of a material by ultrafast pulses by exploiting the anharmonic coupling of a large amplitude vibration to other relevant modes such as an order parameter.Reference Mankowsky, Subedi, Forst, Mariager, Chollet, Lemke, Robinson, Glownia, Minitti, Frano, Fechner, Spaldin, Loew, Keimer, Georges and Cavalleri14,Reference Först, Manzoni, Kaiser, Tomioka, Tokura, Merlin and Cavalleri15 Many existing frequency-domain inelastic scattering techniques (e.g., IXS, INS, Raman) can measure quantities related to anharmonicity such as spectral linewidths (related to the inverse lifetime of the mode); however, the spectral linewidth is an average over multiple decay channels over the Brillouin zone (BZ), and the individual phonon–phonon scattering processes required for a proper description of many mechanical and thermodynamic properties are inaccessible experimentally.
As summarized in Figure 5a, FT-IXS can isolate the individual phonon decay channels by watching, in the time domain, how an initial coherent mode resonantly decays into its products over the BZ. The solid green lines in Figure 5a represent the phonon dispersion of bismuth along a (ξ/3 ξ ξ) direction in the BZ; the blue dot at ωA1g ∼ 3 THz marks the coherent A1g mode that is excited by a sudden displacement of the phonon equilibrium position due to absorption of the pump pulse.Reference Cheng, Vidal, Zeiger, Dresselhaus, Dresselhaus and Ippen8 Teitelbaum et al.Reference Teitelbaum, Henighan, Huang, Liu, Jiang, Zhu, Chollet, Sato, Murray, Fahy, O’Mahony, Bailey, Uher, Trigo and Reis16 used FT-IXS to watch the decay of this coherent A1g phonon into longitudinal acoustic (LA) modes at large wave vectors, represented in Figure 5a by the orange dots. The process is coherent because the initial mode has a well-defined phase established by the pump pulse. As this mode oscillates coherently, it parametrically drives the acoustic modes at ωLA = ωA1g/2 ∼ 1.5 THz, whose rms amplitudes are amplified resonantly, as shown in Figure 5b. These are modes that satisfy energy and quasi-momentum conservation and also have nonzero coupling to the A1g mode.
Example of anharmonic phonon decay measured by Fourier transform inelastic x-ray scattering (FT-IXS). (a) Calculated phonon dispersion of bismuth along (ξ/3 ξ ξ) (green solid lines); blue and orange dots represent the A1g mode and its decay products into the longitudinal acoustic branch, respectively. (b) Dynamics of the (232) (rhombohedral units [r.u.]) structure factor (blue) and x-ray diffuse scattered intensity (red). The amplitude of the oscillations shown in the blue traces slowly decays into modes corresponding to the red trace. (c) FT of the oscillatory dynamics along momentum transfer (in reciprocal lattice units [rlu]) indicated in panel (e). The intensity scale represents the magnitude of the FT. The red solid lines in (c) are the second harmonic of the calculated acoustic dispersion, and the white dotted line marks the frequency f A1g. Vertical arrows indicate the resonance condition ωLA(q) = ωA1g/2. Blue trace in (d) represents the intensity along the white dashed line in (c) showing an increase due to the resonance condition (indicated by vertical arrows). The red trace in (d) is a calculation assuming a Lorentzian shape for the resonance profile. (e) Wave vector coordinates in rlu (q 1, q 2, q 3) for each pixel index.Reference Teitelbaum, Henighan, Huang, Liu, Jiang, Zhu, Chollet, Sato, Murray, Fahy, O’Mahony, Bailey, Uher, Trigo and Reis16 Note: ξ, scalar coordinate amplitude; I, intensity; ΔI, intensity change; h, k, l, Miller indices of momentum transfer, q = (q 1, q 2, q 3); ωLA, longitudinal acoustic frequency; ωA1g, frequency for coherent A1g mode.

Note that the diagram in Figure 5a is only a 1D subset of the BZ section recorded,Reference Teitelbaum, Henighan, Huang, Liu, Jiang, Zhu, Chollet, Sato, Murray, Fahy, O’Mahony, Bailey, Uher, Trigo and Reis16 and only shows one of many possible three-phonon processes contributing to the decay of the A1g. As the zone-center coherent mode decays, as shown by the oscillation of the structure factor in Figure 5b (blue trace), it transfers energy into the LA modes, whose rms displacements are amplified coherently and their contribution to the diffuse intensity at wave vector q = (0.1, 0.3, 0.3) reciprocal lattice units increases and oscillates, as seen by the red trace in Figure 5b. It is important to note that the A1g zone-center mode is observed through its modulation of the structure factor of the (232) Bragg peak (blue trace in Figure 5b), which is linear in the displacement and oscillates as u ∼ cos(ωA1g t), while the acoustic modes are probed by their modulation of the diffuse intensity, which oscillates as u 2 ∼ cos(2ωLA(q) t). Thus, the frequencies of the two traces in Figure 5b are the same, even though the resonance is ωLA(q) = ωA1g/2, but their traces have a relative phase shift of π/2, as expected.Reference Teitelbaum, Henighan, Huang, Liu, Jiang, Zhu, Chollet, Sato, Murray, Fahy, O’Mahony, Bailey, Uher, Trigo and Reis16
Figure 5c shows the dispersion obtained from the FT of the oscillations in the diffuse intensity along a representative 1D section of reciprocal space (the momentum transfer for each point in the 1D path is shown in Figure 5e). The gray scale represents the magnitude of the FT at each frequency. The red solid lines show the second harmonic of the calculated dispersion for the acoustic modes of Bi, and the dashed white line marks ωA1g. The bright feature at this frequency near index ∼80 is the contribution of the A1g mode to the structure factor near the zone center. Similar to the data in Figure 2c, ultrafast excitation directly produces oscillations in the modes due to electron–phonon coupling; these modes are most visible in the lower TA branches around index 180 and 250, where the dispersion has frequency minima and the intensity is high (near white regions in the colorscale of FT amplitude). More importantly, Figure 5c shows higher amplitude in regions where the LA branch intersects ωA1g, indicated by the vertical red arrows, and the intensity profile at this frequency (blue trace in Figure 5d) exhibits peaks at the same locations (red arrows in Figure 5d); clearly the acoustic modes at these wave vectors are amplified resonantly by the decay of the A1g mode. The dynamics of the two modes can be fitted to a coupled oscillator model to extract the anharmonic coupling coefficient for each individual decay channel.Reference Teitelbaum, Henighan, Huang, Liu, Jiang, Zhu, Chollet, Sato, Murray, Fahy, O’Mahony, Bailey, Uher, Trigo and Reis16 Thus, this provides a way to measure, without theoretical input, the anharmonic part of the crystal potential.
This work focused on the coupling of large-amplitude A1g mode to other modes in the BZ, but the measurement is broadly applicable to other types of ultrafast excitation and sample environments. Provided the pump produces large amplitude motion, a diffuse probe will be able to capture the coherent coupling with other modes across the BZ.
Outlook
This article presented an overview of current ultrafast developments for measuring phonons using x-ray FELs. As a vibrational spectroscopy tool, FT-IXS has the unique capability of probing the phonon dispersion under nonequilibrium conditions such as a highly photoexcited charge density. As such, it has shown tremendous potential for measuring properties of electron–phonon coupling of the excited electrons and how they determine the forces that bind the crystal together. Furthermore, this spectroscopy can probe dynamics of ultrafast processes such as anharmonic phonon–phonon couplings and could yield a detailed understanding of the potential energy surface of the crystals beyond the harmonic approximation, particularly when combined with high-amplitude driven modes.Reference Mankowsky, Subedi, Forst, Mariager, Chollet, Lemke, Robinson, Glownia, Minitti, Frano, Fechner, Spaldin, Loew, Keimer, Georges and Cavalleri14,Reference Först, Manzoni, Kaiser, Tomioka, Tokura, Merlin and Cavalleri15,Reference Katayama, Aoki, Takeda, Shimosato, Ashida, Kinjo, Kawayama, Tonouchi, Nagai and Tanaka17 Other promising applications of FT-IXS include probing phonon transport across interfaces and at the nanoscale, which could measure the mode-specific contribution to the thermal conductivity. As more FEL sources come online in the next few years, we expect additional surprises and exciting opportunities as this type of measurement is applied to more problems in materials science.

Mariano Trigo is a staff scientist at the Stanford University PULSE Institute and the Stanford Institute for Materials and Energy Sciences at SLAC National Accelerator Laboratory. He received his PhD degree in applied physics from the University of Michigan in 2008, and completed postdoctoral research at Stanford from 2009 until joining SLAC in 2010. His research focuses on ultrafast spectroscopy and scattering to understand and ultimately manipulate correlated materials as well as using ultrafast x-rays to image energy transport on nanoscale dimensions. Trigo can be reached by email at mtrigo@slac.stanford.edu.