INTRODUCTION
In winter wheat (Triticum aestivum L.), starch is a major component of grain yield, accounting for 0·65–0·75 of the final dry weight of the grain (Stark et al. Reference Stark, Timmerman, Barry, Preiss and Kishore1992; Hurkman et al. Reference Hurkman, McCue, Altenbach, Korn, Tanaka, Kothari, Johnson, Bechtel, Wilson, Anderson and Dupont2003). This is an important factor affecting the processing quality of wheat. Starch serves as a multifunctional ingredient for the food and non-food industries (Peng et al. Reference Peng, Gao, Abdel-Aal, Hucl and Chibbar1999). Light intensity has variable effects on plant morphology, carbohydrate allocation and yield (McMaster et al. Reference McMaster, Morgan and Willis1987; Grabau et al. Reference Grabau, Sanford and Meng1990). In eastern China, including Shandong, Jiangsu, Anhui and part of Henan province, low light intensity as a result of cloudy or rainy days and dense plant populations often occur during grain filling of wheat. This has strong impacts on grain yield and processing quality (Wang et al. Reference Wang, Yin, He, Zhang, Lu, Li and Shi2003).
During grain development, starch is deposited in the endosperm as discrete semi-crystalline aggregates known as starch granules (Paul Reference Paul1997). Wheat starch granules can be divided into A and B types according to their size and shape. B-type starch granules, spherical in shape, with diameters ranging from 1 to 10 μm, account for more than 0·9 of the total number of starch granules. In contrast, A-type starch granules, lenticular in shape, with diameters ranging from 10 to 35 μm, account for 0·03 of the total number of endosperm starch granules (Stoddard Reference Stoddard1999). A- and B-granules have different physical, chemical and functional properties (Nikuni Reference Nikuni1978; Ellis et al. Reference Ellis, Cochrane, Dale, Duffus, Lynn, Morrison, Prentice, Swanston and Tiller1998; Hurkman et al. Reference Hurkman, McCue, Altenbach, Korn, Tanaka, Kothari, Johnson, Bechtel, Wilson, Anderson and Dupont2003). Soh et al. (Reference Soh, Sissons and Turner2006) concluded that an increase in the B-granule content increased farinograph water absorption and improved pasta quality. The pasting properties of flour are closely related to the distribution of starch granules, large starch granules (A-granules) having a lower peak viscosity than small ones (B-granules; Peterson & Fulcher Reference Peterson and Fulcher2001). These differences result in the two starch granule types being used differently in industrial food and non-food applications.
The shape and distribution of starch granules vary significantly with grain developmental stage (Bechtel et al. Reference Bechtel, Zayas, Kaleikau and Pomeranz1990). The A-granules begin forming 4–5 days after anthesis and continue to form until the end of the endosperm cell division phase. The diameter of these early synthesized granules stops increasing at about 19 days after anthesis, but the volume continues to increase. The formation of B-starch granules begins about 12–14 days after anthesis (Bechtel et al. Reference Bechtel, Zayas, Kaleikau and Pomeranz1990; Hurkman et al. Reference Hurkman, McCue, Altenbach, Korn, Tanaka, Kothari, Johnson, Bechtel, Wilson, Anderson and Dupont2003). Environment is an important factor that affects grain development and starch accumulation. Studies have revealed that starch synthesis in wheat grains is determined developmentally and influenced by planting environment (Jenner Reference Jenner1994; Li et al. Reference Li, Yin, Yan, Dai, Li, Liang, Geng and Wang2008). Environmental factors (such as low light intensity) have a noticeable impact on the starch granule distribution. However, this aspect has not been studied in detail. The present study was conducted to investigate the effect of low light intensity after anthesis on starch granule size distribution and starch component content in wheat grain at maturity. Information obtained will help to provide a theoretical basis for obtaining higher grain yield and superior grain quality in wheat.
MATERIALS AND METHODS
Experimental design
The field experiments were carried out at Tai'an Experimental Station (36°09′N, 117°09′E) of Shandong Agricultural University in two growing seasons from October 2005 to June 2006 and from October 2006 to June 2007. Two high-yield winter wheat (T. aestivum L.) cultivars currently used in local wheat production, Shannong12 and Shannong1391, were used. The soil was a sandy loam and maize (Zea mays L.) was the previous crop. In addition, basal fertilizer was applied at the rate of 120 kg N/ha, 75 kg P2O5/ha and 120 kg K2O/ha before planting. At the stem elongation stage of wheat in the spring, 120 kg N/ha was applied. The experiments were arranged in a randomized complete design with three replications for each cultivar. The plot size was 3×3 m with 10 rows (0·25 m between rows). Seeds were sown on 15 October 2005 and 10 October 2006 to produce a density of 180 plants/m2. Other cultural practices used in the present study followed the precise high-yielding cultivation system of Yu (Reference Yu1990). Black nets with 0·45 light transmission were used over the plants during the whole of grain filling (1–30 d after anthesis (DAA)), as well as in the early (1–10 DAA), middle (11–20 DAA) or late (21–30 DAA) grain filling stages (treatments SH, S1, S2 and S3, respectively). At maturity, wheat kernels were harvested, starch content determined and analysis of starch granules size.
Starch isolation and purification
Starch was extracted from the wheat cultivars according to the methods of Malouf & Hoseney (Reference Malouf and Hoseney1992) and Peng et al. (Reference Peng, Gao, Abdel-Aal, Hucl and Chibbar1999) with some modifications. Wheat kernels (2 g) were covered with 30 ml double distilled water at 4°C for 24 h. The softened seeds were degermed and ground with a mortar and pestle in double distilled water until essentially all starch granules were released. The slurry was filtered through a 74 μm screen and centrifuged at 1700 g for 10 min to sediment the crude starch. The crude starch was purified three times using 5 ml of 2 mol NaCl/l, 2 mg NaOH/g, 20 mg sodium dodecyl sulphate (SDS)/g and double distilled water. To remove water, the starch was washed once with acetone, air dried at room temperature and stored at −20°C.
Particle size analysis
The particle size characteristics of the starch were determined using an LS13320 laser diffraction particle size analyser (Beckman Coulter, USA). About 50 mg of starch was weighed into 10 ml (Eppendorf) tubes and suspended with 5 ml of double distilled water. The tubes were vortexed and then kept at 4°C for 1 h. During this time, the tubes were vortexed every 15 min. The starch suspension was transferred into the dispersion tank of a laser diffraction particle size analyser containing double distilled water for size measurements.
Amylose and amylopectin determination
Amylose and amylopectin contents in wheat grain were determined with a coupled spectrophotometer assay (He Reference He1985). 100 mg of milled grain was stirred with 10 ml of 0·5 M KOH for 15 min at 100°C and then diluted to a volume of 50 ml with distilled water. Of this solution, 2·5 ml were diluted with 30 ml distilled water and adjusted to pH 3·5 with 0·1 M HCl, and then 0·5 ml of I2-KI reagent was added to the solution, which was diluted with distilled water to a final volume of 50 ml. After blending for 20 min, the mixture was monitored with an UV-2450 Shimadzu spectrophotometer at 471, 553, 632 and 740·3 nm. Standard amylose and amylopectin were purified from wheat. The absorption peaks of purified amylose which reacted with the I2-KI reagent were 632 and 471 nm, whereas those of amylopectin were 740·3 and 553 nm.
Statistical analyses
Analysis of variance (ANOVA) procedures for randomized complete designs were used to test for differences in granule distribution and starch content between shading treatment and control and calculated their standard errors of differences (s.e.d.). All determinations were replicated three times, and data were analysed with SPSS.
RESULTS
Granule volume distribution
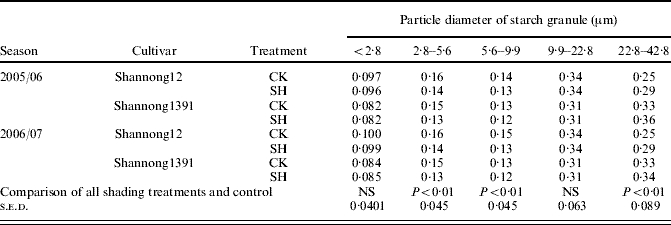
The volume distribution of starch granules is given in Table 1; 0·99 of the volume comprised granules of <42·8 μm. Shading significantly increased volume proportions of A-type starch granules (>9·9 μm, P<0·01) and reduced that of B-type starch granules (⩽9·9 μm, P<0·01). Variability within the large starch granule population from the two cultivars was appraised by dividing the group into two regions of 9·9–22·8 and 22·8–42·8 μm. The proportion of starch granules 22·8–42·8 μm of SH treatments was significantly higher than that of the control (P<0·01).
Effect of shading wheat after anthesis on the proportion by volume of starch granules in different size classes (d.f.=16)

CK, control; SH, shading from 1 to 30 days after anthesis.
Granule number distribution
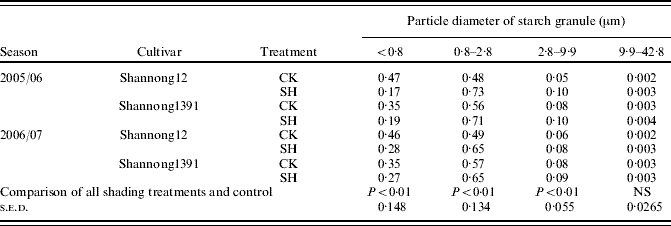
Proportions of starch granules <2·8 and <9·9 μm were in the ranges of 0·899–0·946 and 0·996–0·998 of the total number, respectively (Table 2), which showed that most of the granules in the wheat grain analysed were B-starch granules. Shading exerted little effect on the alteration of the total proportion of B-starch granules or A-starch granules. However, shading significantly reduced the proportion of starch granules <0·8 μm (P<0·01), and significantly increased the proportion of starch granules ranging from 0·8 to 9·9 μm (P<0·01). These results imply that small starch granules are the main numerical components, although they contribute less to the total volume.
Effect of shading wheat after anthesis on the proportion by number of starch granules in different size classes (d.f.=16)

CK, control; SH, shading from 1 to 30 days after anthesis.
Granule surface area distribution
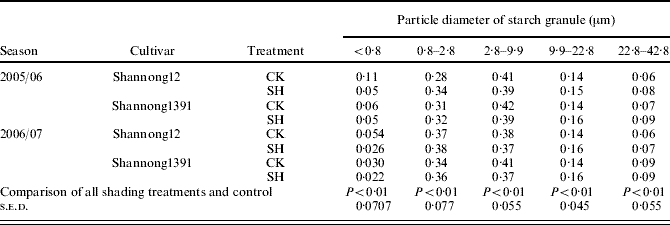
Surface area distribution of starch granules of different size groups is given in Table 3. The proportion of granules by surface area (surface area proportion) of A-starch granules was significantly enhanced by shading (P<0·01). Overall, the surface area proportion of B-starch granules was significantly decreased by shading (P<0·01), although there was a significant increase for granules ranging from 0·8 to 2·8 μm (P<0·01).
Effect of shading wheat after anthesis on the proportion by surface area of starch granules in different size classes (d.f.=16)

CK, control; SH, shading from 1 to 30 days after anthesis.
Starch content
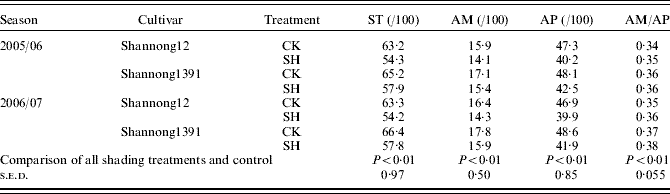
Shading significantly reduced starch content and starch component content at maturity (Table 4). However, shading significantly increased the ratio of amylose to amylopectin (P<0·01).
Effect of shading after anthesis on starch component content in wheat grain (d.f.=16)

ST, starch; AM, amylose; AP, amylopectin; AM/AP, amylose/amylopectin. CK, control; SH, shading from 1 to 30 days after anthesis.
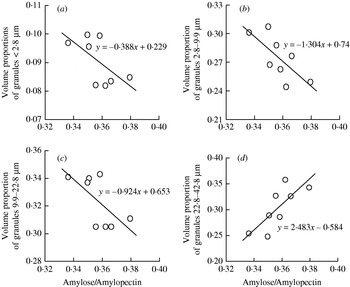
The proportion of granules by volume (volume proportion) of starch granules 2·8–9·9 μm was negatively correlated with the ratio of amylose to amylopectin (r=−0·72, P=0·042; Fig. 1 b). A positive correlation (r=0·78, P=0·022; Fig. 1 d) was found between volume proportions of starch granules 22·8–42·8 μm and the ratio of amylose to amylopectin. Volume proportions of starch granules <2·8 and 9·9–22·8 μm were not significantly correlated with the ratio of amylose to amylopectin (r=−0·62, P=0·104; r=−0·65, P=0·081; respectively; Fig. 1 a, c).
The relationship between distribution by volume of starch granules and the ratio of amylose to amylopectin in grain.

Grain and starch yield
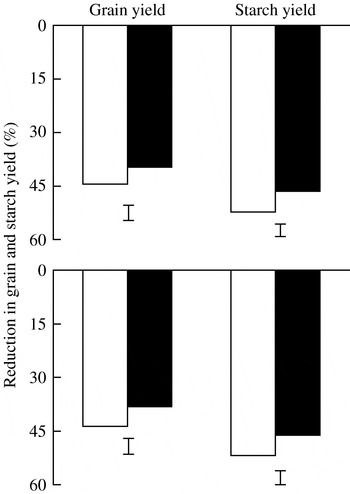
Shading caused a marked drop in both grain yield and starch yield (Fig. 2). Shading reduced grain yield by 44 and 39%, and starch yield by 52 and 46% in Shannong12 and Shannong1391, respectively.
Effect of shading wheat after anthesis on grain yield and starch yield in growing seasons 2005–2006 (top) and 2006–2007 (bottom) (□, SN12; ▪, SN1391). Vertical bars indicate 1 s.e.d.

Granule size distribution in response to shading at different grain filling stages
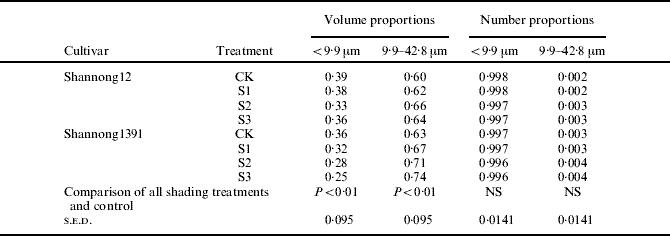
The effect of shading at different grain filling stages on the starch granule distribution in the grain is shown in Table 5. It was found that the volume distribution of the starch granules was easily affected by shading, especially at the middle grain filling stage for Shannong12 and late grain filling stage for Shannong1391, while it had little effect on granule number distribution in the wheat grain.
Effect of shading wheat at different stages of grain filling on the proportions by volume and by number of starch granules in 2006/07 (d.f.=16)

CK, control; S1, shading from 1 to 10 days after anthesis; S1, shading from 11 to 20 days after anthesis; S1, shading from 21 to 30 days after anthesis.
DISCUSSION
The functional properties of starch, particularly the ability of starch or flour to take up water and form a paste in the presence of heat, are affected by variations in the proportions of amylose and amylopectin and in the size distribution of starch granules (Dengate Reference Dengate and Pomeranz1984; Soh et al. Reference Soh, Sissons and Turner2006). Starch granule distribution has been reported to vary with environmental conditions. The number of B-starch granules decreased when plants were exposed to higher temperatures; correspondingly, that of A-starch granules increased (MacLeod & Duffus Reference MacLeod and Duffus1988). In a comparison of irrigated and rainfed conditions, Dai et al. (Reference Dai, Yin, Zhang, Li, Yan, Cai and Wang2008) reported that rainfed conditions resulted in an increase of both volume and surface area proportions of B-starch granules, and correspondingly, those of A-starch granules were reduced. The present results have shown that the volume and surface area proportions of A- and B-starch granules can be significantly influenced by shading during grain filling. Shading led to a significant reduction in the volume proportion and surface area proportion of B-starch granules. It is suggested that B-starch granules are more sensitive to shading than A-starch granules in wheat grain. Blumenthal et al. (Reference Blumenthal, Bekes, Gras, Barlow and Wrigley1995) also reported that B-starch granules are more sensitive than A-granules to the environmental temperature. With the alteration of the environmental temperature, the volume of A-starch granules changed by a factor of 1·5 and that of B-starch granules changed by a factor of 2.
Shading, however, showed no significant impact on the proportion of A- and B-starch granules, suggesting that small starch granules (<2·8 μm), which account for 0·90–0·95 of the total number of starch granules, were rarely regulated by the environment. Shading caused a marked drop in the starch yield of wheat, which showed the number of starch granules decreased significantly because of shading during grain filling. Hence, it is suggested that in areas where low light intensity often occurs, the wheat cultivars with strong low-light tolerance or low plant populations would be more likely to produce high, stable yield.
A previous study on wheat starch showed conclusively that B-granules formed within protrusions from A-amyloplasts (Parker Reference Parker1985). Based on the present results, it is suggested that, under dim light conditions, the limited substrate for starch accumulation was mainly partitioned for growing starch granules, not for producing more starch granules.
Starch is composed of two types of polysaccharide molecules, amylose and amylopectin. Amylose content is used as one of the parameters characterizing starch, and plays an important role in wheat quality because it affects starch properties. Zeng et al. (Reference Zeng, Morris, Batey and Wrigley1997) reported that higher peak paste viscosity and greater breakdown of wheat starch were linked to lower amylose contents. Oda et al. (Reference Oda, Yasuda, Okazaki, Yamauchi and Yokoyama1980) found that the eating quality of Udon noodles was negatively correlated with amylose content in wheat grain. Granule size distribution had a close association with starch component content. Some researchers have reported that the A-granules have 4–10% higher amylose content than the B-granules (Peng et al. Reference Peng, Gao, Abdel-Aal, Hucl and Chibbar1999; Shinde et al. Reference Shinde, Nelson and Huber2003). Raeker et al. (Reference Raeker, Gaines, Finney and Donelson1998) reported that the starch content was negatively correlated with the volume proportion of granules <5 and 9·9 μm. The ratio of amylose to amylopectin was negatively correlated with the volume proportion of granules 2·8–9·9 μm and positively correlated to volume proportion of granules 22·8–42·8 μm in the present study, which indicated that an increase in volume proportion of granules 22·8–42·8 μm enhanced the ratio of amylose to amylopectin in wheat grain induced by shading.
The research was supported by the National Natural Science Fund of China (30871477), the National Basic Research (973) Program of China (2009CB118602), and the Programme for Changjiang Scholars and Innovative Research Team in University, Ministry of Education (IRT0635).