Introduction
Winter canola (Brassica napus L.) is one of the most imperative oil crops worldwide. China, as a major canola-producing region, has been the largest winter canola production country, accounting for 30% (7.6 million hectares) of the world total planting area and yielding about 11.6 million tons recently (Cheghakhor et al., Reference Cheghakhor, Meskarbashee, Mamaghan and Nabipour2009; Wang et al., Reference Wang, Wang, Kuai, Li, Bai and Zhou2021; Xu et al., Reference Xu, Luo, Rao, Yang, Liu, Zhang and Hu2019). Canola has been a vital source of edible vegetable oil for human consumption owing to its high nutritional value (Song et al., Reference Song, Guan, Hu, Guo, Yang, Wang, Liu, Wang, Lu, Zhou, Xie, Cheng, Zhang, Liu, Yang, Chen and Guo2020; Zhang et al., Reference Zhang, Li, Fu, Cai, Xu, Zhu and Shen2019). Compared to canola transplanting, which has been a traditional cultivation practice and yet labor intensive in China (Kuai et al., Reference Kuai, Li, Ji, Li, Xie, Wang and Zhou2021; Wang et al., Reference Wang, Cheng and Hu2015), mechanized direct seeding can reduce winter canola production costs and increase production efficiency (Wang et al., Reference Wang, Cheng and Hu2015). However, the mechanized direct-seeding area only accounts for a relatively low proportion of the total winter canola farming area (Li et al., Reference Li, Zuo, Chang, Bai, Kuai and Zhou2018). The main reason is the difficulty in the extension of mechanized direct seeding that growers are dissatisfied with the relatively low yield. Lodging risk is a limiting factor for canola in low mechanized direct-seeded systems (Kuai et al., Reference Kuai, Sun, Zhou, Zhang, Zuo, Wu and Zhou2016).
Optimizing plant density is a prerequisite to increasing canola yield (French et al., Reference French, Seymour and Malik2016; Khan et al., Reference Khan, Anwar, Kuai, Ullah, Fahad and Zhou2017). Angadi et al. (Reference Angadi, Cutforth, McConkey and Gan2003) observed no significant effects of increased densities on seed yield in the range of 20 to 80 plants m-2, while the plant density of 50–60 plants m-2 provoked the highest seed yields in multifactorial experiments (Leach et al., Reference Leach, Stevenson, Rainbow and Mullen1999). Rathke et al. (Reference Rathke, Behrens and Diepenbrock2006) concluded that the optimum yield was obtained at the density of 80 to 150 plants m-2 before wintering. The yield would decrease when plant density is more than 150 plants m-2 in winter canola planting regions (Leach et al., Reference Leach, Stevenson, Rainbow and Mullen1999). Crop planting density in Europe was remarkably higher than in China, where it was usually 10 to 15 plants m-2 for transplanting of winter canola (Li et al., Reference Li, Zuo, Chang, Bai, Kuai and Zhou2018). However, seed yield was enhanced under 45 plants m-2 for direct-seeding winter canola (Kuai et al., Reference Kuai, Sun, Zuo, Huang, Liao, Wu, Lu, Wu and Zhou2015; Li et al., Reference Li, Zuo, Chang, Bai, Kuai and Zhou2018). Inconsistent results from previous studies suggested that the optimum density should be re-evaluated for mechanized direct-seeded cropping systems with modern breeding winter canola cultivars in China.
Sunlight interception, which plays a key role in crop growth and yield, is determined by plant density (Dellero et al., Reference Dellero, Jossier, Bouchereau, Hodges and Leport2021; Kirkegaard et al., Reference Kirkegaard, Lilley, Brill, Ware and Walela2018). Planting density affects canopy composition and structure and accordingly alters its ability to intercept light (Menendez et al., Reference Menendez, Sanchez, Snowdon, Rondanini and Botto2021). The leaf area index (LAI) of canola during the early growth stages is changed by plant density, and high planting density contributes to earlier canopy closure and more light interception (Li et al., Reference Li, Zuo, Chang, Bai, Kuai and Zhou2018). During flowering and pod set stages in canola, sunlight interception might be a critical limiting factor for seed yield (Kirkegaard et al., Reference Kirkegaard, Lilley, Brill, Ware and Walela2018; Lilley et al., Reference Lilley, Flohr, Whish, Farre and Kirkegaard2019). Wang et al. (Reference Wang, Cheng and Hu2015) revealed that increasing plant density lessened photosynthetically active radiation transmission within the crop canopy. Benefiting from the asymmetric competition of neighboring canola plants, crop canopy captured more sunlight to promote canola growth at high population density (French et al., Reference French, Seymour and Malik2016).
Crop lodging is a considerable obstacle to the increase in canola production. As the population density increased, canola lodging risk increased, leading to low seed yield (Kuai et al., Reference Kuai, Li, Ji, Li, Xie, Wang and Zhou2021). However, some studies on winter canola demonstrated that the increase in plant density did not curtail lodging resistance (Khan et al., Reference Khan, Anwar, Kuai, Ullah, Fahad and Zhou2017; Kuai et al., Reference Kuai, Sun, Zhou, Zhang, Zuo, Wu and Zhou2016; Li et al., Reference Li, Zuo, Chang, Bai, Kuai and Zhou2018; Menendez et al., Reference Menendez, Sanchez, Snowdon, Rondanini and Botto2021). The relationship between the lodging resistance and the increase in plant density in winter canola remains vague.
Regardless of some research on seed yield, sunlight interception, and lodging risk of winter canola as affected by planting density (Dellero et al., Reference Dellero, Jossier, Bouchereau, Hodges and Leport2021; Kirkegaard et al., Reference Kirkegaard, Lilley, Brill, Ware and Walela2018; Kuai et al., Reference Kuai, Li, Ji, Li, Xie, Wang and Zhou2021; Wang et al., Reference Wang, Cheng and Hu2015), there are few studies on the characteristics of a wide range of canola population densities, including suboptimum or excessive densities, in the same field conditions. This study aimed to (i) determine the canola yield, sunlight interception, and lodging resistance under varying planting densities; (ii) investigate trade-offs among relatively higher plant density, yield, and sunlight interception and lodging resistance of winter canola; and (iii) evaluate the beneficial plasticity of improving canola yield as much as possible for direct-seeding canola plantation in China.
Materials and Methods
Experimental site, design, and management
The field experiments were conducted at Wawu county of Bijiang District, Tongren City, Guizhou province in China (109°13′E, 27°47′N, and 470 m above sea level) during 2017, 2018, and 2019 in rain-fed conditions. The soil properties (top 20 cm) at the presowing are listed in Table 1. The precipitation, sunshine duration, and accumulated temperature were 269 and 288 mm, 228 and 209 h, and 3252 and 3469 degree-days (the base temperature was 0°C) from canola seeding to harvest in the 2017/18 and 2018/19 cropping seasons, respectively.
Soil properties at the experimental field in 2017–2019

Canola cultivar Huayouza9 (HZ9, a popular hybrid cultivar in main winter canola planting areas of China) and Zhongshuang11 (ZS11, a popular conventional cultivar in main winter canola planting areas of China) were studied. Winter canola was manually sown in the experimental field on October 8, 2017, and October 10, 2018, respectively. The final thinning of seedlings was conducted on the 30th day after sowing, and the row spacing of 20 cm was adopted in all treatments. The plots were 20 m2 in area, 10 m long, and 2 m wide. Additionally, weed, pest, disease control, and agronomic measures were performed following local management practices to better compare experimental planting densities with the local common planting density (12–22.5 plants m-2).
A split-plot experiment was conducted with two cultivars (HZ9 and ZS11) as the main plot. The eleven planting densities treatments (12, 15, 22.5, 30, 37.5, 45, 52.5, 60, 75, 90, and 105 plants m-2) were established as the subplots. There were three replicates. Each plot was fertilized with urea, single superphosphate, potassium chloride, and borax, receiving 180 kg N ha-1, 90 kg P2O5 ha-1, 90 kg K ha-1, and 7.5 kg B ha-1, respectively. Nitrogen was split-applied, with 90 kg N ha-1 as basal fertilizer one day before sowing and 90 kg N ha-1 at bud initiation. P, K, and B were all applied as base fertilizers one day before sowing.
Sampling and measurements
On May 10, 2018, and May 12, 2019, ten plants were randomly sampled and uprooted from each plot to measure yield-related traits such as plant height, root neck diameter, stem diameter, main raceme length, first branch and pod position, primary branch number per plant, number of pods per plant, number of branch pod per plant, number of main raceme pod per plant, number of seeds per plant, and 1000-seed weight. Seed yield and above-ground dry matter were recorded by harvesting all the remaining plants in each plot at crop maturity.
Crop canopy sunlight interception was measured with a SunScan Canopy Analysis System (Delta-T Devices Ltd., Cambridge, UK) following the previously reported procedure (Wang et al., Reference Wang, Cheng and Hu2015). Leaf area was measured with a leaf area meter (Li-3100c, Li-COR Inc., Lincoln NE, USA) on 10 plants of each plot at seedling (BBCH 10–39, the growing stages are divided referring to Behrens and Diepenbrock, Reference Behrens and Diepenbrock2006), budding (BBCH 40–59), flowering (BBCH 60–69), and pod mature (BBCH 70–87) stages. The LAI was calculated as the ratio of the total one-sided leaf area to the ground surface area (Behrens and Diepenbrock, Reference Behrens and Diepenbrock2006). The pod area index (PAI) was defined as the ratio of total pod area to ground surface area. PAI was measured on 10 plants in each plot about one month after the end of flowering (Kuai et al., Reference Kuai, Sun, Zhou, Zhang, Zuo, Wu and Zhou2016).
Lodging-related indicators were calculated from ten plants randomly sampled from each plot at the maturing stage. Lodging resistance was measured using the lodging tester (Tuopu Instrument Co. Ltd., Hangzhou, China). It was set perpendicularly in the middle of the second basal internode and used to measure the strength (g cm) required to break the stem internode. Besides, the snapping resistance of the stem above the first branch was measured using a stem strength meter YYD-1 (Tuopu Instrument Co. Ltd., Hangzhou, China).
Data analyses
Two-way analysis of variance (ANOVA) was conducted using the statistical software package SAS 8.1 (SAS Corp., Cary, NC, USA) to assess individual and interactive effects of cultivar and planting density on canola growth. Canola cultivar and plant density were the fixed factor, while block, and growing season were random factors. Significant differences among treatments were compared by the protected least significant difference (LSD) procedure at p < 0.05. Regression analysis was performed to estimate the possible influences of increasing planting densities on canola characteristics. All figures were generated with the Simplot 10.0 software (SPSS Inc., Chicago, IL, USA).
Results
Yield, yield components, and associated traits
A similar trend was observed in monthly precipitation, monthly sunshine, and accumulated temperature during the two experimental seasons, as described in the Materials and Methods section. Plant density and cultivars significantly impacted yield, yield components, and some other traits while differing slightly between growing seasons (Table 2). As illustrated in Figure 1a, seed yield sharply increased before the planting density reached about 80 plants m-2 in ZS11 and 60 plants m-2 in HZ9. Compared to the conventional cultivar (ZS11), the seed yield of the hybrid canola HZ9 first reached 2943 kg hm-2 at about 60 plants m-2, similar to the local target yield (3000 kg hm-2). The above-ground biomass yield also increased as the plant density increased (Figure 1b). Biomass yield reached a relatively high value at around 60–80 plants m-2 (Figure 1b). HZ9 had higher seed yield and biomass production than ZS11 when the same density was considered. Canola planting density dramatically affected the harvest index (HI), which noticeably decreased with the increasing plant density (Figure 1c). However, the HI of ZS11 was higher than that of HZ9 at the same density. For ZS11, the ratio of the main raceme and branch seed weight per plant continuously increased as the plant density increased (Figure 1d). Although the ratio of main raceme and branch seed weight presented an upward tendency for HZ9, it obtained a relatively stable value from 20 to 60 plants m-2 (Figure 1d).
Summary of analyses of variance for yield, lodging resistance, and related agronomic traits of winter canola at eleven plant densities and two cultivars (2017–2019)

* Indicates significant difference at p < 0.05, NS indicates non-significant.
** Indicates significant difference at p < 0.01.
Effects of plant density on seed yield (a), above-ground biomass yield (b), harvest index (c), and ratio of main raceme and branch seed weight (d) at harvest. Data are averaged across two seasons (2017/2018 and 2018/2019). The quadratic regression functions y1 = a+bx1+cx1 2 and y2 = a+bx2+cx2 2 are shown for HZ9 (closed symbols) and ZS11 (open symbols), respectively.

The branch pod number per plant, main raceme pod number, and pod number per plant in ZS11 declined steeply with planting density increasing from 12 to 105 plants m-2 (Figure 2a–c). Pod number per plant in HZ9 also declined quickly at a density of lower than 40 plants m-2, with the lowest value at the density of about 80 plants m-2. In other words, the pod numbers per plant responded mildly to the increasing density from 40 to 80 plants m-2. The 1000-seed weight slightly decreased as the density increased, with a difference across cultivars and growing seasons of 1.38 g (averagely increased by 35.6%) (Table 2, Figure 2d). From another perspective, the number of seeds per pod was reduced with the increasing plant density (Figure 2e).
Effects of plant density on branch pod number per plant (a), main raceme pod number per plant (b), pod number per plant (c), 1000-seed weight (d), and seed number per pod (e) at harvest. The quadratic regression functions y1 = a+bx1+cx1 2 and y2 = a+bx2+cx2 2 are shown for HZ9 (closed symbols) and ZS11 (open symbols), respectively.

Sunlight interception of crop canopy
Effects of increasing plant density on sunlight interception were significant along canola growing stages (Figure 3). During the seedling stage, sunlight interception of the canola canopy increased gradually with the increase in the density from 12 to 105 plants m-2 (Figure 3a). At the budding stage, sunlight interception increased as the density increased, though it averagely increased by about 77% compared with seedling stage. Sunlight interception reached the highest value (92%) in the flowering stage compared with the four critical growing stages of winter canola. However, there was almost the same sunlight interception among plant densities during the canola flowering stage. Sunlight interception during the podding stage increased with the rising population density, reaching 90% and maintaining the same in the plant density higher than 60 plants m-2 in HZ9 (Figure 3a). Under the increasing plant density, sunlight interception was consistent in HZ9 and ZS11 across the growing seasons (Figure 3b).
Effects of plant density on sunlight interception at seedling (S), budding (B), flowering (F), and pod mature (P) stages in HZ9 (in A) and ZS11 (in B). Data are averaged across two seasons (2017/2018 and 2018/2019).

LAI and pod area index (PAI) were all significantly affected by crop density at different growing stages (Figure 4). During the seedling stage, LAI increased with the increasing plant density from 12 to 105 plants m-2, and a similar trend was observed at the budding stage in HZ9 (Figure 4a). Moreover, at seedling and budding stages, there was a dramatic increase in LAI when the plant density rose to more than 50 plants m-2. At the flowering stage of HZ9, LAI kept an upward tendency generally and exhibited a slight fluctuation with the increasing plant density. At the pod-filling stage, the pod area index continuously increased and was relatively stable as the density increased from 50 to 105 plants m-2 (Figure 4a). Additionally, the responses of LAI or PAI to population densities in ZS11 were similar to HZ9 across seasons (Figure 4b).
Effects of plant density on leaf area index (LAI) or pod area index (PAI) at seedling (S), budding (B), flowering (F), and pod mature (P) stages in HZ9 (in A) and ZS11 (in B). Data are averaged across two seasons (2017/18 and 2018/19).

Lodging resistance and related agronomic characteristics
Increases in the planting density could lead to decreases in the canola population canopy thickness of the pod layer, pod layer fresh weight, snapping resistance, and lodging resistance of crop canopy. For HZ9, lodging resistance decreased from 5.20 to 1.22 with the increase in the planting density from 12 to 105 plants m-2 (Figure 5a). Nonetheless, lodging resistance declined sharply before crop density reached 40 and 60 plants m-2 for ZS11 and HZ9, respectively. Lodging resistance decreased slowly from 60 to 105 plants m-2 regarding the two winter canola cultivars. Similar to canola lodging resistance, plant snapping resistance also declined with the increasing planting density (Figure 5b).
Effects of plant density on lodging resistance (a), pod layer fresh weight (b), thickness of pod layer in canopy (c), and snapping resistance (d) at harvest. Data are averaged across two seasons (2017/2018 and 2018/2019). The quadratic regression functions y1 = a+bx1+cx1 2 and y2 = a+bx2+cx2 2 are shown for HZ9 (closed symbols) and ZS11 (open symbols), respectively.

The fresh weight of the pod layer decreased with the increase in density (Figure 5c) and was 46.6% higher in HZ9 than in ZS11. This trait decreased by 2.6% (3.4 g per plant) and 2.4% (2.2 g per plant) with every increase of 7.5 plants m-2 in the plant density for HZ9 and ZS11, respectively. The thickness of the pod layer also became thinner as the density increased from 12 to 105 plants m-2 (Figure 5d). Lodging-related characteristics drastically changed when the plant density increased from 12 plants m-2 to 60−80 plants m-2, regardless of cultivars.
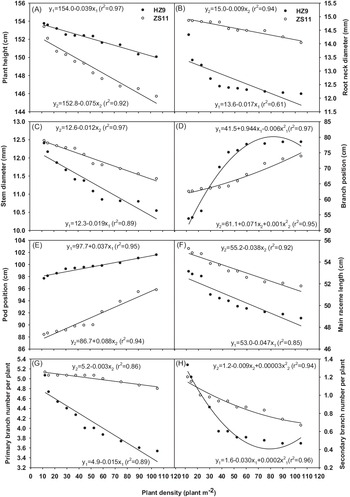
Winter canola planting density considerably affected some of the agronomic traits (Figure 6). Increasing crop density from 12 to 105 plants m-2 led to constant decreases in plant height, stem diameter, main raceme length, and primary branch number per plant (Figure 6a, c, f and g), and the first pod position rose gradually (Figure 6e). The agronomic traits kept a consistent tendency with the increase in the plant density for both cultivars. Similar trends were observed for the root neck diameter and first branch position in ZS11, and the lowest values were at the density of nearly 80 plants m-2 in HZ9 (Figure 6b and h). The branch number per plant continuously increased with the increasing planting density for ZS11, while HZ9 reached its peak at the density of 70–80 plants m-2 (Figure 6d).
Effects of plant density on plant height (a), root neck diameter (b) and stem diameter (c), branch (d) and pod (e) position, main raceme length (f), primary (g) and secondary (h) branch number per plant at harvest. Data are averaged across two seasons (2017/18 and 2018/19). The quadratic regression functions y1 = a+bx1+cx1 2 and y2 = a+bx2+cx2 2 are shown for HZ9 (closed symbols) and ZS11 (open symbols), respectively.

Discussion
Yield in response to increasing population density
In this study, the seed yield of ZS11 increased linearly across all the densities from 12 to 105 plants m-2, consistent with the findings at relatively low population density (Kuai et al., Reference Kuai, Sun, Zhou, Zhang, Zuo, Wu and Zhou2016; Leach et al., Reference Leach, Stevenson, Rainbow and Mullen1999; Wang et al., Reference Wang, Cheng and Hu2015). However, the yield for HZ9 increased linearly as the density increased from 12 to 60 plants m-2 (Figure 1a). These results suggested that seed yield increased rapidly and consistently as canola density increased from 12 to 60 plants m-2 for both cultivars. Additionally, the contribution of the increased density to canola yield tended to be neglectable when the planting density exceeded the critical value of 60–80 plants m-2. These findings confirmed that seed yield did not decrease to 150 plants m-2 in winter canola (Leach et al., Reference Leach, Stevenson, Rainbow and Mullen1999). Our study demonstrated that seed yield was increased by improving plant density despite hybrid (HZ9) and conventional cultivar (ZS11) in direct-seeded canola. The results also highlighted the importance and necessity of a reasonable increase in plant density (close to 60 plants m-2) to benefit seed yield.
Biomass yield increased with the increasing density from 12 to 105 plants m-2 (Figure 1b), implying that high plant density improved the aboveground biomass because of vegetative plasticity in response to planting densities and competition for resources among plants (Angadi et al., Reference Angadi, Cutforth, McConkey and Gan2003; Behrens and Diepenbrock, Reference Behrens and Diepenbrock2006; Channaoui et al., Reference Channaoui, El Idrissi, Mazouz and Nabloussi2019; Dellero et al., Reference Dellero, Jossier, Bouchereau, Hodges and Leport2021). Canola growth and biomass yield were sensitive to plant population density and environmental conditions (Behrens and Diepenbrock, Reference Behrens and Diepenbrock2006; Li et al., Reference Li, Zuo, Chang, Bai, Kuai and Zhou2018). Although more resources were used by each canola plant under low plant densities, such resources would be applied to luxury vegetative growth at an individual level without increasing above-ground dry matter and hence seed yield per unit area (Shafighi et al., Reference Shafighi, Ardakani, Rad, Alavifazel and Rafiei2021; Zhang et al., Reference Zhang, Cao, Zhang, Hanan, Ge, Cao, Xia, Xuan, Liang, Zhang, Wu, Sun, Shi, Liu, Chen, Han, Pan, Tang and Wu2020). Therefore, a reasonable increase in plant density can curtail such luxurious vegetative growth of individuals (Rathke et al., Reference Rathke, Behrens and Diepenbrock2006; Ren et al., Reference Ren, Liu, Lu, Deng, Li and Cong2017).
The HI is a critical parameter to evaluate canola partitioning efficiency, which affected biomass accumulation and its allocation to harvestable seeds (French et al., Reference French, Seymour and Malik2016; Zhang et al., Reference Zhang, Cao, Zhang, Hanan, Ge, Cao, Xia, Xuan, Liang, Zhang, Wu, Sun, Shi, Liu, Chen, Han, Pan, Tang and Wu2020). In the study, HI, the ratio of the main raceme and branch seed yield showed the tight and continuous trend beneficial to crop seed yield (Figure 1c). The decreased seed yield of the branches demonstrated that the seeds of the floral branch were weakened as the plant density increased. In other words, the seed yield of floral branches was much lower than that of the main raceme in winter canola. Canola plants at low densities produced more floral branches and were less efficient in producing seeds per unit of invested pod wall (non-seed reproductive biomass) compared with plants at relatively high densities (Figure 1d). Biomass allocation to seed and pod wall was higher in the main floral raceme than in floral branches (Shafighi et al., Reference Shafighi, Ardakani, Rad, Alavifazel and Rafiei2021; Wang et al., Reference Wang, Wang, Kuai, Li, Bai and Zhou2021).
Crop canopy sunlight interception in response to population density
In our experiment, the highest LAI was 3.8 at the high planting density (Figure 4), suggesting that the canopy grew rapidly at high planting densities and provided a larger photosynthetic area. Canola population with high LAI promoted dry matter accumulation before flowering and hence improved carbohydrate supply to reproductive organs at post-flowering (Lilley et al., Reference Lilley, Flohr, Whish, Farre and Kirkegaard2019; Rathke et al., Reference Rathke, Christen and Diepenbrock2005). Before flowering (especially at the budding stage), the pattern of the light environment differed among planting densities, with the intercepted sunlight (IS) increasing from 58 to 96% in this experiment (Figure 3). However, all densities reached the highest IS (about 92%) for both cultivars at the flowering stage (Figure 3). The IS increase was associated with the reduced ratio of red light and far-red light, which was induced by slow leaf senescence and high pod area derived from the increasing floral branches during the canola maturity period (Rondanini et al., Reference Rondanini, Menendez, Gomez, Miralles and Botto2017, Reference Rondanini, Vilarino, Roberts, Polosa and Botto2014; Shafighi et al., Reference Shafighi, Ardakani, Rad, Alavifazel and Rafiei2021).
At relatively higher plant densities, canola canopy captured more radiation and exhibited a higher growth rate due to the asymmetric competition conferred by mutual shading among plants (Leach et al., Reference Leach, Stevenson, Rainbow and Mullen1999; Rathke et al., Reference Rathke, Christen and Diepenbrock2005). By contrast, low densities delayed the capture of radiation during vegetative and early reproductive stages, especially in the density of 15–60 plants m-2. At the visible floral bud stage, IS was 85% in the lowest density (15 plants m-2), while higher plant densities (more than 60 plants m-2) increased IS to 92–94% (Figure 3). IS achieved 92% for all tested densities at flowering, demonstrating that the light environment of the canola canopy was similar to treatments by adjusting canopy plasticity at the population level (Kuai et al., Reference Kuai, Li, Ji, Li, Xie, Wang and Zhou2021; Menendez et al., Reference Menendez, Sanchez, Snowdon, Rondanini and Botto2021). From flowering to maturity, low densities (less than 60 plants m-2) resulted in low IS under a dense layer of green pods, which was attributed to enhanced floral branching (Li et al., Reference Li, Naeem, Ali, Zhang, Liu, Ma and Zhang2017). In the present research, no significant difference in IS for a wide range of plant densities was observed at the pod-filling stage, reflecting that the light quantity and quality at post-flowering affected reproductive parameters at harvest (Rondanini et al., Reference Rondanini, Vilarino, Roberts, Polosa and Botto2014).
Lodging resistance and related traits in response to population density
At low densities (less than 60 plants m-2), a rapid increase in the plant density caused a decrease in lodging resistance and breaking resistance (Figure 5). Thus, the lodging resistance requirement should be satisfied, while seed yield of canola needed to be maximized through a relatively higher population density in the direct-seeding cropping system. Lodging resistance was closely associated with the actual crop lodging index in the field (Islam et al., Reference Islam, Peng, Visperas, Ereful, Bhuiya and Julfiquar2007). The accumulation of dry biomass per unit length was responsible for the reduction in crop lodging and thus the improvement of lodging resistance (Khan et al., Reference Khan, Anwar, Kuai, Ullah, Fahad and Zhou2017; Kuai et al., Reference Kuai, Sun, Zuo, Huang, Liao, Wu, Lu, Wu and Zhou2015, Reference Kuai, Sun, Zhou, Zhang, Zuo, Wu and Zhou2016). These results revealed that canola yield was improved by selecting a rationally high plant density (around 60 plants m-2) and obtaining an acceptable lodging resistance.
Implications of rationally increasing density for canola cultivation in China
Direct-seeded canola has been a promising and efficient strategy for increasing farmers’ prosperity because of the reduced labor input in canola cultivation (Wang et al., Reference Wang, Cheng and Hu2015). Moreover, increasing plant densities would be the dominant strategy for achieving more seed yield (Ren et al., Reference Ren, Liu, Lu, Deng, Li and Cong2017). However, there is little research on the effects of high population density on yield and its associated traits for direct-seeding canola in China. Based on the wide range of plant densities, our findings reinforced the importance and practicability of rationally higher plant density under a direct-seeding winter canola planting system in China. A reasonably high plant density could be no less than 60 plants m-2 for hybrid and conventional cultivars, and it should be considered a crucial value in direct-seeding canola. Our study enriched the common perception that plant density manipulation was the imperative practice for trade-offs among high plant density, low crop lodging index, and efficient sunlight interception. Our study demonstrated that planting density should be increased by no less than 30 plants m-2 on the basis of current conventional planting density in canola farming areas of China regardless of cultivars. This could considerably drive the progress in the current unit area and increase the total output, especially in the direct-seeding planting system.
This proposed reasonable high density was determined based on canola seed yield, sunlight interception, and lodging resistance. A reasonable increase in canola density also promoted full mechanized production and field environmental profitability, such as facilitating mechanical harvesting, reducing fertilizer supply, and performing weed control (Dellero et al., Reference Dellero, Jossier, Bouchereau, Hodges and Leport2021; Liu et al., Reference Liu, Ren, Zhang, Li, Cong, White and Lu2019; Rastegar et al., Reference Rastegar, Zare, Sharafzadeh, Ordookhani and Alizadeh2018; Ren et al., Reference Ren, Liu, Lu, Deng, Li and Cong2017). Increasing the plant density was beneficial to improving fertilizer use efficiency, and fertilizer loss could be significantly curtailed at high densities (Ren et al., Reference Ren, Liu, Lu, Deng, Li and Cong2017). Reasonable high population density facilitated mechanical harvest since more uniform seed maturation was achieved through fewer pod-bearing branches (Li et al., Reference Li, Zuo, Chang, Bai, Kuai and Zhou2018). With the appropriate high planting densities, the development of canola pods and seeds synchronized among plants in a field, resulting in an increased seed oil yield (Lilley et al., Reference Lilley, Flohr, Whish, Farre and Kirkegaard2019). Additionally, reasonably high plant density can improve weed control and efficiently reduce the use of chemical herbicides (Rastegar et al., Reference Rastegar, Zare, Sharafzadeh, Ordookhani and Alizadeh2018). Finally, the increased plant density improved the seed quality of winter canola, involving fewer branch pods, enlargement of seed size, increase in seed weight, and improvement of seed fatty acid composition (Li et al., Reference Li, Zuo, Chang, Bai, Kuai and Zhou2018; Wang et al., Reference Wang, Wang, Kuai, Li, Bai and Zhou2021). Further investigation of the source–sink relationship under high planting density deepened the understanding of the underlying mechanisms of seed quality formation in direct-seeding canola.
Conclusions
High planting densities provided a larger leaf and pod area for the rapid growth of the canola population canopy. Light interception presented significant differences in a wide range of plant densities at the pod filling stage. Lodging resistance and breaking resistance remarkably decreased and remained steady with the increasing plant density. A reasonably high plant density could be no less than 60 plants m-2 for hybrid and conventional cultivars. As suggested by these observations, canola planting density should be reasonably increased to 60 plants m-2 for maximizing yield and improving its associated traits. Meanwhile, this can facilitate mechanical harvesting in the direct-seeded cropping system in China and other regions with similar ecology.
Acknowledgements
This work was financially supported by the National Natural Science Foundation of China (31660354), Scientific Research Foundation for Doctors of Tongren University (trxyDH1608), Guizhou High-level Innovative Talents Project (2020-2018-034), Funds for High-end Talents of Tongren University and School-level Support Project of Tongren University (GJPY[2020]21).
Competing Interest
The authors declare no competing financial interests.