Introduction
Devices for optical fibre communication require emission wavelengths between 1.3 and 1.55 µm. Bandgap tuning of GaAs based devices to reach this range can be achieved by alloying GaAs with nitrogen due to the large bandgap bowing of GaAsN [Reference Weyers, Sato and Ando1]. A nitrogen content up to 4% leading to a near band edge PL at 1.25 µm was recently achieved in Metal Organic Vapor Phase Epitaxy (MOVPE) using dimethylhydrazine (DMHy, Me2NNH2) as nitrogen source [Reference Bhat, Caneau, Salamanca-Riba, Bi and Tu2,Reference Ougazzaden, Bellego, Rao, Juhel, Leprince and Patriarch3]. To further lower the bandgap, the nitrogen content in the layers has to be increased. Due to a large miscibility gap [Reference Qui, Nikishin, Temkin, Elyukhin and Kudriavtsev4], growth at low temperatures is required to attain a sufficient degree of nitrogen incorporation. We used tertiarybutylhydrazine (TBHy, tBu(H)NNH2) as a novel nitrogen precursor for low pressure MOVPE of GaAsN. Due to a comparably weak tertiarybutyl-nitrogen bond strength, TBHy has a distinctly lower total decomposition temperature (around 350°C) compared to DMHy [Reference Pohl, Möller, Knorr, Richter, Gottfriedsen, Schumann, Rademann and Fricke5]. TBHy thus appears suitable to achieve a high nitrogen content in the layers. Furthermore, a decreased carbon incorporation was reported for GaN epilayers grown using TBHy [Reference Pohl, Knorr, Möller, Gernert, Richter, Bläsing, Christensen, Gottfriedsen and Schumann6].
Experimental Procedure
Epitaxy was performed on GaAs(001) substrates at temperatures between 530 and 570 °C using TMGa, TBAs or AsH3, and TBHy under hydrogen carrier gas. V/III ratios were adjusted to 15 and 200 for TBAs and AsH3, respectively, using a constant TMGa flow of 20 µmol/min. The partial pressure ratio of the group V flows of the nitrogen and arsenic sources x v =P TBuHy/( P TBuHy + P As) was varied in the range 0.55 to 0.87. As a first step, we grew thick, relaxed layers with about 0.5 µm thickness to study the surface morphology. Based on these studies, we fabricated 20 nm thick GaAsN wells which were cladded by GaAs. Rocking curves were recorded using Cu Kα radiation in a high resolution double crystal diffractometer equipped with a double reflection Si(220) monochromator in (++−) arrangement. Thick layers were additionally characterised by Bragg Θ-2 Θ scans using a single crystal diffractometer. Photoluminescence was excited using the 514 nm line of an argon laser, dispersed by a 50 cm monochromator with ∼3.3 nm/mm linear dispersion and detected by a cooled Northcoast PIN diode.
Relaxed GaAsN Epilayers
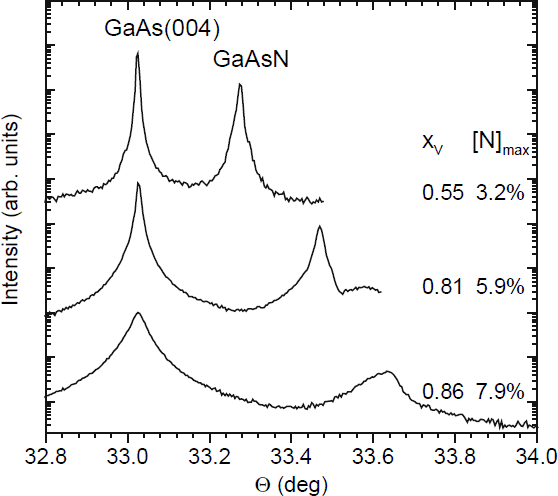
The 0.5 µm thick GaAsN layers show smooth, mirrorlike surfaces. A hatch pattern is visible under a Nomarsky microscope, thereby indicating a relaxation by misfit dislocations even for layers with a low nitrogen content. The nitrogen concentration was estimated from X-ray spectra (figure 1). If we assume a complete strain relaxation and apply Vegard’s law to lattice constants of 5.653 Å and 4.526 Å for GaAs and cubic GaN, respectively, the separation of layer and substrate reflections lead to nitrogen concentrations noted at the spectra in Fig. 1. These values [N]max represent upper bounds in case of a partial relaxation, as proved by a comparison with coherently strained, thin layers which were grown under comparable conditions. The layer with a high nitrogen content shows a broad reflection consisting of several superimposed peaks. This indicates that phase separation had occurred.
Rocking curves of the (004) reflection of 0.5 µm thick GaAsN/GaAs layers. xV denotes the nitrogen part of the group V flux, [N]max is the upper bound of the nitrogen content in the GaAsN layers determined from the spectra.
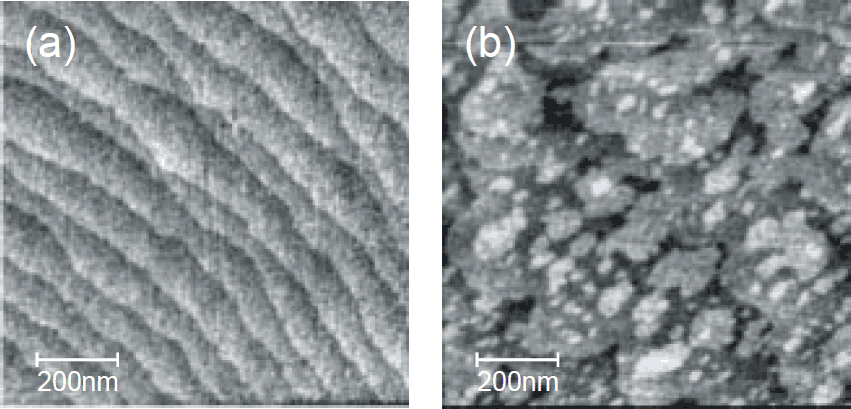
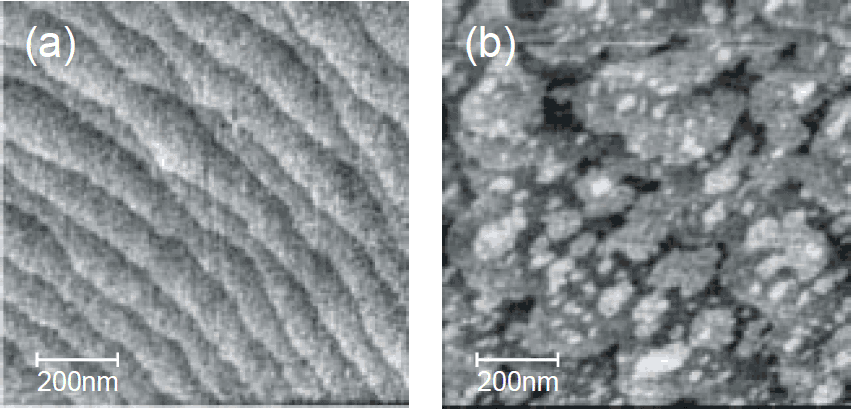
The surface morphology was analysed by atomic force microscopy (AFM) in a 1 µm2 scan region. The AFM image of a sample which was grown at 570 °C with 3.2 % nitrogen content shows smooth terraces with well defined steps of atomic height (figure 2a). The steps are believed to originate from a slightly misoriented substrate. The AFM image indicates a step flow growth mode which is also found for growth of pure GaAs at this temperature. For samples grown at a decreased temperature and a higher nitrogen concentration, a change of the surface morphology towards an island pattern which is superimposed on terraces is observed (figure 2b). Such a growth of two-dimensional islands is similar to that of GaAs grown under these conditions. The AFM study thus indicates that MOVPE growth of GaAsN is not significantly affected by the presence of the TBHy nitrogen precursor.
AFM images of 0.5 µm thick GaAsN layers, (a) grown at 570 °C with x v = 0.55, [N]max = 3.2 %, (b) grown at 530 °C with x v = 0.87, [N]max = 7.9 %.
GaAsN/GaAs Quantum Wells
Using optimized growth conditions, we grew thin layers of about 20 nm thickness in GaAsN/GaAs double heterostructures. The good structural quality of the GaAsN quantum wells is proven by well pronounced fringes proven in X-ray diffraction (figure. 3). The nitrogen contents of the GaAsN layers were determined by dynamic simulation of the rocking curves. For simulation we assumed a poisson ratio of 0.366 for cubic GaN [Reference Akasaki, Amano and Edgar7]. We find an increase of the nitrogen incorporation with decreasing growth temperature, similar to the findings reported for layers grown with DMHy [Reference Bhat, Caneau, Salamanca-Riba, Bi and Tu2].
X-ray rocking curves of the (004) reflection of 20 nm thick GaAsN layers, cladded by GaAs. [N] represents the nitrogen contents determined by dynamic simulations.
At low partial pressure ratios xV and consequently low nitrogen contents, the effect of using either TBAs or AsH3 arsenic precursor on the nitrogen incorporation is found to be small. A high nitrogen content was particularly achieved using TBAs at a comparably high group V ratio xV near 0.9 and a low growth temperature.
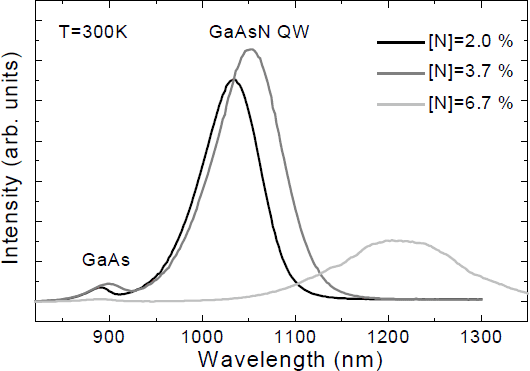
Photoluminescence spectra recorded at room temperature (RT) show the expected redshift of the luminescence with increasing nitrogen content (figure 4). The redshift is accompanied by a gradual increase of the PL halfwidth. This indicates an increasing inhomogeneity of the nitrogen distribution. At high nitrogen contents, the luminescence is found to decrease and recovers after thermal activation, e.g. by a post growth annealing of the samples. Such a behaviour was also found for samples grown with dimethylhydrazine [Reference Bhat, Caneau, Salamanca-Riba, Bi and Tu2,Reference Rao, Ougazzaden, Bellego and Juhel8], and was assigned to a reduction of N-H complexes [Reference Rao, Ougazzaden, Bellego and Juhel8]. In our case annealing was achieved by laser irradiation.
Room temperature photoluminescence spectra of 20 nm thick GaAsN/GaAs quantum wells, excited at 514 nm. [N] represents the nitrogen contents of the wells.

Conclusion
In summary, tertiarybutylhydrazine has proven to be a useful compound for the growth of GaAsN layers with good structural properties and high nitrogen concentrations. The nitrogen content was found to increase with decreasing growth temperature, and a concentration as high as 6.7 % was achieved using TBAs as arsenic precursor at a low growth temperature of 530 °C. Intensive luminescence of quantum well excitons is found for samples with moderate nitrogen composition (∼ 4 %). Samples with high nitrogen content require a thermal activation of the PL. Emission wavelengths peaking slightly above 1.21µm were achieved by now.