INTRODUCTION
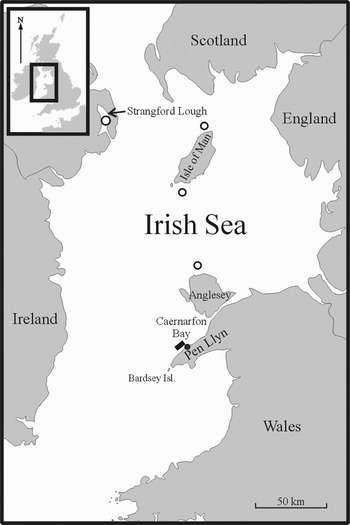
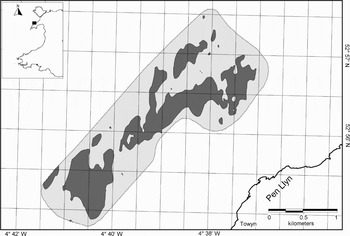
In the 1960s one of us (E.I.S. Rees, unpublished data) dredged samples from a Modiolus modiolus (L.) community off the north Pen Llŷn coast (see Figure 1). In 1994 further studies (unpublished) were undertaken using both RoxAnn™, an acoustic ground discrimination system (Chivers et al., Reference Chivers, Emerson and Burns1990), and a sledge-mounted underwater still-camera over the same ground. RoxAnn™ uses an echo integration method to derive values for the whole of the first multiple return echo (E2) and the tail component (decay) of the first return echo (E1). Generally speaking, these values correspond to the gross reflectivity or ‘hardness’ and the small-scale backscatter or ‘roughness’. Combining E1, E2 and depth information with ground-truthing can be used to discriminate seabed types (e.g. Chivers et al., Reference Chivers, Emerson and Burns1990; Heald & Pace, Reference Heald, Pace and Papadakis1996). This early work suggested that RoxAnn™ showed changes in the acoustic properties of the seabed between ground densely covered with M. modiolus and the surrounding areas of lag gravel and cobbles. Often there was a detectable change in the depth reading from the echosounder at the apparent edge of the bed, implying some ‘mounding up’ as a reef (E.I.S. Rees, unpublished data). Work carried out at the same time in Strangford Lough (Figure 1) by Magorrian et al. (Reference Magorrian, Service and Clarke1995) showed similar contrasts in acoustic properties between the M. modiolus beds and adjacent ground types using RoxAnnTM. Subsequently, a more extensive RoxAnnTM survey in the Pen Llŷn area, integrated into a global information system (GIS), allowed the general extent of the broad habitats to be identified (Cook, Reference Cook and Sanderson2001).
Location of the Pen Llŷn study area (rectangle) and Porth Dinllaen (filled circle). Other locations where horse mussel (Modiolus modiolus) reefs have been described are also indicated (open circles).

In the Bay of Fundy, Wildish et al. (Reference Wildish, Fader, Lawton and MacDonald1998) showed that side-scan sonar was very effective at displaying the gross morphology and extent of mounded bedforms that were probably M. modiolus ‘bioherms’. Similarly studies in North America show that oyster beds can also be effectively discriminated using side-scan sonar methods (Wright et al., Reference Wright, Prior, Hobbs, Byrne, Boone, Schaffner and Green1987; DeAlteris Reference DeAlteris1988; Roberts et al., Reference Roberts, Supan and Winans1999; Wilson et al., Reference Wilson, Roberts and Supan2000; Grizzle et al., Reference Grizzle, Ward, Adams, Dijkstra, Smith, Barnes and Thomas2005). Also in deep-water (<1200 m), deep-tow side-scan sonar systems can effectively discriminate cold-water coral reefs from within complex sediment bedform fields (e.g. Huvenne et al., Reference Huvenne, Blondel and Henriet2002; Akhmetzhanov et al., Reference Akhmetzhanov, Kenyon, Ivanov, Wheeler, Shashkin, van Weering, Mienert and Weaver2003; Fosså et al., Reference Fosså, Lindberg, Christensen, Lundälv, Svellingen, Mortensen, Alvsvåg, Freiwald and Roberts2005; Meinis et al., Reference Mienis, van Weering, de Haas, de Stigter, Huvenne and Wheeler2006). However, in the sheltered conditions of Strangford Lough, where the horse mussels occurred as continuous beds, with little relief, or as scattered clumps (Erwin et al., Reference Erwin, Picton, Connor, Howson, Gilleece and Bogues1986; Brown, Reference Brown1990), side-scan sonar was less discriminating (Nunny, Reference Nunny and Service1990).
Side-scan sonar and a multibeam echosounder were used on the Pen Llŷn M. modiolus reef in the present study to determine whether the horse mussel community could be detected and hence comprehensively mapped. Using extant RoxAnnTM data and boomer data collected in parallel with the side-scan sonar, the present paper also intends to provide more understanding of the acoustic characteristics and bed-forms present and is part of a series of three papers published here. In the other two papers the bed-form relief is shown to strongly influence the distribution and abundance of epifauna (Sanderson et al., Reference Sanderson, Holt, Kay, Ramsay, Perrins, McMath and Rees2008), and the local variability in the abundance of the associated infauna and crevice fauna (Rees et al., Reference Rees, Sanderson, Mackie and Holt2008). Overall, this work has management implications because the reef is an important component of a Special Area of Conservation under the EC Habitats & Species Directive (Council Directive 92/43 EEC).
MATERIALS AND METHODS
A C-MAX 800 side-scan sonar was deployed from RV ‘Prince Madog’ during the week starting 26 July 1999. A sub-bottom profiling system, using a broadband high-resolution ‘boomer’ source (IKB Seistec) from 400 Hz to about 10 kHz, was run simultaneously over part of the same area. The return signals from the boomer were filtered between 1 and 4 kHz. Bedforms identified on the side-scan sonar were subsequently ground truthed using a sledge-mounted video camera. In the previous year trials had been made with the same side-scan equipment at a series of range settings from 50 m to 200 m and with the sonar fish at various heights above the seabed: the 150 m range at the high frequency (325 kHz) setting, with the sonar fish 4–7 m above the bed was an appropriate compromise between resolution and coverage. The survey area chosen was approximately 10 km long and 6 km wide, adjacent to the Pen Llŷn coast south-west of Porth Dinllaen, and about 1.5 km offshore (Figure 1). Lines parallel to the coast were surveyed in the direction of the prevailing currents. In this configuration, the sonar fish lined-up directly behind the vessel. The survey pattern allowed for complete coverage but without much overlap so that with slight deviations from course full cover was not achieved.
The side-scan sonar data were processed by adjusting the bottom tracking and balancing the gain of both channels in the Octopus 461 sonar toolkit (Octopus Marine Systems Ltd.). Navigation data were then extracted, edited to remove turns and filtered to smooth the tracks. At this stage the layback correction was applied: calculated using trigonometry based on the length of wire out and the depth of the tow-fish. The side-scan sonar data were then converted to mosaic tiles using the Auto Mosaic utility of the Octopus 461 sonar toolkit. In the process, slant range correction was applied to remove the water column from the data and adjustments were made to overall gains, contrasts and data density to obtain the optimum image. This process provided bitmap and GeoTIFF files over the survey area that were 500 m × 500 m (2000 × 2000 pixels) with a pixel size of 0.25 × 0.25 m. These files were transferred to a MapInfo GIS package and a full mosaic made. The seabed features evident in the mosaic were then digitized in MapInfo. Confidence in the boundaries between the bed-forms was documented, in terms of those parts of the boundaries that were either distinct or required some degree of interpretation by the operator.
The North Western and North Wales Sea Fisheries Committee had conducted a RoxAnn™ survey off the north Pen Llŷn in 1997 using a system linked to a Scorpio DGPS (Cook, Reference Cook and Sanderson2001). The data from the parts of this survey in the vicinity of the M. modiolus reef were re-interpreted to examine the acoustic characteristics of the bedforms. Modiolus modiolus reefs were thought to have a low ‘E2’ return compared to other seabed types in the north Pen Llŷn area (E.I.S Rees, personal observation). E2 is derived from the whole of the first multiple return echo and is primarily a function of the gross reflectivity that is often the ‘hardness’ of the benthos. The M. modiolus reef polygon from the interpreted side-scan sonar data was used in the GIS to select the E2 data from inside and outside the reef. In order to eliminate any errors associated with position or boundary problems, a 100 m buffer inside and outside of the side-scan reef polygon was created so that only E2 values that were definitely inside or outside the reef were selected. The mean of the E2 values for the reef area was then tested to determine whether it was significantly different from the surrounding bed forms.
From the 23 to 27 June 2005, a multibeam echosounder survey of the same area was completed onboard the RV ‘Celtic Voyager’ using a Simrad EM1002 95 kHz multibeam echosounder. Ship position was fixed using the vessel's GPS with differential corrections provided via Fugro satellite broadcasts (Starfix system). Relative motion of the vessel was obtained using a SEATEX Seapath 200 GPS-aided inertial motion sensor recording heading, pitch, roll and timing offsets of the motion sensor relative to the transducers. The system was also calibrated for changes in water mass sound velocity using a sound velocity probe (Applied Microsystem Ltd.).
Data were processed to filter motion sensor and navigation data using a Caris/Hydrographic Information Processing System package with erroneous sounding data removed manually on-screen. Tidal corrections were derived from the Proudman Oceanographic Laboratory tidal model supplemented with tidal data from a gauge in the Menai Strait. Motion sensor, navigation and tide data were then combined to provide geographically positioned, clean soundings which were then gridded and reduced to Chart Datum. Acoustic backscatter data were projected into map coordinates using Caris/Sonar Image Processing System and provided as further Tiff images of the survey areas.
RESULTS
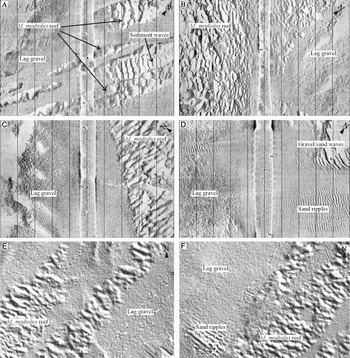
The main Modiolus modiolus reef occurred between 25 and 35 m below Chart Datum and could be identified from side-scan sonar and multibeam echosounder images as a series of undulating structures that differed substantially from the surrounding lag gravel bedforms and their associated sand ripples. Modiolus modiolus reef appeared on the side-scan sonar and multibeam records as dark (reflections) and white (shadows) forming a characteristic ‘mottled’ image (Figure 2). Ground-truthed areas of M. modiolus undulations had a mean wavelength of 11.7 m (SD 3.4, N = 30) and amplitude of 0.24 m (SD 0.1, N = 30) and varied from 6–18 m in length and 0.09–0.45 m in amplitude. Gravel waves (often with some cobble and shell) were the most similar bedform to the Modiolus but had a mean wavelength of 6.5 m (SD 1.98, N = 30) and amplitude of 0.07 m (SD 0.05, N = 30) and varied from 3–11 m in length and 0.03–0.25 m in amplitude. A t-test with separate variance estimates (see Welch Reference Welch1938) confirmed that these wavelengths and amplitudes were highly significantly different (t = −8.9, P << 0.01 for wavelengths and t = –13.8, P << 0.01 for amplitudes).
Side-scan sonar images of horse mussel reef from the north Pen Llŷn using a Cmax 800. (A) Thin ribbon/finger-like structures at the north-eastern extremity of the reef; (B) fragmented reef edge; (C) definitive reef edge; (D) bedforms recorded in the vicinity of the Modiolus modiolus reef using side-scan sonar. Distances between vertical scale lines are 20 m; and (E & F) finger-like extensions of the Modiolus modiolus reef recorded using multibeam echosounder and presented at the same scale as A–D.

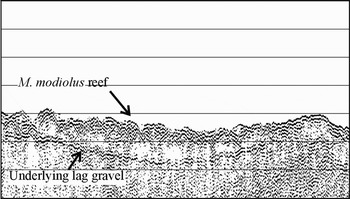
Records from the boomer (Figure 3) showed the M. modiolus bedform was built-up to as much as 1 m over the underlying gravelly substratum. The M. modiolus undulations were not as straight as the sediment wave crests but were nevertheless ‘transverse’, i.e. roughly normal to the tidal current direction.
High resolution ‘boomer’ profile from the IKB Seistec sub-bottom profiling system. Undulating horse mussel reef surface is visible with underlying lag gravel and cobble. Horizontal scale lines are 1.5 m apart and horizontal distance is 220 m.

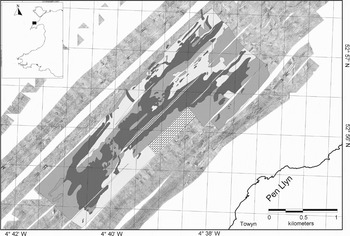
Based on the above identification criteria, the M. modiolus reef structures and other sedimentary bedforms and seabed types were plotted on the sonar interpretation (Figure 4). The same textural features used to distinguish the M. modiolus reef from side-scan sonar data were also applied to the multibeam dataset (Figure 5).
Interpreted side-scan sonar map of the bed-forms in the vicinity of the Pen Llŷn horse mussel reef from the 1999 survey. Deep red is Modiolas modiolus reef; patchy M. modiolus cover is pale red; low and medium reflectivity are pale blue and dark blue respectively. Also: signal lost (brick pattern); interpolated reef between survey tracks (red dots); and isolated unidentified bed features (green).

Map of horse mussel (Modiolus modiolus) reef using interpreted multibeam data from the 2005 survey. White outline shows the reef areas.

The area of the Pen Llŷn M. modiolus reef, measured from the digitized side-scan mosaic polygon in the GIS, was 349 hectares in 1999. The proportion of reef boundary decisions that were clear-cut during digitizing was 82%. Of the remainder, some might cause minor interpretive variability between workers if the work was repeated. There was generally high confidence in the boundaries interpreted between the M. modiolus reef and other bedforms but boundaries between patchy reef and other bedforms (9% of the total boundaries) was a source of possible interpretive variability. Interpretation of multibeam data produced an estimate of the area of reef at 373 hectares in 2005.
The mean E2 value associated with the M. modiolus reef was significantly lower than those of other bed types in the vicinity (t-test: t = 35.93, df = 1990, P < 0.01). Confidence intervals showed that E2 values less than 0.341 were 95% certain to be M. modiolus reef. Figure 6 shows RoxAnn™ data interpolated using Vertical Mapper (Northwood Geoscience, Ltd. Ontario, Canada). Using this method the area of M. modiolus reef was measured as 354 hectares from the 1997 data.
Map of horse mussel (Modiolus modiolus) reef using interpolated RoxAnn™ E2 data (shaded grey) from 1997 survey. Darker grey areas are where E2 < 0.341.

DISCUSSION
Bed-forms
The north Pen Llŷn Modilous modiolus reef occurs in an area of average spring tides around 2 knots or 100 cms−1 (Hydrographic Office, 1992) and at a depth of 25–35 m below Chart Datum. Under these bathymetric and tidal regimes large sand waves (up to 10 m high, i.e. 1/3 depth of water) would be expected if it were an area of high sediment (sand/gravel) supply. Conversely, sand ribbons (and streaks) are expected in similar areas of low sediment supply (see e.g. Belderson et al., Reference Belderson, Johnson, Kenyon and Stride1982). Banner banks with elevations of 10 m (e.g. the Tripods) are known about 20 km to the south-west around Bardsey Island (see British Geological Survey, 1988; Darbyshire et al., Reference Darbyshire, Mackie, May and Rostron2003). However, throughout the study area and north-east into Caernarfon Bay, sand ribbons and sand streaks were the dominant bedforms recorded on a gravelly substrata by the British Geological Survey (1988) and again here (Figure 2D). The biogenic reef presented here was an unreported bedform in the former British Geological Survey study. Video records in the present study confirmed a gravel and cobble lag deposit as the major sediment type adjacent to the M. modiolus reef and the ‘boomer’ records indicated that it was also buried beneath the reef to a depth of 0.5 to 1 m depending on the amplitude of the overlying undulating bedform. The undulations of the M. modiolus reef are anomalously irregular compared to what might be expected from a purely sedimentary bedform in the same area (Figure 2) and are easy to differentiate visually with the relief features; both Modiolus modiolus reef structures and sediment waves, have an easily distinguished waveform structure casting acoustic shadows. This is in clear contrast to the more level gravel lag with a mottled backscatter signature (Figure 2A–F) and the smaller scale waveforms of the sand ripple field (Figure 2D). Distinguishing between Modiolus modiolus reef structures and sediment (gravel) waves is also practical to the semi-trained eye with sediment waves having a straighter crest and smoother backscatter pattern to Modiolus modiolus reef structures under the same hydrodynamic conditions (Figure 2A & F). Similar criteria have also proved useful in distinguishing cold-water coral reefs from sedimentary bedforms within sediment wave fields (Wheeler et al., Reference Wheeler, Kozachenko, Beyer, Foubert, Huvenne, Klages, Masson, Olu-Le Roy, Thiede, Freiwald and Roberts2005b). The irregular nature of crest alignments in the Modiolus modiolus reef structures is also clearly shown in Figure 2B, C, E & F. At the extremities of the main reef structure there were a number of more longitudinal, ‘ribbon’ or ‘finger-like’ extensions of the reef complex (Figure 2A, E & F). These were usually parallel to each other and were aligned along the axis of the prevailing current, separated by areas of lag gravel.
However, more unusually, the sediment of the horse mussel reef is composed (apart from shell material) of fine sand, very fine sand and silt/clay (see Rees et al., 2008) that ordinarily do not form waves under these relatively tide-swept conditions.
As in the present study, Roberts et al. (Reference Roberts, Davies, Mitchell, Moore, Picton, Portig, Preston, Service, Smyth, Strong and Vize2004) found areas of horse mussel in Strangford Lough had comparatively ‘moderate to low levels’ of E2. They attributed this effect to dense epifauna softening the return signal. However, it is also likely that the horse mussels themselves, at densities of several hundred per square metre (Rees et al., 2008), are acting almost like insulating sound cones in a recording studio because the mussels are found clumped together and orientated with their longitudinal axis, in many cases, facing upwards (Sanderson et al., 2008).
Mapping and monitoring horse mussel beds
The Pen Llŷn M. modiolus reef with its raised, characteristic undulating bedform was readily distinguishable from side-scan sonar data and mapped fairly accurately. Low subjectivity in interpretation suggests that the method is appropriate for making comparable repeat-measures over time. Interpretation of multibeam data was similarly accurate because it used the same ground-truthed benthic textures to the side-scan sonar and provided similar area estimates and reef polygon shapes. For a small proportion of the reef, with patchy M. modiolus, discrimination from side-scan sonar was harder than where the bed was raised; confirming the experience with side-scan sonar in parts of Strangford Lough where scattered clumps were prevalent (Nunny, Reference Nunny and Service1990). It seems that only reefs dominated by the raised undulating bedform are easily discriminated using present side scan sonar and multibeam technology. This M. modiolus reef morphology, however, might easily be mistaken for other tidal sedimentary bedforms if the irregularity of the undulations and low return from the whole of the first multiple return echo go unnoticed.
The difference between area estimates derived from side-scan sonar, multibeam and RoxAnn™ surveys conducted over 7 y was less than 6%; within the scale of interpretive error identified in the present work. This aside, the various merits of the three systems at determining the presence of M. modiolus reefs needs to be discussed. Side-scan sonar and multibeam collect a swathe of data achieving complete coverage whereas RoxAnn™ collects data in a larger footprint directly below the boat and requires interpolation (with associated errors) to produce a map. The interpolated map (Figure 6) is therefore only a close approximation to the other maps (Figures 4 & 5) and shows less spatial complexity. On the other hand, RoxAnn™ software calculates numerical indices theoretically avoiding a degree of subjectivity in interpretation compared to side-scan sonar and multibeam (assuming that the RoxAnn™ data are effectively calibrated with robust groundtruthing at the survey stage). Nevertheless, Kenny et al. (Reference Kenny, Cato, Desprez, Fader, Schűttenhelm and Side2003) urge caution when directly comparing readings taken during different RoxAnn™ surveys because of difficulties delivering the same power level into the water column on different occasions. Narrower beam geometry and power output stabilization have improved since the present work but RoxAnn™ has not yet been shown to be a suitable monitoring tool other than when gross community changes occur (see e.g. Hamilton et al., Reference Hamilton, Mulhearn and Poeckert1999; Foster-Smith et al., Reference Foster-Smith, Brown, Meadows, Rees and Davies2001). The increasing application of textural analysis and Acoustic Ground Discrimination Software (AGDS) to swathe systems, such as side-scan sonar and multibeam data, offer the same advantages of RoxAnn™ without the need for inter-line interpolation. Interesting results have been achieved using textural analysis of side-scan data (e.g. Huvenne et al., Reference Huvenne, Blondel and Henriet2002), on multibeam data (e.g. Kostylev et al., Reference Kostylev, Todd, Longva, Valentine, Barnes and Thomas2005; Wakefield et al., Reference Wakefield, Whitmore, Clemons, Tissot, Barnes and Thomas2005) and using more advanced algorithm based commericial products such as Quester Tangent Ltd.'s QTCView (e.g. Ellingsen et al., Reference Ellingsen, Gray and Bjørnbom2002).
When comparing the two swathe based systems, two fundemental considerations should be noted. Due to the nature of beam generation side-scan sonar suffers from changing resolution across-track with a decrease in spatial resolution from near to far beam with an increase in object detection (due to lower grazing angles and therefore enhanced acoustic shadow generation). Multibeam echosounders do not suffer from this; they project poorer backscatter responses as they are primarily a bathymetric tool. Furthermore, unless multibeam systems are deep-towed (e.g. Wheeler et al., Reference Wheeler, Beyer, Freiwald, de Haas, Huvenne, Kozachenko and Olu-Le Roy2007) in deep-water, spatial resolution may be limited.
In the present study, side-scan sonar has produced the highest resolution data with apparently low interpretive errors but if the undulating bedform decayed to a patchy bedform, a side-scan sonar monitoring approach would lose the ability to accurately measure areas of M. modiolus. Although restricted in coverage, RoxAnn™ might still be able to detect the presence of high density patches. Overall, a swathe system with the ability to analytically differentiate acoustic backscatter, would therefore provide the greatest versatility in a monitoring programme.
Degradation of parts of the M. modiolus beds in Strangford Lough have probably occurred as a result of trawling, causing progressive fragmentation into scattered and smaller mussel clumps (see Roberts et al., Reference Roberts, Davies, Mitchell, Moore, Picton, Portig, Preston, Service, Smyth, Strong and Vize2004). In this scenario, it would probably be much more difficult to define the edges of the Pen Llŷn horse mussel beds using the technology presented here. Nevertheless, Kenny et al. (Reference Kenny, Cato, Desprez, Fader, Schűttenhelm and Side2003) suggest that side scan sonar is a suitable method for detecting anthropogenic activities such as trawl and dredging in bioherms. Indeed, marks made by benthic trawl gear are known to be detectable with side scan sonar (e.g. Klrost et al., Reference Krost, Bernhard, Werner and Hukriede1990; Friedlander et al., Reference Friedlander, Boehlert, Field, Mason, Gardner and Dartnell1999; Beaulieu et al., Reference Beaulieu, Poppe, Paskevich, Doran, Chauveau, Crocker, Beaver and Schattgen2005; Wheeler et al., Reference Wheeler, Bett, Billett, Masson, Mayor, Barnes and Thomas2005a) disappearing within less than five months in areas of strong currents (Humborstad et al., Reference Humborstad, Nøttestad, Løkkeborg and Rapp2004) with slower recovery rates in less dynamic environments. Side scan sonar might therefore provide suitable evidence for management action given that the reef is protected under the EC Habitats & Species Directive (Council Directive 92/43 EEC).
Longevity
Forbes (Reference Forbes1850) mentions dredging M. modiolus in 1846 at positions 1–2 miles offshore in the south-west part of Caernarfon Bay, North Wales, at depths of 15–20 fathoms. The depths and distance from land would imply that Forbes sampled the same M. modiolus reef as the present study. In the 1960s, using Decca for position fixing, dredge surveys picked up a M. modiolus community at three stations coinciding with the location of the same reef (E.I.S. Rees, unpublished data). Elsewhere off North Wales, Admiralty Chart surveys in the 1843–1846 period (British Geological Survey, 1990) had also recorded mussels near to locations where large clumps of M. modiolus were dredged in the mid-1960s (E.I.S. Rees, unpublished data). This evidence and the longevity of individual mussels (Anwar et al., Reference Anwar, Richardson and Seed1990), suggests that the North Wales biogenic reefs have probably persisted for longer than 150 y. We report relatively minor differences in area estimates and a similar shaped reef over several years, also suggesting a relatively stable structure that would have had ample time for the accumulation of shell and other biodeposits to have built up into the medium-scale bedform morphology seen here.
CONCLUSIONS
The present work shows that this M. modiolus reef type is morphologically and acoustically distinct and can therefore be mapped and monitored relatively accurately using acoustic methods. Side-scan sonar was the most discriminating method used. The apparent longevity of the reef and the marked similarity over several years indicates that a spatially targeted, long-term programme of acoustic monitoring is achievable. However, to detect anthropogenic impact and the possible consequences of it, a swathe system with the ability to analytically differentiate acoustic backscatter would probably be most appropriate.
ACKNOWLEDGEMENTS
Most of this work was a partnership between the Countryside Council for Wales (CCW), the University of Wales Bangor and North Western & North Wales Sea Fisheries Committee during the ‘UK Marine SACs Project’, a project receiving support from the EC LIFE programme. Multibeam data were provided by the INTERREG IIIA ‘HABMAP’ project, courtesy of staff at the University of Cork, University of Cardiff, Marine Institute and the Countryside Council for Wales. The Masters and crews of RV ‘Prince Madog’, RV ‘Celtic Voyager’ and FPV ‘Aegis’ were of much assistance during the surveys and Tom Stringell provided analytical support. Ordnance Survey base maps are reproduced with permission of HMSO. Crown copyright reserved. CCW licence No. 100018813. Referees comments were appreciated.