How did free and fair democratic elections lead to the extraordinary antidemocratic Nazi Party winning control of the Weimar Republic? The profound implications of this question have led “Who voted for Hitler?” to be the most studied question in the history of voting behavior research. Indeed, understanding who voted for Hitler is especially timely now, given the increase in radical and extremist parties in modern European elections. Yet, despite the overwhelming attention, scholars, mostly from history, sociology, and political science, have treated these elections as unique events and comparison with other elections as mostly irrelevant. The Nazi voting literature rarely draws on the extensive economic voting behavior literature or on modern statistical methods. That does not make the Nazi voting literature wrong, and we do not think it is wrong. But it suggests that learning something new about these extraordinary events may be possible. In this article, we offer a perspective on these elections that builds on the voting behavior literature and comparisons with other elections so that other scholars may be able to follow our example. We also introduce into this literature new methods of ecological inference designed specifically for this problem that increase the amount of information we can bring to bear on these venerable questions. Much of the current literature on the Weimar Republic treats the elections as a unique historical case, and indeed the consequences of the elections were extraordinary. In contrast, once we account for the underappreciated heterogeneity of voters' interests in these elections, we find that German voters responded in a fairly ordinary way, consistent with their interests and thus also consistent with the dominant pattern of findings about democratic elections in other countries and time periods.
Although the limits of the available evidence generate considerable uncertainties in all analyses including those presented here, our research suggests a number of new conclusions. First, one of the leading theories in the literature—that the Nazis were a “catchall” party, because the swing in their favor occurred roughly uniformly across many different social groups—misses the fact that most elections from numerous countries display essentially the same type of uniform partisan swing. As such, this theory, while not wrong, does not distinguish the Weimar elections from most others and so cannot be used to help explain what happened here. We instead find that an incentives-based retrospective voting account of this series of elections helps to organize a large collection of otherwise confusing facts. In particular, we find that the groups most hurt by the disastrous economic depression did not have homogeneous interests, and as a result did not behave in the same way. Those who were unemployed or at high risk of becoming unemployed gave disproportionate support to the Communists or, to a lesser extent, to the Social Democrats (in Protestant precincts), for good reason, whereas those who were hurt by the economy but were at little risk of unemployment—such as self-employed shopkeepers and professionals, domestic employees, and helping family members—constituted the groups that gave the most disproportionate support to the Nazis. Only the failure of Nazi agricultural policy to address the specific preferences of farmers in southern Germany, as well as the powerful economic incentives provided by the Catholic Church in favor of the Catholic Zentrum party persuaded some of the working poor, in particular, domestic and peasant workers, to remain loyal to the Zentrum. Where no such additional incentives were at work, namely, in the Protestant regions of Weimar Germany, the full power of the incentives for the working poor made them the key constituency for the Nazis, with vote shares for the Nazis being many percentage points higher than the national swing. By contrast, other social groups in Protestant precincts did not vote for the Nazis more than average.
We begin with a description of the historical Nazi voting literature, from a modern perspective, summarize our main substantive arguments, and compare our approach to others. We then describe our data, discuss our new methods, and introduce the specific methodological problem we address. We then present our empirical results and conclude.
THE HISTORICAL NAZI VOTING BEHAVIOR LITERATURE
From very early on, the paradox of a democratic system leading to the rise of an extreme antidemocratic party, and ultimately the end of democracy in a country, has generated great scholarly interest.Footnote 1 The literature as a whole, however, remains unsatisfying even to its contributors.Footnote 2 To understand the main issues and puzzles in the research on voting in the Weimar Republic, we summarize in this section the dominant historical explanations that have been offered. All teach us a great deal but each is nevertheless incomplete in at least some respects. These explanations include group-based theories and catchall theories.
Group-Based Theories
The literature offers two categories of group-based theories. The earliest is mass society theory, inspired by Javier Ortega y Gasset and others, who see extremist movements as having their strongest appeal to individuals on the social periphery.Footnote 3 Supporters of this approach focus on the irrational, anti-intellectual, and visceral nature of the Nazi appeal and they argue that this group was mostly composed of nonvoters.Footnote 4 Although this explanation is a favorite of political philosophers, recent studies have only rarely subjected it to empirical tests in real voting data.
The second category of group-based theories is class theory. First championed by Seymour Lipset and his followers, class theory holds that a different democratic and extremist form of political expression forms for each social group.Footnote 5 The result is a set of idiosyncratic and group-specific “radicalization hypotheses.”Footnote 6 However, scholars disagree as to the principles by which each class formulates or adopts each possible extremist expression. According to Lipset, “the ideal-typical Nazi voter in 1932 was a middle-class, self-employed Protestant who lived either on a farm or in a small community.”Footnote 7 In contrast, Richard Hamilton concluded that the upper classes (white-collar and self-employed) constituted core Nazi electoral support.Footnote 8 Researchers also argue that the Angestellte, an important component of white-collar workers, were caught between the simultaneous (and partially self-contradictory) push of the NSDAP towards a modern world and a conservative society.Footnote 9
There is yet another variant of the radicalization or class theory hypothesis. Critics of the lower middle-class thesis emphasize that although many in the lower middle class suffered from the Great Depression, not all of them became Nazi supporters. Walter Burnham provides an explanation in two parts: The Catholic Church armed some with enough social integration to keep them from falling prey to Nazi campaign appeals.Footnote 10 Others, such as the German lower middle class in Protestant areas were more on their own and thus more prone to increasing support for the Nazis. A scholar writing today would probably say the same thing in different words, explaining that “social capital” in the Weimar Republic, in the form of confessional or religious ties, protected some groups from Nazi party appeals.Footnote 11 Although many studies support this theory, others show that the identification of the Catholic and industrial proletariat sections of the German population was not complete.Footnote 12
In other words, almost any variant of an explanation that divides voters into social groups has been claimed to support class theory. This point does not necessarily make any of the variants wrong. It does suggest, however, that “class theory” is more of a framework than a theory (that is, it is not an idea that could in principle be wrong). It is also unsatisfying in that it seems to lead to complicated ad hoc explanations that do not help simplify anything. Such simplification is not always possible, but it is helpful when reasonable.
Catchall Theories
Many scholarly and popular accounts subscribe to the view that the Nazi party is best understood as a “catchall” protest party that attracts votes from a wide band of the social-class spectrum, at least in the election of 1930 or in the July 1932 election at the latest.Footnote 13 Scholars who prefer this view do not believe that everyone voted for the Nazis to the same extent, but there is considerable emphasis on how support came from all corners of society, and how all groups moved in the same direction and nearly the same magnitude.Footnote 14 Peter Stachura, for example, finds that the Mittelstand thesis regarding the social composition of the NSDAP before 1933 has been superseded in the literature by the argument that the party was socially heterogeneous, with a substantial presence of the working class and other groups.Footnote 15
A different variant of the catchall protest party perspective is the “mixed hypothesis” by Jürgen Falter and Reinhard Zintl.Footnote 16 This view, carefully presented by Falter, was that up to the last election on March 5, 1933, the NSDAP was a kind of people's or mass integration party whose core supporters were the middle classes, but which could (at least since 1925) also count on support from blue-collar workers and the upper classes.Footnote 17 This view has also been put forward by Eberhard Kolb, who subscribes to the notion that the NSDAP had its main support in the lower middle classes, but at the same time agrees with Hamilton that the upper and upper middle class were important constituents of the Nazis.Footnote 18 Therefore, according to Falter, the NSDAP cannot be truly characterized as purely a movement of the middle class. Rather, it was a “Volkspartei des Protests” (People's Party of Protest).
The catchall perspective has several weaknesses. First, to a large extent, catchall theory also applies to most groups and almost all big or growing parties in almost all countries, and so it does not show how the Weimar elections were distinctive. The description may be accurate, but it does not provide an explanation for the outcome. The notion of a catchall party arises from a specific empirical observation that in fact holds fairly universally. The idea begins with the fact that voter support for political parties can always be decomposed into national swings for or against individual parties and variation around those swings across local districts or social groupings. A strong pattern of democratic electoral politics, then, is that the two sources of variation are almost always unrelated. In other words, when one party receives x percent more of the vote nationwide, almost all districts and almost all social groups give x percent more of their vote to the party as well, plus or minus some random error.Footnote 19
The fundamental problem with catchall theories and with observations of uniform partisan swing is that neither necessarily says anything about which individuals voted for the Nazis. Recognizing these patterns, however, does enable us to isolate a dominant feature that might otherwise confound the identification of the patterns we seek to understand. The key to understanding what was special about the elections in Weimar Germany is to calculate properly the swings for all groups and to explain how each deviates from the nationwide average. This procedure, which we implement below, removes the gross, ordinary features of the election, and leaves the distinctive aspects to explain. As we show, what is distinctive about the Weimar elections is the particular incentive structure of the voters, which helps explain voting behavior there in much the same “ordinary” terms as elections in other times and places. The same procedure is productive, for the same reasons, in analyzing most elections.
AN ALTERNATIVE ARGUMENT
We follow the literature and take for granted that support for the Nazi party swung, as it did, from less than 3 percent of eligible voters in the December 1924 election to 31.1 percent in July 1932, 26.5 percent in November 1932, and 38.7 percent in March 1933.Footnote 20 Although this particular swing is obviously unique to Weimar Germany, we expect (and find) that this swing, like almost all national swings, affects the majority of social groups in almost the same way. The interesting question is which groups voted for the Nazis differently than the average. In answering this question, we focus on incentives in voting for the Nazis. Consequently, although our results suggest that the economic voting approach explains much variation of the voting for the other parties as well, we do not claim to present a unified and complete picture of voting in the Weimar Republic. We do not say much about the causes of the swing itself, about which an enormous amount has been written.Footnote 21 After the extreme hyperinflation of the years 1922/23, the years 1924–1928 were characterized by an economic boom and are frequently referred to as the “Golden Twenties.” However, already in 1927 and 1928, the leading indicators were beginning to show the first signs of a recession.Footnote 22 In contrast to Great Britain, France, and the United States, the German slump began with a gradual slide into depression. One highly contested hypothesis about the source of this slide is that high labor costs implied an “unavoidable” policy of deflation, while others see the cause in high interest rates and the unfortunate intervention of the German Reichsbank.Footnote 23 Whatever the exact mechanism, the national product reached its peak in 1928 and declined in the following years, leading to the loss of more than a quarter of GNP between 1929 and 1932. Unemployment started to rise, bankruptcy was rampant among firms, and the explicit policy of deflation started to show effects beginning in 1930.
These economic circumstances would be enough in elections in any other country to cause a swift exit from the ruling or established parties, and from moderate opposition parties to even more extreme opponents of the government as seemed to occur in Weimar Germany. In addition, Weimar Germany had a very young parliamentary system at the time, and so voter loyalties to the political system, if they would have existed in the face of such dire economic times, would likely not have been sufficiently entrenched to slow the electoral swings.Footnote 24 We therefore regard the national swing itself, and the fact that most groups and geographic areas shifted in roughly uniform amounts in the same direction as the national swing, as a fact common to democracies, not something that explains this election in particular. Instead, we look for what is unusual about group behavior in these elections in the same way as we would in any other election. We therefore ask which voter groups gave disproportionate support to the Nazis, support clearly more than or less than the national swing.
We consider two centrally important groupings, both of which have been studied separately, but not in the way we combine them. We consider the important distinction between Protestant and Catholic regions; no analysis of the Weimar Republic can ignore the differences between these regions, though scholars have emphasized them for different reasons. While some have studied whether Catholicism per se was less compatible with the Nazi movement, we emphasize the fact that the Catholic Church supported especially the Zentrum and related parties through direct and indirect economic incentives. Moreover, we find that the agricultural policies of the Nazis did not suit well the preferences of the people living in southern and western Germany, that is, the Catholic regions. The second dimension is that we also retain the focus on social groups common in both the Nazi and political science voting behavior literatures. The reason for this focus in both literatures is that different social groups tend, in most elections, to vote in clearly recognizable and predictable ways, at least relative to one another. However, for both the religious dimension as well as the social one, we use a different organizing principle from the culturally based explanations common in the Nazi voting literature. Cultural explanations, which make arguments about the propensities of particular social groups to prefer certain parties at specific times, are often “trivially” true or hard to disprove because they seem capable of fitting almost any observed behavior. The economic voting behavior literature has moved away from this style of explanation towards one based more on economic and other incentives. We follow this approach, and also William Brustein, who applied it in the context of who joined the Nazi party as members (rather than voters).Footnote 25 We wish to explore how far the incentive-based explanation can take us, but we do not view this approach as the only way to study Weimar Germany (or, for that matter, any other election).
From the perspective of incentives, the most obvious answer to the question of which groups gave disproportionate support to the Nazis is those who were hurt most by the severe economic depression. In even simpler terms, to answer the question of who voted for the Nazis, we might look for voter groups most likely to want to “throw the bums out.” Although in retrospect it turned out that the “bums” voted into office through the elections leading up to 1933 were far worse than those in office previously, even the political science voting behavior literature often assumes that most voter decisions are based on judgments about incumbents, about whom voters have behavioral evidence, instead of about challengers who can convey little but costless promises. A more formal version of this idea is “retrospective voting,” which holds that citizens would like to base voting decisions on their prospective evaluations of how candidates are likely to behave in office. However, the only reasonable measure of (unobservable) prospective evaluations is (observable) retrospective evaluations.Footnote 26
Adapting these interest-based theories to the Nazi voting literature would seem straightforward: voter groups that were dissatisfied the most should be those that the depression hurt the most. Thus, Brustein and Falter argue that “as groups became disaffected with the Weimar system and experienced higher deprivation, they embraced Nazism.”Footnote 27 This is clear logic, but of course the theory of retrospective voting, designed for two-party systems, cannot explain where the voters will go when they withdraw support from the governing parties in a complicated multiparty electoral environment.Footnote 28 Our task then is to identify factors that explain why certain groups of voters leaving the governing parties (or leaving the nonvoters) turned to the Nazis rather than other out parties like the Communists.
Our approach to the heterogeneity within those voters most hurt by the economic depression is to focus on the most relevant but simple categories.Footnote 29 First are the unemployed and blue-collar workers at high risk of unemployment (such as those in high unemployment precincts). The government did have social welfare policies designed for them (unemployment insurance existed since October 1927) and so did have some supporters among the unemployed. (The insurance program was dismantled between March 1930 and July 1932.) However, our research confirms earlier evidence that when the unemployed opposed the government, they turned primarily to the Communists, whose policies catered directly to them, not the Nazis. Moreover, the Nazis promoted autonomy, entrepreneurship, and private property, ideas which were not directed to the unemployed. In addition, Hitler's economic agenda (e.g., for example, Strasser's 1932 program) was focused on improving the general economic situation; even the proposals for obligatory work were not typically viewed as measures to improve the situation of the unemployed, but as means to stimulate the economy as a whole. Even in 1933, we find that Hitler's attempts to attract the unemployed had largely failed, perhaps because Strasser's “Sofortprogramm” was so short lived.Footnote 30
In contrast, we find that those who were hurt most by the depression and wound up supporting the Nazis were those at little risk of being unemployed. These include two groups that together we refer to as the working poor, which is a phrase used in the field of American politics within political science and within sociology, but has not previously been used to describe Weimar Germany.Footnote 31 We use it because the groups described this way were indeed working and they were poor, despite having other important characteristics. The group that fits this description most directly are the self-employed (Selbständige), the independent artisans, shopkeepers, small farmers, lawyers, etc.Footnote 32 Most accounts assume the self-employed were fervent supporters of the Nazis.Footnote 33 These individuals were hurt economically by the depression, but because they owned their firms they were at relatively low risk of unemployment. Instead, bad economic times would merely mean that they would make less money, often a lot less. Indeed, the crushing economic depression hit shop owners especially hard. It is true that this group also feared that they would lose the independence that their self-owned businesses provided and that their low earnings would force them to take regular jobs with a large firm; however, their main concern appears not to have been unemployment. As such, they were not moved by the social welfare policies of the government or those promised by the Communists.
Much of the Nazi's campaign appeal was heavily focused on ameliorating the economic depression and stabilizing the value of money. Although the Nazis did not document an economic program until the “Sofortprogramm” of May 1932 and the less concrete “Aufbauprogramm” with which they campaigned in November 1932, their economic ideas had been developing for over a decade. Nazi economic thinking had its roots in the national or statist school and has been compared to Keynesian economics (although there is no consensus in the literature, neither regarding its actual closeness to Keynesian economics, nor regarding its actual effects).Footnote 34 The Nazis focused strongly on state socialism and autarkic development. Indeed, some have argued that Nazi economics had close similarities with Soviet economies.Footnote 35 However, Christoph Buchheim and Jonas Scherner provide convincing evidence that in fact private property played a central role in the Nazi economic thinking.Footnote 36 NSDAP leaders also were in favor of urging investment in new capital goods, ensuring a cheap money policy, and initiating public investment. These policies appealed to self-employed individuals across the economic spectrum. Through denouncing government and big business, the Nazis could win friends among small shopkeepers and other independent folk (that is, in fact, what literally means Selbständige).Footnote 37 The party also complained about the reparation payments. In particular, they claimed that these payments to Germany's enemies had the effect of reducing purchasing power, decreasing employment, and reducing opportunities for business for the self-employed in Germany. At the same time, the NSDAP's proposal of intensive development of Germany's own economic resources was very much what many of the Selbständige craved. In addition, the NSDAP was perceived as a party that favored social mobility, which should have been popular among the entire working poor group. The party actively promoted private property and so turned off many unemployed, who either had little private property or generally supported more government intervention in the economy.
In the working poor category we also include another group which has surprisingly been neglected by scholars, despite its considerable size: domestic employees (who were particularly important in agriculture) and family members who helped their relatives and who were often classified in previous research as “others.” Like the self-employed, domestic employees and such helping family members suffered from the economic downturn, but they seldom became unemployed and were normally at little risk of unemployment. Some were living with and working for the self-employed and could not really be fired. The welfare system, which the government tried hard to maintain through the economic crises, had no particular attraction for them.Footnote 38 They had a hard time getting by, but their thinking must have been substantially different from that of the unemployed. In particular, they did not favor expropriation and community property, as the Communists did. Instead, they looked for a party that promised that they could make a better living. The Nazis were, for their time, the obvious candidate.
One important group among the domestic workers were agricultural laborers and peasant workers. Originally, the Nazi program had called for the expropriation of land for the commonwealth, which is hardly a suitable incentive to win farm votes. However, in April 1928, Hitler interpreted this point to mean that the program was directed against Jewish real estate speculators. In addition, in March 1930 the NSDAP published a detailed agrarian program which promised the peasants not only redress of their present grievances, but also a place of honor within the nation. Accordingly, Werner Angress asks: “Where else could the peasants have gone but to the Nazis?”Footnote 39 This argument is consistent with our finding that while the peasant workers did not support the Nazis very strongly in 1924 and 1928, their support skyrocketed in 1930 and 1932 in Protestant precincts. However, although the Nazis also aimed to provide local relief through various programs, their proposals did not have the same appeal to the domestic and especially peasant workers in the areas of southern and western Germany (which were mostly Catholic).
One problem was that the Nazis favored the reintroduction of a compulsory system of impartible inheritance. They also supported (though not necessarily only as a means of agrigultural policy) plans to resettle the disinherited in eastern Germany (East Elbia). But a law of impartible inheritance did not appeal to southern and western farm families, who could subsist on a small parcel of land thanks to intensive cultivation and higher yields.Footnote 40 Since the typical farming system in the south and west surrounded the town or village, farm families often had members employed in nonfarming trades too, which allowed them to make do on small plots. The prospects of relocating to East Elbia were probably not appealing to anybody. But they would have especially put off all domestic workers, peasants, and agricultural laborers in the South and West.
In Catholic regions, domestic workers and the self-employed also had different interests. As far as general economic policies were concerned, the self-employed class did not benefit much from the governmental program.Footnote 41 For example, they did not benefit from the higher unemployment compensation for workers and new governmental subsidies and preferential tariffs for grain growers at the expense of livestock farmers.Footnote 42 By contrast, there is some evidence that in terms of votes of domestic workers, the Zentrum (and, in Bavaria, the BVP) benefited from social welfare programs at the local level. These programs, embedded in an extensive network of social and political organizations, were also closely linked with the Catholic Church.Footnote 43 The Zentrum in turn provided aid to parochial schools.Footnote 44 Günter Plum, for example, argues that especially for peasants, participation in organizations cosponsored by the church was at least partially motivated by material interests.Footnote 45 Given the power of the church in influencing vote decisions (see below), we would expect the Catholic peasants and domestic voters to have given less support to the Nazis. And while all local welfare programs, throughout Germany, are likely to have been cash strapped, the situation in Catholic regions appears to have been somewhat less dramatic because of these long-standing links. To the extent that similar support does not appear to have been available to the self-employed, domestic workers and the self-employed are likely to have voted differently.
The Catholic Church supported the Zentrum and its related parties in other ways as well, adding to the incentives for voters to favor the Catholic parties in Catholic regions.Footnote 46 First, there was a personal link. To give just two examples, Johann Leicht, longtime chairman of the BVP Reichstag delegation, was a clergyman. Heinreich Brauns, a priest, served as minister of labor from 1920–1928. Second, the Catholic Church strongly encouraged voters not to vote for the Nazis.Footnote 47 Conversely, at least some in the Nazi party described the Catholic Church as alien (artfremd). The DNVP, DDP, and DVP, competing for the Protestant vote, did not have a similar force on their side, leading us to predict that the domestic workers, who were arguably more influenced by the clergy than the business oriented self-employed, should vote differently in Protestant and Catholic precincts. One might, of course, doubt whether voting suggestions by the Catholic parish priest were heeded in the polling booth. It seems at least possible, though, that in small villages, voting may not have been completely secret. While we have not been able to unearth sources that speak directly to this issue, it is true even today that in small villages word spreads fast when somebody deviates from what is expected.Footnote 48
In sum, we predict that the working poor were drawn towards the Nazis in general, but that domestic and peasant workers in Catholic precincts would favor the Zentrum and related parties for two reasons: the Nazi agricultural policy did not appeal to peasant workers in Catholic precincts; and domestic workers in Catholic regions benefited from government programs (while the self-employed did not). In addition, the self-employed would not be as heavily influenced by the Catholic Church because the benefits from Nazi policy in favor of small business were just too tempting.
That the Catholic-Protestant dimension is an important explanatory factor in voting in the Weimar Republic is, of course, neither new nor surprising. What this article adds to the existing literature is the notion that within those groups more open to additional economic incentives, namely, the Protestants, the working poor were those with the greatest incentives to vote for the Nazis. The economic incentives for the working poor to favor the Nazis were certainly in Catholic precincts, but they had a harder time overcoming the incentives provided by the Catholic Church and the Zentrum.
Finally, we note that the complicated effect of job and inflation insecurity on German voters is consistent with or at least relevant to experiences elsewhere. For example, Sidney Verba and Kay Lehman Schlozman study why American politics was not similarly radicalized in the Depression.Footnote 49 Since at least Paul Eisenberg and Philip Lazarsfeld, the profound effects have been well known.Footnote 50 Verba and Schlozman show that the American dream of rugged individualism and optimism about the future seemed to substitute for greater radicalism. In contrast, Roger Myerson tracks the different experiences of the United States and Germany to institutional deficiencies of the Weimar constitution.Footnote 51 In Germany, we find that the unemployed chose the Communists over the Nazis as their radical party for fairly instrumental reasons. Analogously, Anthony Mughan and Dean Lacy demonstrate that job insecurity (as distinct from short-term economic performance and macro-levels of unemployment) was a major determinant of the vote for Perot in the 1996 U.S. presidential election, since neither major party candidate had much to offer for people concerned about this issue.Footnote 52 The working poor in the Weimar Republic may have experienced a similar, or more urgently desperate, concern.
The two simple organizing principles we propose—incentives of the working poor throughout Germany and incentives in favor of the Zentrum, especially in Catholic areas—of course cannot explain all of the enormous complexity of voting in the Weimar Republic. For example, as we do not have a model of how voters analyzed the party environment strategically, we cannot test a tactical or strategic voting theory. Although this probably was important in the 1920s, this omission is less of a concern in later years. The small, single issue parties diminished in importance starting with Brüning's increasing use of presidential decrees from October 1930. While in the Reichstag elections up to 1930, the small parties taken together received vote shares on the order of 10 percent of the eligible votes, their share dropped to 2 percent in the elections of 1932 and 1933. Other strategic voting aspects, for example, the notion that voters vote for an outlandish party simply to shock a government they expect to survive (in the spirit of the “protest” aspect of Thomas Childers' thesis), may also be important. To the extent these motivations are important, the empirical picture we obtain by testing the economic voting perspective is necessarily going to be blurred.
Our results contrast with the popular, though recently not empirically supported suggestion that the main class basis of Nazi support came from blue-collar workers and the unemployed. It is also distinct from Hamilton's idea of the upper-class white collar and self-employed being the core supporters of the Nazis. And through its focus on disproportionate support, it is different from the catchall party view which marks the main conclusion of Childers' and Falter's sophisticated analysis. Each of these previous approaches is correct to a degree, and each adds considerably even if one takes our view as accurate, since the swing to the Nazis affected all the groups. But as we show below the groups which responded disproportionately in favor of the Nazis were those we call the working poor, and those who reacted disproportionately against the Nazis were the unemployed. Finally, our strategy of inquiry and our results follow but remain distinct from Brustein's, whose work on Nazi party membership is based on a somewhat different organization of classes and demographic groupings.
DATA
To address the questions that motivate this article, we put together an extensive set of aggregate election data on Weimar Germany, covering Reichstag elections from December 1924 to March 1933 (the March 1933 election is typically not viewed as free or fair, but its analysis is nonetheless interesting). We do not consider presidential or state elections; our study shares this limitation with most of the existing work. We begin with the electoral data from Dirk Hänisch and Falter and add (occupational) data from the 1933 German Census.Footnote 53 We first aggregated the units into 1,248 official electoral districts. Because the boundaries of some districts changed over time, we ensured logical consistency by aggregating some of the districts and producing 681 contiguous units (which we refer to as “precincts” or Kreise) whose boundaries were relatively stable over time. These precincts tile the country (except for one small area in Prussia due to the absence of data, and French-occupied Saarland). We aggregated the data by hand, comparing two detailed contemporary paper maps with electronic boundary files prepared by Colin Flint, and by studying population changes over time.Footnote 54 We have made these data, and all information necessary to reproduce our empirical results, publicly available on the Dataverse Network.Footnote 55
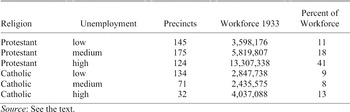
To conduct our empirical analysis, we begin by dividing the country into six regions of the 681 precincts defined by the cross-classification of the level of unemployment and religion (or “confession,” as it is called in the Nazi voting literature), both of which strongly correlate with Nazi voter support. Unemployment is grouped into three categories: low (<10 percent), middle (10–20 percent), and high (>20 percent) areas. We considered two religious groups: Protestant (>50 percent) versus Catholic and others, using data from the 1925 Census. The six resulting regions correspond to some of the major, and easily measurable, differences between different geographic areas in Germany. We apply our estimation method within each of our six regions separately. That greatly reduces homogeneity assumptions (although it obviously does not eliminate them), improves our estimates, and lets us learn more about variation across the regions. Creating more regions might reduce the homogeneity assumptions further but would probably increase the variance of the resulting estimates. Clearly, much further research could be profitably conducted into optimal grouping schemes.
SIX REGIONS BASED ON RELIGION AND UNEMPLOYMENT

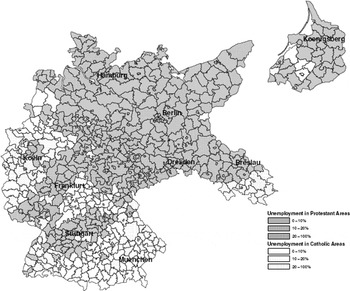
The map in Figure 1 portrays our regions and shows the extensive spatial clustering that our six-part grouping takes into account. The Protestant areas (shaded) lie mostly in the Northeast, and the Catholic regions in the Southwest. Through the entire country, the areas of highest unemployment are the cities, the largest of which have been labelled. (The region in the middle of the country with high unemploy ment was also urban but with cities of smaller sizes.)
Table 1 summarizes the sizes of each of these six regions in different ways. The data include two additional sets of observed variables for each of the 681 precincts. First are election results for each political party in each precinct. Because many parties stood for office in the elections we are interested in, we group them based on ideology. Our categories include the Far Left (KPD, the Communist Party); the parties in the Left and Center, including primarily the Left (SPD, the Social Democrats) and the Catholic and Center parties (Zentrum and BVP, Bayerische Volkspartei); the Far Right (DNVP, Deutschnationale Volkspartei); the Liberals (DDP, Deutsche Demokratische Partei (later DStP, Deutsche Staatspartei) and DVP, Deutsche Volkspartei); and the Nazi Party (NSDAP, Nationalsozialistische Deutsche Arbeiterpartei). We grouped several parties that were small enough to not materially affect the results together with nonvoters.Footnote 56 This categorization is finer grained than the vast majority of empirical analyses in the literature, but it of course still reflects compromises that result from aggregating some parties into larger groups that make statistical analyses feasible. For example, since our primary interest is to study voting for the Nazis, future research could use the same method to understand in more detail how the Germans voted for the Zentrum and the SPD separately.
SIZE OF OUR SIX REGIONS

Source:
See the text.
Before the start of serious economic difficulties, the SPD and Zentrum had steady support from the voters, while the Liberals and the Far Right were losing votes even then. However, after the economy began to nosedive, the two center parties quickly lost support, and previous nonvoters turned out for the Nazis. In November 1932 the picture inverts briefly, but the trend towards the Nazis continued in March 1933.
The second set of observed variables includes five occupational groups coded from the 1933 German Census, focusing on voters in the (potential) workforce.Footnote 57 These include the self-employed (Selbständige, i.e., independent artisans, shopkeepers, small farmers, and a smaller group of industrial employers that we cannot separate out), blue-collar workers, white-collar workers (about 31 percent Beamte and about 69 percent Angestellte), domestic employees and helping family members, and the unemployed.Footnote 58 Of the unemployed, more than 97 percent are unemployed white-collar or blue-collar workers, whereas the rest belong to the domestic group. An important dividing line is that between small shopkeepers (in the self-employed group) and industrial workers and managers (in the white-collar group). In previous studies, the self-employed and domestic employees have often been lumped together into one group. As discussed above, our functional grouping allows us more meaningful tests of our theory than purely class-based categorization schemes. We also included data on religion from the 1925 Census. We would have preferred to include data on occupation and religion collected at the time of each election, or interpolated from more than one census, but we were unable to locate any better data.
THE ECOLOGICAL INFERENCE PROBLEM AT THE NATIONAL LEVEL, JULY 1932

Source:
See the text.
METHODS
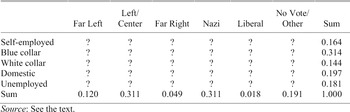
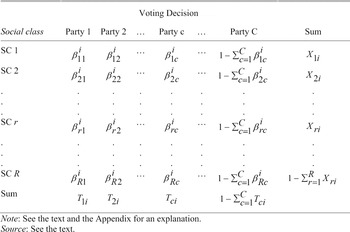
Within each of the six regions of precincts defined by unemployment and religion, the key substantive issue is filling in the cells in a cross-classification like that in Table 2. The rightmost column of the table gives the proportion of people in each occupational group, whereas the last row indicates the proportions of individuals who cast their ballots for each of our political party groupings.
While the margins of this table are observed, and the margins of analogous tables like it are observed for each precinct, the cells in the table (denoted by question marks) are not known and must be estimated. Indeed, the goal of the Nazi voting literature and this article is to fill in numbers for the question marks—for example, what fraction of self-employed people voted for the Nazis. The reason for the lack of knowledge is that Weimar Germany had a secret ballot and so which people or type of people voted for each party was not recorded or reported. The two sources of data, census and electoral, cannot be linked at the individual level. The task of filling in a table from information about its margins is known as ecological inference.
An alternative way of looking at the problem is to study patterns only in the observed variables (the spatial variation in the margins across the tables for each precinct) and to make no ecological inferences. This approach dates at least to Rudolf Heberle, James Pollock, and Charles Loomis and J. Allan Beegle and has newer adherents.Footnote 59 It also encompasses a great deal of qualitative work on how the NSDAP took advantage of regional-national tensions by centralizing their propaganda activities while remaining sensitive to local and regional diversity produced by centuries of cultural and historical legacies, for example, in Lower Saxony and in the city of Marburg.Footnote 60 Although we find this type of spatial research to be informative for many questions, our interest in which individuals voted for the Nazis requires ecological inferences, and hence different methods.
Two sources of ecological information in the marginals have been used to make inferences about the cell entries—deterministic and statistical. For example, Hamilton used deterministic information when he examined about two dozen areas that gave homogeneous voting support to the Nazis, since we know for certain that whoever voted in those areas supported the Nazis.Footnote 61 His procedure, which was to examine the housing stock in each area, tells us essentially without error (other than errors in using housing stock to infer class status) who where the Nazi supporters. The problem with this approach is that it only applies to the homogeneous areas. As it turns out, however, deterministic information is available for every area. So, for example, if in one precinct 635 people voted for the Nazis, and 247 people were domestic employees, then we know for certain that the number of domestic employees in this area voting for the Nazis was between 0 and 247. Converting the quantity of interest to the proportion of domestic employees voting for the Nazis will give upper and lower proportions that are directly calculable in any precinct.
The advantage of deterministic information is that it is known for certain, conditional only on the data being correct. The disadvantage is that the bounds are sometimes too wide to provide much information. In fact, Hamilton effectively discarded all Kreise where the bounds were not of width zero. This meant that the conclusions he drew about a few areas were highly informative, but it also means, if these areas differ from the rest of Germany, that his results may reflect selection bias of almost any direction or magnitude. Of course, Hamilton was aware of this, and could not be expected to put as much work into all of the rest of Germany as he did in these two dozen areas, but of course it severely limits the degree to which his results can be generalized. Indeed, it appears that Kreis-level data from all of Germany were not used until about 1980.Footnote 62 In our case, we are working from nationwide quantitative information, and so we avoid the selection bias by using all available deterministic information from all precincts in the entire country.
The second source of information in the marginals is statistical. For example, Childers correlated the fraction of blue-collar workers in an area with the fraction voting for the Nazis.Footnote 63 He found that areas with many blue-collar workers were also areas that gave many votes to the Nazis and thus concluded that the blue collar were Nazi supporters. This is of course possible, but it could also be completely wrong. It could in fact be the white-collar workers or others who happen to live in areas with many blue-collar workers who are voting for the Nazis. If so, a correlation at the aggregate level could have nothing to do with individual level behavior—which is the definition of what is called the ecological fallacy. Of course, the statistics do contain some information, and can be helpful when used carefully.
The only method used to extract deterministic information from aggregate data in the entire Nazi voting literature was introduced half a century ago by Otis Duncan and Beverly Davis.Footnote 64 In fact, the only method regularly used in this literature to extract statistical information dates to the same year.Footnote 65 The same venerable methods also dominated other fields that made ecological inferences until Gary King showed how to combine both sources of information in the same model.Footnote 66 A variety of other methods have subsequently been proposed that also combine both sources of information.Footnote 67 But few apply to tables as large as in Table 2 and none are used much in applications. As such, we developed new techniques to study voting in Weimar Germany that extend this approach combining deterministic and statistical information in a way that works for arbitrarily large tables. We published details of these models elsewhere, and the methodology, although designed specifically for the problem in this article, has already been adopted by others for different applications.Footnote 68
As in King's work, the key to our approach is to limit the sample space to the deterministic bounds for the quantities of interest in each precinct, and then to use a statistical model to attempt to extract information only within the bounds. Limiting modelling to the sample space is not a novel idea, but it is relatively new to this problem because of the difficulties posed by the fact that the bounds vary considerably over the observations. However, the variation in the constraints means that they can be quite informative for some observations in and of themselves and collectively in improving the statistical inferences within the bounds. The Appendix gives the specific details of our model.Footnote 69
Much individual-level information is lost in the process of aggregation, and no method can recover it with certainty in all situations. How well this information can be reconstructed depends on how much deterministic information is available, and on the existence of external information. Determining the causes of Nazi voting is a particularly difficult application because the deterministic approach is very informative in only some precincts, and also because of the size of the table, which requires one to estimate a large number of unknowns on the basis of relatively few known numbers. (For example, for our tables with 5 rows and 6 columns, we observe 5 + 6 = 11 quantities but need to estimate 5 × 6 = 30 quantities, twenty-four of which are independent. Making this inference is obviously impossible without some assumptions.) If a researcher had a choice, it would be better to pick an application with more deterministic information and smaller tables (reliable individual level survey data would even be better!), but the importance of the enduring question compels us to attempt to draw out every last bit of information about these incredible events. Because of the difficulty of making inferences in this setting, we cannot offer any definitive answers to the question of who voted for the Nazis, but because our method combines all sources of information (something no previous analysis has done), our procedure has a chance of doing better than earlier analyses. But, of course, the nature of this statistical inference is such that one can never be certain of such properties in any one particular application.Footnote 70
EMPIRICAL RESULTS
We begin by creating thirty groups from the cross-classification of our five social groups—self-employed, domestic, blue collar, white collar, and unemployed—with our six geographic regions—defined by low, medium, and high unemployment areas and Protestant and Catholic confessional areas. Figure 2 gives the number of people in each. The length of the bar next to each group is proportional to the number of people in it. For the presentation, to organize these groups and provide some focus to our analysis, we hone in on only the fifteen largest groups. Making ecological inferences about the fifteen smaller groups is significantly more difficult (because of wider bounds and less statistical information) and in part because of this larger uncertainty, we find few patterns that significantly distinguish any of the smaller groups from the baseline nationwide swings. Fortunately, the groups that are the subject of our theoretical arguments are well represented among the fifteen largest groups.Footnote 71
Figure 2 also classifies the fifteen largest groups into the Working Poor, the Unemployed, and the Blue- and White-Collar Workers. This classification organizes our presentation in the rest of this section, but to avoid any selection or additional grouping biases, the statistical analyses on which these results are based include the full set of all thirty groups, representing all of Germany. The two groups most negatively affected by the disastrous economic situation include the working poor and the unemployed. The remaining groups represent blue- and white-collar workers.
If our argument above is correct, we should see strong support for the Nazis over and above national swings from the working poor groups, whereas most support from the unemployed should go to the Communists. The divergent voting results from these two groups—both gravely hurt by the economic depression—constitute the key test that should distinguish our theory from those that have come before. The pattern should be present in both Protestant and Catholic areas for the self-employed, while for the domestic workers and helping family members, we expect the powerful incentives the Catholic Church offered on behalf of the Zentrum party to be at least a counterweight against the Nazi appeal. Our explanation also predicts no consistent trend in support for the Nazis from the white- and blue-collar workers, which directly contradicts several versions of class theory. Finally, we also expect to find the collapse of the right wing parties as well as the liberal parties in part traceable to the withdrawal of support from the working poor.
GROUP SIZES

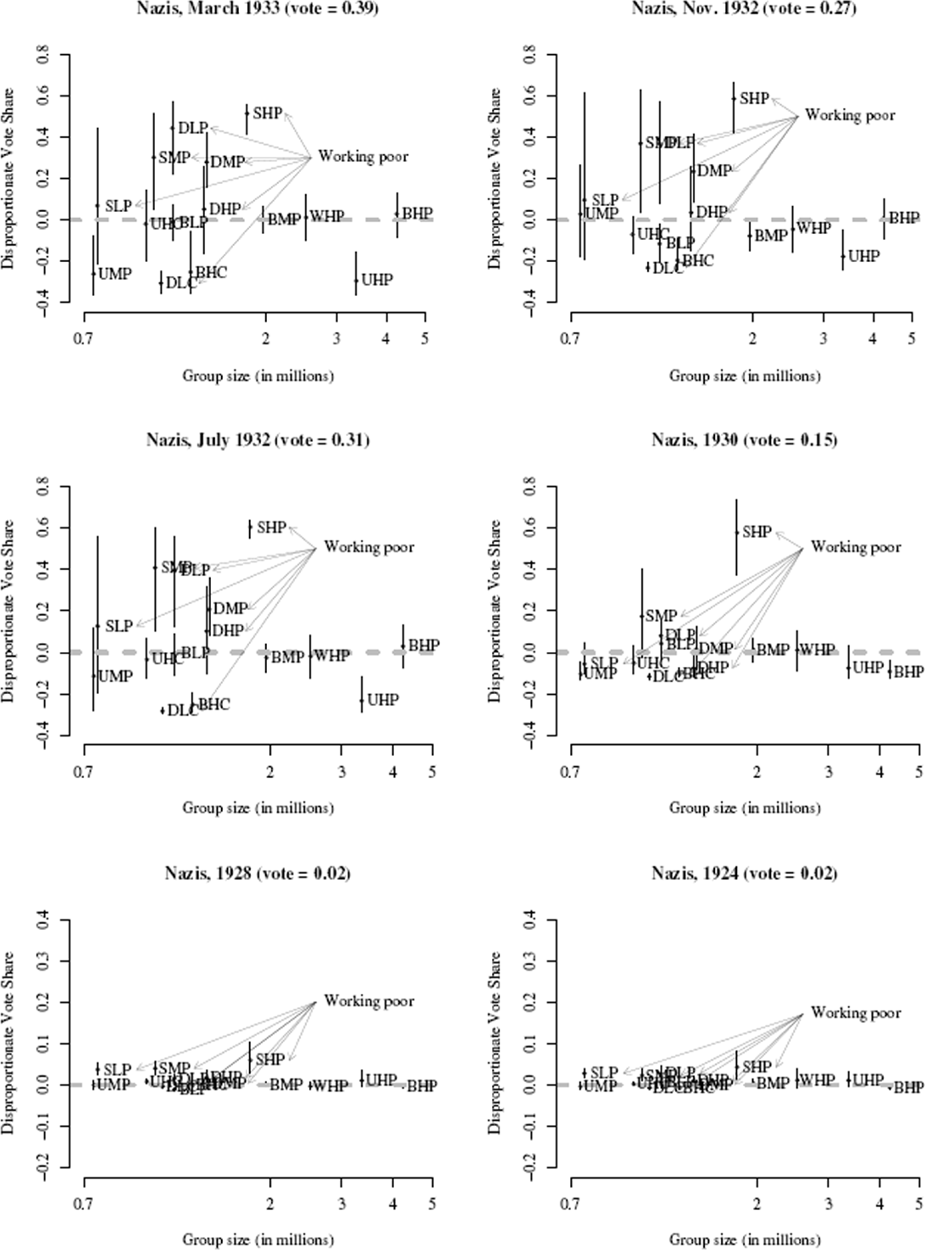
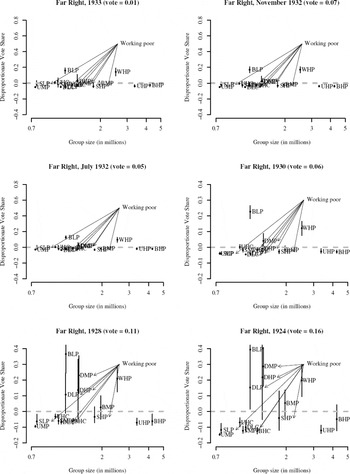
We present our main results in six logically parallel figures. The first, Figure 3, portrays all six elections that we study: March 1933 (top left), November 1932 (top right), July 1932 (middle left), 1930 (middle right), 1928 (bottom left), and December 1924 (bottom right). The format of each is the same, plotting the vote share over and above national level of support for a group on the vertical axis by the group size on the horizontal axis. (Note that the vertical axis for the bottom two graphs differs from the top two.) To understand how to read the graph, consider the interpretation of, say, the position of the group of self-employed people from areas with high unemployment and predominantly Protestants (marked SHP) in 1930. The value 0.6 on the vertical axis (at the approximate center of the SHP line representing a 90 percent confidence interval) means we estimate that 75 percent (0.60 + 0.15 swing or 75 percent) of this group gave its vote to the Nazis, which of course is 60 percentage points more than proportionate once we account for the 15 percent swing in 1930. Since the numbers are measured relative to their nationwide swing, the same 0.6 in the graph for 1932 would mean that the group gave 91 percent (0.6 + 0.31 swing in 1932, or 91 percent) of the vote to the Nazis.Footnote 72
Consider now the July 1932 election plot, which presents results for each of the top fifteen groups plotted by their size (horizontally, denominated in millions, but on the log scale for graphic clarity) by how much we estimated that each group voted for the Nazis in the election over and above the proportion of votes in the population the Nazis received. Each group is represented by a dot, which gives the method's point estimate of the fraction of the vote for the Nazis over and above the national swing, and a 90 percent confidence interval, represented by a vertical bar. Consider, for example, blue-collar workers from areas that are low in unemployment and predominantly Protestant (marked BLP). The dot for this group is nearly on the horizontal dashed line at zero (and the confidence interval bar overlaps it), which indicates that it gave to the Nazis almost the same fraction as the entire country in this election (i.e., 31.1 percent).
VOTE FOR THE NAZIS
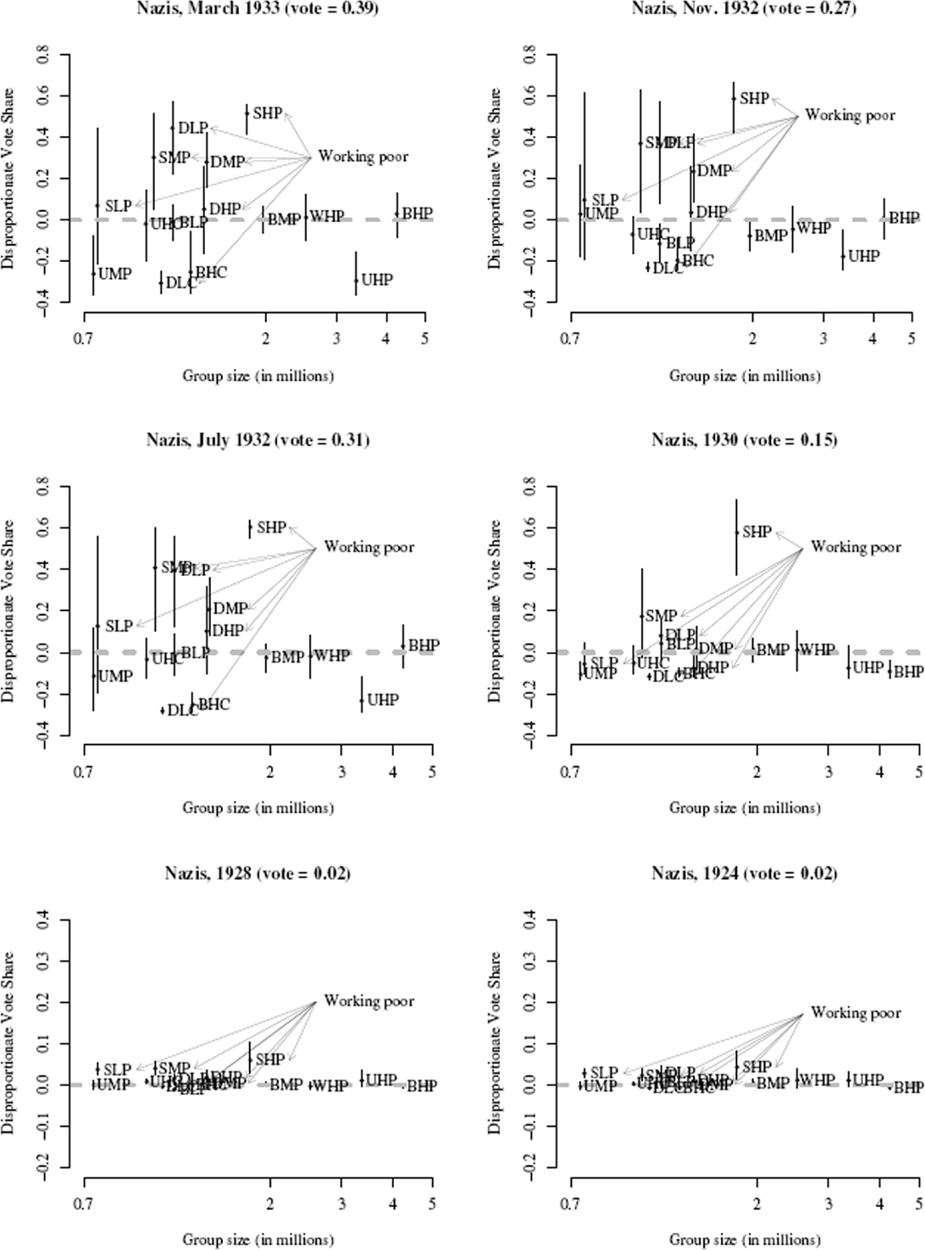
The July 1932, November 1932, and March 1933 graphs in Figure 3 strongly support our main argument. In particular, the working poor groups in the Protestant precincts all give the Nazis disproportionate support, with the self-employed providing exceptionally strong support in most Catholic and Protestant precincts: at slightly more than 60 percentage points more than the national swing, our model estimates that the self-employed (from areas with high unemployment and that are predominantly Protestant) give all but a few percent to the Nazis. The other domestic workers, who make up the working poor groups, also give the Nazis strong disproportionate support, although with more variability among themselves. The figures also reveal the disproportionately low support the Nazis received from the unemployed, compared to the national swing (as can be seen by the UHP dot appearing below the dashed horizontal line).
The set of graphs in Figure 3 also reveal the pattern over time by which the result in 1933 eventually unfolded. Each of the six graphs displays each group's support relative to the national swing for that year. Across the years, the parties taken together are moving quite dramatically over the six elections, with an average swing (indicated in the graph subtitles) ranging from 2.3 percent in 1924 to 38.7 percent in 1933. However, many groups stay on the horizontal line, the point equal to the national swing, which as we pointed out is consistent with the vast majority of other elections in the history of representative democracies. Again, we emphasize that the underlying statistical analysis in all figures is based on calculations including all thirty groups. (Most of the fifteen smaller groups would also appear on or near the line if we had included them in the figures.)
The key divergent pattern in these figures—the main pattern that makes the Weimar elections different from others—is the decline in support for the Nazi party among the unemployed and the rise in support among the working poor. Although hints of both can be seen even in 1924, the change across the six graphs is dramatic, relative to other elections and other parties within these elections. Other groups in the Protestant precincts, in particular the blue-collar workers (BLP, BMP, and BHP) and the white collar workers (WLP, WMP, and WHP) did not vote more than proportionately for the Nazis, indicating that the religious affiliation of a precinct alone did not explain the vote.
Conversely, the working poor's vote is also, in some cases, moderated or caused by incentives relevant only in Catholic areas. That is, our analysis also provides strong support for the idea that the Zentrum wielded substantial economic local and regional power through its links with the Catholic Church. Of the six working poor groups in the Protestant areas (SHP, SMP, and SLP; DHP, DMP, and DLP), none voted less than proportionately for the Nazis. By contrast, domestic workers in low and medium unemployment areas in Catholic precincts (DLC and DMC) voted less for the Nazis than the national swing. We regard this as consistent with the theory developed above. The self-employed voted for the Nazis to a disproportionate extent even in Catholic precincts. The one surprising result we obtain is that self-employed in Catholic and high unemployment precincts voted very strongly for the SPD and the Zentrum. We have not been able to determine with any certainty why this occurs. It may be disconfirming evidence of our theory or perhaps instead is due to limitations of our methodology for estimating the large number of parameters required in small samples. We highlight this result as a limitation to our analysis and call for the collection of other types of data to try to ascertain its causes.
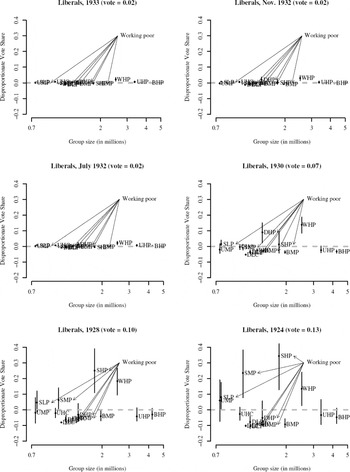
By definition, when the Nazis receive additional support, some other party must lose support. We now try to sort out which party lost votes among each population group.Footnote 73 The Far Right lost 15 percent of the vote over the six elections, and the Liberals lost 10 percent. Figures 4 and 5 show how these results arose. In 1924 the far right DNVP (which was in the government in the early part of the period we study) received highly disproportionate support from the three domestic groups among the working poor. Interestingly, even though the DNVP was not in the government in the grand coalition (1928–1930) and even became resolutely oppositional later on, the party continued to be identified with big agriculture.Footnote 74 Consequently, by July 1932, support from the domestic groups for the Far Right had collapsed, well beyond what happened to the party nationally. (Again, note that the movement of the domestic groups relative to the nationwide swing implies that they moved from 45 percent support for the Far Right to only 5 percent.)
VOTE FOR THE DNVP

VOTE FOR THE LIBERAL PARTIES

While the Nazis attracted part of the working poor from the DNVP, namely, the domestic group, the other part, the self-employed, switched to the Nazis from the Liberals. We present these results in Figure 5. The economic stature of the Selbständige diminished already in the mid-1920s, and with the onset of the Great Depression, the position of small businessmen deteriorated rapidly. Consequently, Figure 5 is quite similar to the pictures for the Far Right, with the difference that here it is the self-employed who started as core supporters of the Liberals, and switched to the Nazis over time.
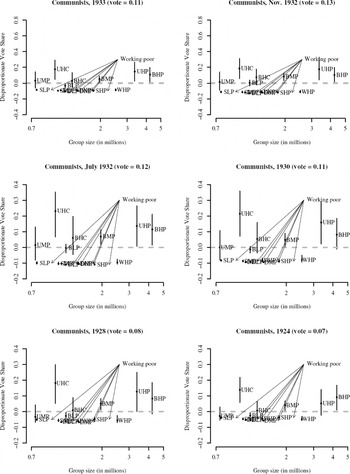
We present the results for the Communist Party, and the other small parties on the Far Left, in Figure 6. Most of the results here are also consistent with our argument. The July 1932 election witnessed a swing to the Far Left of 5 percentage points (from 1924). Most of the pickup was from blue-collar workers (most of who were at serious risk of unemployment) and the unemployed. It was especially the unemployed in Catholic precincts who voted for the Communists, while the unemployed in Protestant precincts found a feasible alternative in the SPD.
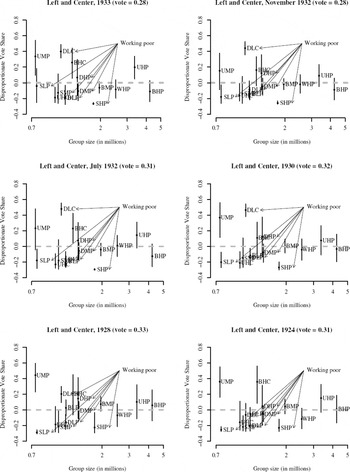
Figure 7 is a graph of the support of groups for the Left and Center. Overall, recall that the SPD and Zentrum only lost about 3 percentage points between 1924 and 1933, but we can still see some clear patterns. Consistent with the notion that the Catholic Church was successful in mobilizing voters to remain loyal to the Zentrum, while the SPD had no similarly powerful protectorate in the Protestant precincts, our results indicate that the only working poor group voting more than proportionately for the Left and Center was a Catholic group. All other groups are on or below the horizontal line in Figure 7. The Protestant self-employed (marked SLP, SMP, and SHP) never supported the governing parties. The unemployed exhibited an interesting pattern: In the Protestant precincts, where the SPD was relatively stronger than the Zentrum, the unemployed voted also for the SPD, not only for the Communists. Over the years, the Social Democrats and the Zentrum also lost many blue-collar workers. Importantly, the working poor groups in Figure 7 did not change their support for the government disproportionately (or only, in the case of the domestic employees in Catholic low unemployment precincts, in favor of the Zentrum, which is consistent with our theory).
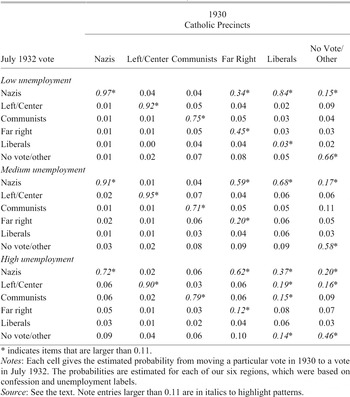
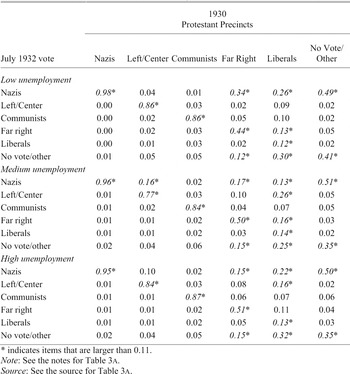
Finally, as a check on our results and to provide an alternative view of the problem, we switch from ecological inference about social groups to voter transitions among the parties in successive elections. We summarize the results for one transition in Tables 3A and 3B, which estimate the fraction of support each party in 1930 gives to each of the parties in July 1932. We present these results for each of the six regions separately. Voter loyalty figures can be read off the diagonal in these tables. Voter loyalty is estimated to be high for most parties, but particularly low for the Far Right and especially high for the Nazis. Off-diagonal elements in these tables reflect different types of defection from parties (or the category of nonvoters and other small parties).
VOTE FOR THE COMMUNISTS

VOTE FOR THE SPD, ZENTRUM, AND BVP (LEFT AND CENTER)

VOTER TRANSITIONS, 1930–JULY 1932

* indicates items that are larger than 0.11.
Notes:
Each cell gives the estimated probability from moving a particular vote in 1930 to a vote in July 1932. The probabilities are estimated for each of our six regions, which were based on confession and unemployment labels.
Source:
See the text. Note entries larger than 0.11 are in italics to highlight patterns.
VOTER TRANSITIONS, 1930–JULY 1932

* indicates items that are larger than 0.11.
Note:
See the notes for Table 3A.
Source:
See the source for Table 3A
For visual clarity, we have highlighted all numbers greater than 0.11. We omit the standard errors to prevent complicated tables from becoming even more complicated, but almost all of these highlighted numbers are at least twice their standard errors and so can be reliably distinguished from zero; almost all others cannot. (This and graphical clarity is how we chose this particular cutoff point.) Thus, for example, we can see where the Nazis in July 1932 received their main support by looking at the italicized entries in the Nazi rows. In addition to holding on to their previous supporters, the Nazis received substantial additional support from previous Far Right supporters. In addition, as a significant fraction of the Nazi support starting in 1930 appear to have from previous nonvoters. Another pattern in the tables is that many Far Right supporters in 1930 sat out the July 1932 election. The tables partially confirm the political confessionalism hypothesis of Burnham as developed by Falter, but not equally strongly on all counts.Footnote 75 For example, the Communists may have gained some votes from the Liberals and the Far Right.
We also analyze (but do not present) voter transitions in the other elections. For the November 1932 vote, we find that the Nazis mostly lost their votes to nonvoters; by contrast, the SPD and Zentrum were able to keep a larger fraction of voters loyal to them between July and November. In March 1933 a quarter of former DNVP voters defected to the Nazis, as did more than 10 percent of Communists in Catholic precincts. Almost all November 1932 Nazi voters again voted for the Nazis, whereas the SPD and Zentrum achieved voter loyalty of less than 90 percent, losing voters to the Nazis especially in both Catholic and Protestant low unemployment precincts.
CONCLUDING REMARKS
In process, but obviously not outcome, the dynamics of the Weimar Republic's electoral swing between 1924 and 1933 to Hitler and the Nazi Party parallel that of almost every other swing in the history of democratic elections. The national swing to the Nazis fits a standard retrospective voting explanation, explaining a retreat from the established parties and a shift to ever more extreme opposition parties resulting from the disastrous economic conditions (in addition to ideological shifts towards nationalism and anti-Semitism). Our results indicate that the majority of social groups swung in the same direction and approximately the same amount. In addition, just like other elections, the support each group gave to the Nazis in 1924 did not predict how far a group would move in the next election. But importantly, we were also able to identify the groups that moved disproportionately and distinctively compared to the national swing baseline, thus invalidating the notion that the Nazis were a catchall party.
Of the two groups most hurt by the economic depression, we find that the working poor—self-employed shopkeepers and professionals, domestic workers, and helping family members—were the main group that wound up moving to support the Nazis. In Catholic precincts, domestic workers remained loyal to the SPD and especially the Zentrum, consistent with the multifaceted incentives encouraging them to do so—in particular, Nazi policies on agriculture unattractive for people living in the South and the West, welfare programs embedded in a network of social and political organizations with close ties to the Zentrum, and the power of incentives emanating from the Catholic Church. The other group fatally hurt was the unemployed, which wound up supporting the Communists (though some Protestant unemployed voted for the SPD). This finding is consistent with current understandings of the incentives of these voters. Further hypotheses on economic voting can, of course, be developed and tested. For example, one interesting future research question is whether the population of export-dependent areas voted less (controlling for religious affiliation) for the Nazis (who strongly embraced autarky) than did the population of areas with fewer exports.
Our results become especially clear when we look at the election through the eyes of the economic voting behavior literature. In particular, we remove the patterns that occur in every country and look primarily at the disproportionate support individual groups provide over and above the nationwide swing to the Nazi party. It may still be hard to fathom how democratic elections led to such a horrific outcome but, when looked at in a comparative perspective, the process by which this outcome occurred becomes amenable to relatively standard political science explanations. Methodologically, whereas few works in the existing literature have used any statistical method invented in the last fifty years, this article adapts a method of ecological inference designed especially for this problem. Unlike existing approaches used in this literature, this approach uses all available deterministic information and existing statistical information together in the same model. Because it uses more information, the results should be more reliable. Of course, considerable information is lost in making ecological inferences to 5 × 6 tables, and nothing we can do now will resurrect this information with certainty. Certainly public opinion polls of survivors would not yield any useful information, and no other source of election data exists. As such, any method of ecological inference applied to this problem will produce results with many uncertainties, which of course leaves much work for future generations of scholars to pursue, and much we will never know.
Finally, some may find it satisfying from a scientific perspective that we are apparently able to demonstrate that the elections that put Adolf Hitler in power are subject to the same ordinary voting behavior explanations as are most other democratic elections worldwide. However, it seems worth asking about the implications of this result for avoiding a similarly horrible and extreme outcome in a modern democracy. For decades following World War II, the main lesson philosophers, commentators, and social scientists took from these elections was that democracy should be limited in some way so that the impressionable masses might be protected from demagogues. In recent years, dominant opinion seems to have switched back to preferring democracy and freedom to be maximized. In contrast, the empirical results offered here may suggest that focus should be on the output, not the input. That is, if we are interested in the likely reactions of voters and parties, we may want to focus more on governmental successes and failures in choosing and implementing public policies than on the degree of intellectual versus demagogic appeals of the candidates.
Appendix: Penalized Nonlinear Least-Squares Estimation
Appendix Table 4 introduces the notation required for describing the technical details of our methodology.
For precinct (Kreis) i (i = 1,…,p), we observe the fractions of voting-age people who turn out to vote for specific parties  and the fractions of voting-age people in different social classes
 . The unobserved quantities
 are the fractions of people in social class r, who vote for party c.
Let  be the numbers of voting-age people who turn out to vote for the different parties. We assume that
 follows a multinomial distribution with parameter vector
 and count N i where θci equals
 for
 under the constraint that
 . We assume further that the mean of
 is given by
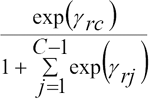
for  and i = 1,…,p.
For each table i = 1,…,p, define  , for c = 1,…,C, and
 (subject to
 for each r). Define also
 (with the constraint
 . It follows that
 is multinomial
 where

NOTATION FOR THE iTH R X C TABLE

Note:
See the text and the Appendix for an explanation.
Source:
See the text.
It is easily shown that

for c = 1,…,C–1 and i = 1,…,p. The  are mean functions, and
 is given in (1).
The penalized nonlinear least-squares approach consists of solving

to obtain the estimate of γ. The second term is a penalty where λ is a fixed constant. The minimization (2) is solved numerically. To obtain standard errors of the parameter estimates, we use bootstrapping, based on B (typically 200) sets of p tables. These sets are obtained by sampling with replacement B pairs  from the observed data, where
 and
 .Footnote 76