


1. Introduction
China is in a war against air pollution (Greenstone and Schwarz, Reference Greenstone and Schwarz2018). Among all the regions, northern China suffers the most from air pollution, especially around the Beijing–Tianjin–Hebei urban agglomeration (Wu et al., Reference Wu, Xu and Zhang2015). Air pollution has been found to harm cognitive performance (e.g., Lavy et al., Reference Lavy, Ebenstein and Roth2014; Ebenstein et al., Reference Ebenstein, Lavy and Roth2016; Bharadwaj et al., Reference Bharadwaj, Gibson, Zivin and Neilson2017; Zhang et al., Reference Zhang, Chen and Zhang2018) and cause excess mortality rate among vulnerable people (e.g., Mead and Brajer, Reference Mead and Brajer2005; He et al., Reference He, Fan and Zhou2016; Ebenstein et al., Reference Ebenstein, Fan, Greenstone, He and Zhou2017; Fan et al., Reference Fan, He and Zhou2020). Specifically, Ebenstein et al. (Reference Ebenstein, Fan, Greenstone, He and Zhou2017), Fan et al. (Reference Fan, He and Zhou2020) and Li (Reference Li2023) all point to the air pollution caused by coal-powered concentrated heating in northern China. Thus, considering replacing coal with cleaner energy, such as natural gas, is expected to significantly improve the air quality in winter in these areas. Besides alleviating air pollution, reducing carbon emissions is another reason for choosing natural gas instead of coal, as China has promised to peak carbon dioxide emissions by 2030 and to achieve carbon neutrality by 2060 (State Council, 2025). Even though methane can cause more damage regarding carbon emissions, the transition from coal to natural gas is still beneficial in terms of the carbon target (Tanaka et al., Reference Tanaka, Cavalett, Collins and Cherubini2019).
Considering the detrimental health consequences of air pollution and the concern about carbon emissions, this paper evaluates whether the ‘coal-to-gas’ (CTG) policy improved the air quality across China in both the treated and untreated regions. This is an important empirical question in environmental policy because the effect of this policy and its welfare impact are highly controversial and contentious topics in China. Wang et al. (Reference Wang, Su, Chen, Tao, Streets, Lu, Zheng, Carmichael, Lelieveld, Pöschl and Cheng2020a) document that the air pollution in northern China (where the regulated cities are located) improved, but there is an upsurge in air pollution in southern China, which is not regulated by this policy. They argue that this is because the rise in demand in northern China raises the price of natural gas, which makes people in southern China switch to coal for heating. This general equilibrium effect is neglected in the policy-making process. On the contrary, Zeng et al. (Reference Zeng, Bao and McFarland2022) show that the air quality in northern China is unchanged, while the air quality improved in southern China. Moreover, unintended consequences such as a sudden interruption of heating in the winter and social discontent in rural areas are observed (Shi et al., Reference Shi, Sun and Shen2021; Cao et al., Reference Cao, Liu, Ma and Sun2025). Wu et al. (Reference Wu, Xie and Liu2023) point out that this policy is at risk of failure in the long run and may face cost-benefit challenges. This dispute in the literature motivates this study.
To evaluate the effectiveness of this policy, we use the 2017 CTG policy as a quasi-natural experiment. The synthetic difference-in-differences (SDID) method (Arkhangelsky et al., Reference Arkhangelsky, Athey, Hirshberg, Imbens and Wager2021) is used to evaluate the effect of this policy on air pollution (measured by PM10) in the treated ‘2+26’ cities.Footnote 1 The difference-in-differences (DID) design is also used as a robustness check. Furthermore, we highlight four spillover effects that this policy may have on areas outside the treated cities. These spillover effects include the geographical spillover effect, policy diffusion (Gilardi et al., Reference Gilardi, Shipan and Wüest2021), pollution relocation (Fang et al., Reference Fang, Chen, Hubacek, Ni, Chen, Feng and Lin2019) and the general equilibrium effect through the price mechanism (price spillover). In order to quantify the net effect of these unintended spillover effects, we also conduct a similar process for four central provinces that are not directed by the CTG policy, using a control group that is naturally minimally impacted by the policy due to their geographic location. The results show that the policy leads to a 14.161  $\unicode{x03BC}$g/m
 $^3$ decrease in PM10 in the treated area and a 5.985
 $\unicode{x03BC}$g/m
 $^3$ decrease in the untreated area. This result suggests that the combined effect of geographical spillover and policy diffusion outweighs the sum of price spillover and pollution relocation effect. Using the estimated willingness to pay for cleaner air from Ito and Zhang (Reference Ito and Zhang2020), this amounts to approximately $7.9 and $3.3 gains per household in the treated and untreated cities each heating season, respectively.
We then investigate the spatial distribution pattern of the treatment effect in treated cities and the spillover effect of the treatment in untreated cities. Previous studies have revealed that air pollution is not spatially evenly distributed in China, with poor counties bearing disproportional pollution (e.g., Papineau et al., Reference Papineau, Aunan and Berntsen2009). For treated cities, we find that cities closer to Beijing tend to have a higher treatment effect (i.e., larger reduction in air pollution). This might be correlated with one of the goals of the CTG policy, which is improving the air quality in Beijing. This hypothesis is tested with environmental administrative penalty records. For untreated cities, we find that the net effect and the average winter temperature exhibit a U-shaped relationship. In places with the lowest average winter temperature, the treatment effect is positive (air pollution increases). This phenomenon reflects the comparative magnitude of the combined effect of geographical spillover and policy diffusion versus the sum of the price spillover effect and pollution relocation.
This paper contributes to the literature on several fronts. Past literature that evaluates this policy seldom pays attention to the spillover effect on untreated areas (e.g., Yu et al., Reference Yu, Kang, Teng, Long and Fu2021; Chen et al., Reference Chen, Tan and Xu2022) or has controversial results (Wang et al., Reference Wang, Su, Chen, Tao, Streets, Lu, Zheng, Carmichael, Lelieveld, Pöschl and Cheng2020a; Zeng et al., Reference Zeng, Bao and McFarland2022). Without realizing the underlying causal mechanisms, including the relative magnitudes of the relocation and geographic spillovers versus the general equilibrium effect, papers that treat the policy as a quasi-natural experiment and make simple comparisons between the treated and untreated cities will generate biased results (Monte et al., Reference Monte, Redding and Rossi-Hansberg2018). The second contribution is that this paper investigates the heterogeneous spatial distribution pattern of the treatment effect in the treated areas and spillovers to the untreated areas. The heterogeneous spatial distribution pattern is a reflection of the heterogeneous incentives of local governments and the heterogeneous natural conditions in China. This aspect is often neglected in policy evaluation practices, but it could reveal interesting implications for policy-makers. Thirdly, the concept of policy diffusion in political science is used to explain the existence of one source of the spillover effects. These observations provide a new perspective for understanding the decision-making process in local governments. These results shed light on the future policy-making processes in not only energy transition but also various other public (especially environmental) policies that involve spillover effects, where the treatment effect for particular regions may differ based on multiple factors, and the net effects and subsequent welfare consequences in untreated areas are non-negligible.
From a broader perspective, this paper also contributes to the energy transition literature by studying a large-scale policy experiment aimed at replacing traditional energy sources with cleaner fuels (e.g., Leach, Reference Leach1992; Markard, Reference Markard2018; Liu et al., Reference Liu, Zhu, Ni and Wei2021). Specifically, this paper corresponds to two geographical components of the energy transition proposed by Bridge et al. (Reference Bridge, Bouzarovski, Bradshaw and Eyre2013): ‘territoriality’ and ‘spatial differentiation’. Territoriality refers to how social and political power is organized and exercised over space and pertains to the geographic strategies of dividing and merging used by economic and political entities to exert control and leverage their influence (Bridge et al., Reference Bridge, Bouzarovski, Bradshaw and Eyre2013). This paper shows that local governments respond to the central government by (1) implementing stronger enforcement if close to Beijing and (2) self-regulating if not regulated by the policy. Spatial differentiation is reflected in the heterogeneous spatial distribution of the treatment (or net) effect.
Finally, the distribution of treatment effect among the treated cities can be explained by strategic effort, which corresponds to the literature on policy experiments in political economy (e.g., Allcott, Reference Allcott2015; Wang et al., Reference Wang, Zhang and Zhou2020b; Wang and Yang, Reference Wang and Yang2025). The treated cities get financial support from the central government that facilitates this transition, and local officials have stronger incentives to perform well. However, if the policy is scaled up and becomes a nationwide requirement, the financial support may not be as strong, so the observed treatment nowadays cannot simply be magnified by a constant multiplier (Davis et al., Reference Davis, Guryan, Hallberg and Ludwig2017; Al-Ubaydli et al., Reference Al-Ubaydli, List and Suskind2019). This issue should raise concerns among policymakers.
The rest of this paper proceeds as follows. Section 2 provides a brief introduction to the CTG policy in China, along with some technical details. Section 3 presents four potential effects that may influence air pollution levels in the untreated area, followed by the formulation of two research hypotheses. Section 4 presents the data and empirical methods, and Section 5 discusses the results and the robustness of the study. Section 6 discusses the spatial distribution of the treatment effect and the potential mechanism. Section 7 concludes the paper, discusses policy implications and indicates potential future extensions of this study.
2. Policy background
Wang et al. (Reference Wang, Su, Chen, Tao, Streets, Lu, Zheng, Carmichael, Lelieveld, Pöschl and Cheng2020a) provide a comprehensive review of related policies and plans for China’s CTG policy, especially in Beijing. This set of policies has two main targets: the first is to reduce air pollution caused by coal burning; the second is to reduce carbon dioxide emissions. Including Beijing, there are a total of 28 cities (the so-called ‘2+26’ cities) listed as ‘the key areas of pollution control’ as well as ‘the first batch of implementation areas of the northern winter clean heating plan’. According to the Ministry of Environmental Protection of China, these cities are Beijing, Tianjin, Shijiazhuang, Tangshan, Baoding, Langfang, Cangzhou, Hengshui, Handan, Xingtai, Taiyuan, Yangquan, Changzhi, Jincheng, Jinan, Zibo, Liaocheng, Dezhou, Binzhou, Jining, Heze, Zhengzhou, Xinxiang, Hebi, Anyang, Jiaozuo, Puyang and Kaifeng (coloured in orange in panel (a) of Figure 1). These cities have the following characteristics in common: firstly, they are close to Beijing geographically. Secondly, they produce and suffer from large amounts of air pollutants because of the consumption of coal and emissions from local industries. Thirdly, they are all located in northern China and provide concentrated heating services to urban residents in the winter. Lastly, they are considered to be within the air pollution transmission channel cities of the Beijing–Tianjin–Hebei region.
The spatial distribution of the CTG and control cities. (a) CTG and control cities and (b) central area and control cities.

The focal policy of this study is the 2017–2018 Autumn and Winter Air Pollution Comprehensive Control Action Plan for Beijing–Tianjin–Hebei Region and Surrounding Areas, issued in 2017 by the Ministry of Environmental Protection of China.Footnote 2 This 137-page-long document (Ministry of Environmental Protection, 2017) provides a comprehensive description of the target, implementation scope, timeline, quantitative tasks for each involved province and city, and so forth. By analysing the policy tools in the document, we find that the implementation methods are concentrated in clean heating, bulk coal governance, industrial restructuring and upgrading, emissions permits, resolving overcapacity and boiler governance. These measures may take different forms during implementation, but they all serve the common goal of clean energy transition.
Although the policy document sets specific and quantitative tasks for local governments, they may overreact to this policy. According to a report by the Clean Heating Industry Committee (2021), China plans to complete the task of replacing bulk coal in 3 million households as part of the plan of the CTG policy and finally complete more than 5.5 million households. Taking Hebei Province as an example, the original plan issued by Hebei Province was to convert 1.8 million households from coal to gas and 4,500 steam tons of boilers from coal to gas. However, the actual CTG conversion involved 2.6 million households, and 11,700 steam tons of boilers have been renovated. In 2017, there was a shortage of natural gas on a large scale across the country, and the mismatch between supply and demand of CTG was one of the main reasons.
Among all the technical methods for the clean energy transition, CTG is the most common and feasible one. According to a report by the Chinese Academy for Environmental Planning (2021), among the transformation users in key areas, 52 per cent changed from coal to gas, 38 per cent from coal to electricity, 7 per cent from coal to central heating and 3 per cent from coal to geothermal, biomass, and solar energy and other methods.
The transformation is not frictionless: it requires a significant investment in both burning and transmission infrastructure. Due to the different combustion characteristics of coal and natural gas, coal-fired power units usually cannot directly burn natural gas. To comply with the regulation, existing coal-fired facilities shall either undergo natural gas retrofit or replacement with gas-compliant units. Natural gas is transmitted to residents and industrial users primarily through two channels: pipelines and LNG trucking. In LNG-based supply, cryogenic tanker trucks transport LNG from liquefaction plants to storage facilities. The LNG is stored in vacuum-insulated tanks and then regasified at satellite stations or peak-shaving plants. For off-grid users, LNG can be delivered directly via truck, stored in on-site cryogenic tanks and regasified for local consumption.
Not only is residential use of coal regulated by this policy, but industrial firms are also subject to regulation, alongside the construction of a series of environmental quality monitoring stations. Coal-fired boilers with a capacity below a certain threshold are strictly prohibited from use in these cities. Gas boilers are required to complete low-nitrogen transformation, and the remaining coal-fired boilers should be equipped with emission purification devices. Any industrial firms whose emissions are related to air pollutants included in the ‘phase-out category’ will be shut down and banned before the end of September 2017.
The transition from coal to gas did not only happen in China. Pratson et al. (Reference Pratson, Haerer and Patiño-Echeverri2013) discover that with the decline of natural gas and the enforcement of environmental regulations, coal plants may lose the cost advantage over natural gas plants in the US. Wilson and Staffell (Reference Wilson and Staffell2018) observe that carbon emissions fell by 6 per cent in Great Britain in 2016 because of the wider adoption of natural gas and suggest using the carbon price as an instrument to incentivize the transition from coal to gas. The U.S. Energy Information Administration (2020) documents that 103 coal power plants were transformed into natural gas power plants between 2011 and 2019. Coulomb et al. (Reference Coulomb, Lecuyer and Vogt-Schilb2019) propose an optimal path for transitioning from coal to gas and renewable energy under capacity constraints and adjustment costs. They suggest investing in renewable energy before fossil fuels phase out and find that it is beneficial to invest in natural gas to decrease the need for expensive renewable energy in the short term. Tanaka et al. (Reference Tanaka, Cavalett, Collins and Cherubini2019) compare the CTG transition in China, India, Germany and the US and find that this transition is in line with the carbon reduction target, even though the leakage of methane causes more damage to the ozone layer compared to CO $_2$.
3. Spillover and general equilibrium effects
In untreated areas, the local air pollution level could be affected by four channels, which may increase or decrease air pollution. These spatial interactions of economic activity, allocation of resources and geographical interconnection will lead to substantial heterogeneity (Redding and Rossi-Hansberg, Reference Redding and Rossi-Hansberg2017; Monte et al., Reference Monte, Redding and Rossi-Hansberg2018), both between treated and untreated cities and specific cities within them. The mechanism and the sign of these channels are introduced in this section.
3.1. Spillover effects
The spillover effects are reflected in four channels: the physical (geographical) channel, the political channel, the relocation channel and the price channel. The physical channel emphasizes that the improvement in air quality in the north will spill into the south by wind (e.g., Chen and Ye, Reference Chen and Ye2019; Song et al., Reference Song, Liu and Wang2021), given that the prevailing wind direction in China in the winter is from north to south. In fact, this kind of wind-transmitted air pollution is widely used as an instrumental variable in related economic literature (for instance, Bayer et al., Reference Bayer, Keohane and Timmins2009; Zheng et al., Reference Zheng, Zhang, Sun and Lin2019; Chen et al., Reference Chen, Chen, Lei and Tan-Soo2021; Fu et al., Reference Fu, Viard and Zhang2022; Wang et al., Reference Wang, Lin and Qiu2022). However, the distribution of the physical spillover effect is hard to distinguish because it is affected by many factors, including the distance to the pollution source, the terrain from the source to the target and weather conditions.
The political channel describes the process through which local governments in the south will proactively transform to cleaner energy in response to the call of the central government (the so-called ‘policy diffusion’). The motivation may come from local governments’ expectation that this type of clean energy movement will eventually spread across the country. They need to be prepared for this in advance, rather than causing panic and inconvenience to businesses and residents alike with hastily pursued reforms in the north.
In comparison, the third spillover effect is that environmental regulations in the treated area will force the pollution-intensive industries to relocate to unregulated areas (Shen et al., Reference Shen, Wei and Yang2017; Fan et al., Reference Fan, Gao and Tang2023), creating a ‘pollution shelter’ (e.g., Fang et al., Reference Fang, Chen, Hubacek, Ni, Chen, Feng and Lin2019; Feng et al., Reference Feng, Du, Lin and Zuo2020). This is sometimes referred to as ‘leakage’, especially in the field of climate change (e.g., Ellerman et al., Reference Ellerman, Marcantonini and Zaklan2016; Naegele and Zaklan, Reference Naegele and Zaklan2019). This kind of spillover effect will make the air quality in the untreated areas worse. The existence of this spillover effect requires that the pollution-intensive plants in the regulated areas be shut down (not transformed into environmentally friendly plants, otherwise the environmental quality of untreated areas will not be affected) and that they be capable of relocating to other places.
The price spillover or general equilibrium effect states that a sudden increase in gas demand in northern China (CTG restricted areas) will push up gas prices nationwide, forcing heat consumers elsewhere to switch to other energy sources (e.g., coal). Moreover, a sudden reduction in the demand for coal also results in a decrease in its price, leading to more consumption of coal elsewhere (Xu and Klaiber, Reference Xu and Klaiber2019). This effect is expected to lead to an increase in air pollution in unregulated parts of China. It is important to recognize that this general equilibrium effect does not distribute evenly across space because the coal resource endowment and the demand for extra heating in the winter could vary significantly in different places (e.g., southern places are warmer in the winter and do not require the same amount of heating as their northern counterparts).
The general equilibrium effect in the untreated area can be illustrated using a simplified partial equilibrium model for energy consumers. Assume the utility for a consumer  $i$ is linear in the heat she consumes (
 $H_i$):
 \begin{equation*} u_i=BH_i, \end{equation*}
where  $B$ is the local amenity (e.g., air quality) affected by the energy use:
 $B = f(coal, gas)$, such that the usage of coal in the whole city (
 $coal = \sum_i coal_i$) creates a disamenity to the city, and the usage of natural gas (
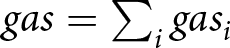 $gas = \sum_i gas_i$) creates an amenity:
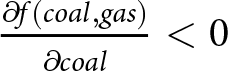 $\frac{\partial f(coal, gas)}{\partial coal} \lt 0$,
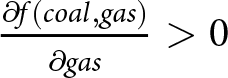 $\frac{\partial f(coal, gas)}{\partial gas} \gt 0$. Heat consumed by a consumer
 $H_i$ is generated by a combination of coal and natural gas through a CES function, where the two energy sources are substitutable with the elasticity of substitution
 $\sigma \gt 1$:
 \begin{equation*} H_i = (coal_i^{\frac{\sigma-1}{\sigma}} + gas_i^{\frac{\sigma-1}{\sigma}})^{\frac{\sigma}{\sigma-1}}. \end{equation*}
At the same time, the consumer faces a budget constraint:
 \begin{equation*} p_ccoal_i+p_ggas_i = w_i, \end{equation*}
where the price of coal can be normalized to 1 (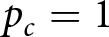 $p_c=1$). In this partial equilibrium setting, for the sake of illustration, we assume that the wage is unaffected by the policy. Then the optimal coal and gas consumption is
 \begin{equation}
coal_i^* = \frac{p_g^{\sigma-1}w_i}{1+p_g^{\sigma-1}},
\end{equation}
 \begin{equation}
gas_i^* = \frac{w_i}{p_g(1+p_g^{\sigma-1})}.
\end{equation}
For the untreated area, after a policy shock that increases the national natural gas price, coal consumption increases (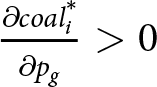 $\frac{\partial coal_i^*}{\partial p_g} \gt 0$) and gas consumption decreases (
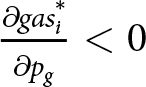 $\frac{\partial gas_i^*}{\partial p_g} \lt 0$). Since the local air quality
 $B$ worsens as coal use increases, an increase in the natural gas price leads to deteriorated air quality:
 \begin{equation}
\frac{\partial B}{\partial p_g} = \underbrace{\frac{\partial B}{\partial coal}}_{-} \underbrace{\frac{\partial coal}{\partial p_g}}_{+}+\underbrace{\frac{\partial B}{\partial gas}}_{+} \underbrace{\frac{\partial gas}{\partial p_g}}_{-} \lt 0.
\end{equation}
3.2. The net effect
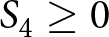
If the sum of the price and relocation spillover effects outweighs the physical and political spillover effects, the hypothesized treatment will increase the pollution level of the central provinces; if the physical and political spillover effects outweigh the sum of the price and relocation spillover effect, air quality should experience an improvement in the central provinces. It is also likely that these effects cancel out and leave the central provinces unaffected in general. The overall net effect can be decomposed using the following equation:
 \begin{equation}
T = S_1+S_2+S_3+S_4,
\end{equation}
where  $T$ stands for the overall net effect, which can be calculated with historical air pollution data;
 $S_1$ is the physical spillover effect, and
 $S_2$ is the political spillover effect. These two spillover effects are assumed to be no greater than zero (
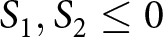 $S_1, S_2 \le 0$, pollution-alleviating). The relocation spillover effect is
 $S_3$ and is assumed to be no less than zero (
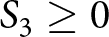 $S_3 \ge 0$, pollution-intensifying);
 $S_4$ is the price spillover effect, and it is assumed to be no less than zero (
 $S_4 \ge 0$).
3.3. Hypotheses
Based on the above analysis, we make two hypotheses regarding the treatment effect ( $\tau$) and net effect (
 $T$) in the treated and untreated cities, respectively:
Hypothesis 1. In treated cities, the CTG policy will decrease the air pollution level in general, while the scale of the treatment effect may depend on the location of the city (i.e.,  $\tau \lt 0$).
Hypothesis 2. In untreated cities, the CTG policy may either increase or decrease air pollution levels, depending on city-specific conditions. The scale of this effect depends on the relative magnitudes of the aforementioned antithetical forces (i.e.,  $|S_1+S_2| \le \text{or} \ge |S_3+S_4|$), showing a heterogeneous spatial distribution pattern.
4. Data and methodology
4.1. Data
The PM10 panel dataset utilized in this study comes from Wei et al. (Reference Wei, Li, Xue, Sun, Fan, Liu, Su and Cribb2021) and consists of raster data with a resolution of 1 km  $\times$ 1 km. To incorporate spatial information, we integrated a shapefile layer containing prefecture city boundaries into the raster data. Subsequently, we computed the PM10 levels for each city and each year spanning from 2000 to 2020. In northern China, where heating demands are high during winter, air pollution typically reaches its peak during the heating season, encompassing November to March. To ensure consistency of the analysis, we derived the average PM10 level for each city within the heating season for each year. For instance, the 2017 heating season encompasses November and December in 2017, as well as January, February and March in 2018. Given that the focal policy document was published in August 2017, the heating season in 2017 was considered to be the initial treated period. The analysis period covers the heating seasons from 2000 to 2019.
Figures A1–A3 (Appendix A) provide an intuitive illustration of the PM10 pollution redistribution in China between 2011 and 2017. Three trends can be inferred from the maps: (1) before 2017, the pollution centre was concentrated in the North China Plain; (2) the nationwide overall pollution level has been decreasing over the years; and (3) the pollution level in the western area is rising.
The economic and demographic information for each prefecture city comes from China City Statistical Yearbook prefecture-level city panel data, covering the same period as the PM10 dataset. It is an annual publication that reflects the social and economic development of Chinese cities. Specifically, population, GDP growth rate and the ratio of GDP from the second industry were chosen as the control variables when performing the DID analysis.
Temperature is naturally closely related to the consumption of heating. Generally, people living in places with lower winter temperatures tend to consume more heating (could be concentrated or dispersed) to maintain daily life. The monthly prefecture city-level average temperature data is obtained from weather stations across China. The data of the meteorological station is interpolated into grid data with a resolution of  $0.1^\circ \times 0.1^\circ$ and then the grid data is converted into raster data and averaged at the monthly level for each city.
4.2. Synthetic DID
The family of DID methods is used to study the consequences of the CTG policy. Among the large family of DID, the SDID proposed by Arkhangelsky et al. (Reference Arkhangelsky, Athey, Hirshberg, Imbens and Wager2021) is particularly appealing for several reasons. Firstly, since the policy was issued before the heating season in 2017, there has been no stage-wise roll-out of treatment. All the treated cities are treated in the same year. Secondly, compared to the traditional DID method, SDID has the ability to approximate the parallel trend well, given the nature of its objective function. Thirdly, as noted by Arkhangelsky et al. (Reference Arkhangelsky, Athey, Hirshberg, Imbens and Wager2021), SDID is competitive with or even dominates DID in applications when DID has been used in the past. It combines the advantages of DID and synthetic control (Abadie et al., Reference Abadie, Diamond and Hainmueller2015) as this method reweights and matches pre-treatment trends to weaken the reliance on the parallel trend assumption and is invariant to additive unit shifts.
Using a balanced panel with  $N$ units and
 $T$ time periods, the treatment effect (
 $\hat{\tau}^{sdid}$) is estimated by minimizing the following objective function, given the unit and time weight parameters
 $\hat{\omega}_{i}^{sdid}$ and
 $\hat{\lambda}_{t}^{sdid}$:
 \begin{equation}
(\hat{\tau}^{sdid}, \hat{\mu}, \hat{\alpha}, \hat{\beta}) = \text{argmin}_{\tau^{sdid},\mu,\alpha,\beta}{\sum_{i=1}^N\sum_{t=1}^T (Y_{it} - \mu - \alpha_{i} - \beta_{t} - W_{it}\tau^{sdid})^2\hat{\omega}_{i}^{sdid}\hat{\lambda}_{t}^{sdid}}.
\end{equation}
 $Y_{it}$ is the outcome variable, which is the PM10 level measured by
 $\unicode{x03BC}$g/m
 $^3$ in this study.
 $W_{it}$ is the binary treatment variable that equals one if city
 $i$ is in the treated group and year
 $t$ is greater or equal to 2017.
 $\alpha_i$ and
 $\beta_t$ are city and year fixed effects, respectively. The standard error is calculated by the placebo approach. The unit and time weight parameters (
 $\hat{\omega}_{i}^{sdid}$ and
 $\hat{\lambda}_{t}^{sdid}$) effectively emphasize control units that are similar to the treated units and pre-treatment periods that are similar to the treated periods.Footnote 3 Therefore, through the incorporation of time weights, SDID effectively eliminates bias by utilizing pre-treatment periods that possess greater accuracy in predicting post-treatment outcomes (Arkhangelsky et al., Reference Arkhangelsky, Athey, Hirshberg, Imbens and Wager2021). By including the unit weights, the average for the treated units is approximately parallel to the weighted average of the control units (Arkhangelsky et al., Reference Arkhangelsky, Athey, Hirshberg, Imbens and Wager2021). These characteristics make SDID a better option compared to synthetic control and DID in general.
The donor pool consists of all the untreated cities in the provinces that have treated cities, as well as cities and provinces that are either geographically close to the treated ones or have some similar characteristics, as shown in panel (a) of Figure 1.Footnote 4 Table A1 in Appendix A shows the descriptive statistics for key variables in the pre-treatment periods for the treated and donor cities.
4.3. Difference-in-differences
The DID method is also used as a robustness check. The two-way fixed effect estimator is estimated with the following regression:
 \begin{equation}
Y_{it} = \tau^{did} Treated_{it}+\gamma X_{it}+\alpha_i+\beta_t+\varepsilon_{it},
\end{equation}
where 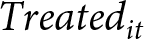 $Treated_{it}$ is an indicator that equals one if city
 $i$ is treated and year
 $t$ is greater or equal to 2017. Control variables
 $X_{it}$ include population density, the average temperature from November to December, the average temperature from January to March, the lowest temperature from November to December, the lowest temperature from January to March, the GDP growth rate and the share of the secondary industry in GDP. Missing observations are imputed by the average of neighbouring periods.
 $\alpha_i$ is the city fixed effect and
 $\beta_t$ is the year fixed effect.
 $\tau^{did}$ is the variable of interest that needs to be estimated. Standard errors are clustered at the provincial level.
In practice, the identification assumption of DID is that in the absence of the treatment, the outcome variable  $Y$ for the treated and control groups should have the same trend. This is also known as the parallel trend assumption. This assumption guarantees that the differentiated changes in the outcome variable between the treated and control groups after the treatment are fully credited to the treatment itself, and not to any pre-existing confounders. The second assumption is that there is no other treatment on the treated group that happened at the same time as the treatment under analysis.Footnote 5 These assumptions will be elaborated on in the next section.
5. Results
5.1. Treated areas
Panel (a) of Figure 2 displays the graphical results of the SDID method. The treated unit consists of all 2+26 cities. The treatment effect is  $-$14.161
 $\unicode{x03BC}$g/m
 $^3$ and it is statistically significant at the 0.01 level (the placebo standard error is 1.014). The graph shows that the trend of the synthetic control and the observed data satisfy the parallel trend assumption in the pre-treatment periods well. Table 1 shows the DID results as a robustness check. Column (1) shows the DID results without any control, and column (2) shows the DID results with economic controls for the treated ‘2+26’ cities. The estimated treatment effect is statistically significant, and adding controls leads to an increase in the magnitude of the treatment effect. The point estimate in column (2),
 $-$12.48
 $\unicode{x03BC}$g/m
 $^3$, is very close to the SDID estimate. Thus, the DID results provide an additional layer of robustness to the SDID results. In order for the DID results to be credible, the parallel trend assumption needs to hold. Panel (a) of Figure A4 in Appendix A shows the co-movement of the average PM10 level in the treated cities and the donor pool. It can be seen that, except for a peak in 2001–2003 in the treated cities, which is not reflected in the control group, the pre-treatment trends of the control and treated groups align with each other well. Besides, our search did not find any policy that happened at the same time that targeted this area.
SDID results. (a) SDID result for treated cities and (b) SDID result for central cities (net effect of spillovers).

DID results for the treatment and net spillover effect for the treated and central cities

Notes: Control variables include population, the average temperature in the heating season, the lowest temperature in the heating season, the GDP growth rate and the share of the secondary industry in GDP. Year- and city-fixed effects are controlled. Standard errors are clustered at the provincial level. Matching is conducted in coarsened exact matching on the controls as mentioned earlier (Iacus et al., Reference Iacus, King and Porro2012). Standard errors are in parentheses.
Overall, the CTG policy succeeded in improving the air quality in the treated area, and the treatment effect is substantial, given the historical level of pollution.
5.2. Untreated areas
We performed the same policy analysis for an untreated area, the central part of China, to examine whether the general equilibrium effect documented in Wang et al. (Reference Wang, Su, Chen, Tao, Streets, Lu, Zheng, Carmichael, Lelieveld, Pöschl and Cheng2020a) exists, and to quantify the net spillover effect. For the central part, we select four provinces: Hunan, Hubei, Anhui and Jiangxi. These provinces are selected because they are close to and lie south of the Qinling Mountain–Huai River line, which divides China into the northern and southern parts.Footnote 6 Thus, they do not have concentrated heating provided by the government, yet face similar heating needs as their northern neighbours. Wang et al. (Reference Wang, Su, Chen, Tao, Streets, Lu, Zheng, Carmichael, Lelieveld, Pöschl and Cheng2020a) also select these provinces because they are traditionally short of natural gas. To ensure that the donor pool for this part of the analysis is not affected by the general equilibrium effect of the policy, the four southernmost provinces (Fujian, Guangdong, Guangxi and Hainan) are selected. These provinces have no heating needs in the winter for most years, and they are far enough from the northern provinces that they will not be affected by air-transmitted pollutants. These features make them the best control group that is least affected by spillover effects and the general equilibrium effect mentioned in Section 3 (Butts, Reference Butts2021). Panel (b) of Figure 1 shows the distribution of these provinces.
Panel (b) of Figure 2 shows that the CTG policy indeed has a statistically significant negative impact on the PM10 level in the central provinces (point estimate is  $-$5.985
 $\unicode{x03BC}$g/m
 $^3$, placebo standard error is 1.626). This is in line with Li et al. (Reference Li, Hammer, Zheng and Cohen2022), which observes nationwide accelerated air pollution reduction since the implementation of the CTG policy. However, this effect is much smaller compared to the magnitude in the treated cities (2+26 cities,
 $-$14.161
 $\unicode{x03BC}$g/m
 $^3$). Since the estimate is negative, it is reasonable to conclude that the geographical and policy spillover effects dominate the sum of the price spillover and the relocation effect (
 $|S_1+S_2| \gt |S_3+S_4|$), contradicting the findings in Wang et al. (Reference Wang, Su, Chen, Tao, Streets, Lu, Zheng, Carmichael, Lelieveld, Pöschl and Cheng2020a).
Columns (4) and (5) in Table 1 display the DID estimates for cities in the central provinces, without and with controls. The results are statistically significant and negative, giving support to the main results. Surprisingly, the estimated net spillover effect is larger than the treatment effect in treated cities before adding controls, and the magnitude is larger than the SDID estimate. After adding controls, the point estimate for treated cities is larger than that for central cities, but the magnitude for central cities is still almost twice as large as the SDID estimate. The differences in estimation results are fully due to differences in the weighting scheme of the pre-trend time periods and control units, as mentioned in Section 4. Since Arkhangelsky et al. (Reference Arkhangelsky, Athey, Hirshberg, Imbens and Wager2021) argue that SDID has multiple advantages over DID, the SDID estimates ( $\hat{\tau}^{sdid}$) are used as the benchmark. Panel (b) of Figure A4 (Appendix A) plots the pre-treatment trend for central cities and their control group, respectively. Visual examination indicates that the central cities share a similar pattern to the control group. Since both SDID and DID methods show the same sign of the treatment effect for central provinces, it can be concluded that in the central provinces in this study, the geographical and policy spillover effects of the CTG policy outperform the price spillover and the relocation effect.
A series of additional robustness checks are also conducted, including an event-study method, coarsened exact matching (Iacus et al., Reference Iacus, King and Porro2012), a placebo test and the addition of more flexible fixed effects that consider the city-specific time trend. The results are robust to these specifications. Detailed explanations are available in Online Appendix B.
6. Discussion
In this section, we discuss several patterns that emerge from the spatial distribution of the net effect in both the treated and untreated regions. Next, we examine the relocation channel using firm entry data and provide suggestive evidence of policy diffusion from provincial-level government documents.
6.1. Spatial distribution of the net effect
There is no reason to assume that every treated city experiences the same treatment effect. Variations in geographical location, local resource endowment and heat demand function together bring the possibility that the untreated cities have different relative strengths with regard to the spillover effects and the general equilibrium effect, resulting in heterogeneous net effects. In this subsection, we discuss the heterogeneous spatial distribution pattern of the treatment effect and the net spillover effect for the treated and untreated regions.
Panel (a) of Figure 3 shows the spatial distribution of the net spillover effect calculated by SDID for central cities. The donor pool consists of the aforementioned four southern provinces that are assumed not to be influenced by the CTG policy due to their geographical location. From this panel, the following patterns emerge. Firstly, the net spillover effect is more prominent in the centre parts, while the periphery regions tend to have lower net effects. In fact, the six cities with the largest net effects are all located in Hubei province. The most prominent net spillover effect ( $-$11.51
 $\unicode{x03BC}$g/m
 $^3$) is seen in Wuhan, the provincial capital of Hubei province.Footnote 7
The geographic distribution pattern for the treatment and net spillover effects and winter temperature in treated and central cities. (a) Distribution of net spillover effect (central), (b) distribution of winter temp. in 2017 (central), (c) distribution of treatment effect (treated) and (d) distribution of winter temp. in 2017 (treated).

Secondly, the seven cities with a positive net effect (i.e., the CTG policy makes their air quality worse off) are all located in Anhui province, which has a comparatively higher latitude among these four provinces. These cities are also in the northernmost part of Anhui province. Panel (b) of Figure 3 shows the distribution of winter (heating season) average temperature in the central provinces. A clear pattern emerges: places with a positive treatment effect coincide with the places that have the lowest winter average temperature. This might be because people there have higher heating needs in the winter, and the rise in the price of natural gas results in higher demand for coal compared to other places in the central provinces. Using the notations in Equation (4),  $|S_3+S_4| \gt |S_1+S_2|$ holds in this case. Moreover, the overall net effect fades out in the southern part of the central provinces. The average temperature in the heating season in this area exceeds
 $12^\circ\mathrm{C}$, making this area warm enough not to use heating most of the time during the winter. This null net effect confirms the channel of heating needs and energy prices.
Panels (c) and (d) of Figure 3 show the distribution of the treatment effect and winter temperature of the CTG policy in the treated area. There is no clear spatial pattern regarding the latitude, as shown in panel (a), so temperature may not be a key mediator in this context. However, cities with the highest treatment effects are those located in the Beijing–Tianjin–Hebei area.
These proposed hypotheses are tested using data on winter temperature, distance to Beijing and the estimated treatment effect (or spillover effect). We run the following regression to show the relationship between winter temperature and the treatment effect (or net spillover effect) for the treated and central cities:
 \begin{equation}
\tau_i = \beta_1temp_i + \beta_2temp_i^2 + \alpha X_{i} + \varepsilon_i,
\end{equation}
where  $X_i$ contains local controls (population and city-level GDP in 2017). Columns (1) and (4) of Table 2 show the linear relationship, and columns (2), (3) and (5) show the quadratic relationship, for untreated and treated cities, respectively. Consistent with the observation from the distribution maps, there is a statistically significant quadratic relationship for the central cities: as the winter temperature increases, the net spillover effect starts with a positive value (indicating worse air quality) and then decreases to negative, but rises to zero at the end. This finding is robust to the inclusion of economic controls.
Heterogeneous spatial distribution pattern of the treatment effect

Notes: The first seven columns of this table show the correlation between the calculated treatment effect (or net effect)  $\tau$ at the city level and explanatory variables that explain the observed spatial distribution pattern. The last two columns show the relationship between the distance to Beijing and the number of environmental administrative penalties. The control variables include population and city GDP in 2017. The data on control variables in six provincially administered counties are missing. To account for the possibility that more polluting firms are located closer to Beijing, column (9) additionally controls for the share of secondary industry in GDP at the city level compared to column (8). Standard errors are in parentheses.
In Table 2, columns (6) and (7) show a similar regression for the treated cities, but the independent variable is switched to their Euclidean distance to Beijing (similar to the specification in Sng (Reference Sng2014)). The coefficient on the distance to Beijing is significant and positive. On average, being 1 km closer to Beijing is associated with 0.02  $\unicode{x03BC}$g/m
 $^3$ more reduction in PM10 after the policy implementation. The observed pattern is confirmed by the results: places closer to Beijing tend to have better treatment effects (the negative number means the air pollution decreases) and, as the distance increases, the treatment effect approaches zero or even becomes positive. The heterogeneous treatment effects between treated and untreated regions, as well as within these regions, give rise to heterogeneous policy implications (Caliendo et al., Reference Caliendo, Parro, Rossi-Hansberg and Sarte2018).
What could be causing the observed spatial distributional pattern? The reason for this phenomenon may be related to China’s political economy. Since one goal of the CTG policy is to improve the air quality in Beijing, cities near Beijing implicitly face more pressure or incentives from this ‘political task’. Thus, they may push the policy more aggressively. A motivating example is provided by Wang and Yang (Reference Wang and Yang2025), who show that cities under policy experiments have strategic efforts that may amplify the treatment effect when the same policies are scaled up to the national level (Al-Ubaydli et al., Reference Al-Ubaydli, List and Suskind2019). Another related finding by Du et al. (Reference Du, Qin and Xie2026) also suggests that local governments respond to environmental regulations to offset economic costs and achieve political promotion. To test this hypothesis and study the enforcement of this policy at the city level, we collect the number of environmental administrative penalties at the city level during 2017–2019 from pkulaw.cn, a platform that collects the most comprehensive PRC cases, laws and regulations. The number of environmental administrative penalty cases is used as a proxy for local enforcement and all cases from 2017 to 2019 are summed to match the post-treatment periods. Then, the number of penalty cases is regressed on the distance to Beijing with the same local controls as above. Columns (8) and (9) in Table 2 show the results: cities closer to Beijing tend to have significantly more environmental penalties, indicating stricter enforcement from the local government. This conclusion is robust to the inclusion of economic control variables.
6.2. Firm entry and structural change
To study the firms’ relocation channel in the spillover effects, one would ideally use panel data that records firms’ entry and cancellation (deregistration). To achieve this goal, we utilize the Industrial and Commercial Enterprise Registration Information Data from 2014 to 2019, which contains information on ownership status, date of registration, registered capital, industry, owner’s name, number of employees, geographic location and other relevant details. This dataset also records information about firm exits (license revoked or cancelled) when applicable, but revocations and cancellations exhibit abnormality due to the low number of records (Barwick et al., Reference Barwick, Chen, Li and Zhang2025). Additionally, some small enterprises may choose not to declare their closure to the administration, leading to an incomplete record of cancellation. Thus, we focus on the number of newly registered firms in this subsection. The year 2014 is chosen as the start year because the central government introduced an Entry Registration Reform that significantly reduced the entry barriers (Barwick et al., Reference Barwick, Chen, Li and Zhang2025). For example, prior to this reform, newly registered firms were required to deposit the entirety of the registered capital in a state-owned bank; however, the reform replaced this policy with ‘capital subscription’, which no longer mandates the amount of registered capital.
Table 3 presents the effect of CTG policy on the number of newly established firms by industry with the DID method akin to Equation (6). The control cities are identical to those in the baseline scenario, as depicted in panel (a) of Figure 1. Specifically, we investigate four industries: agriculture, mining, manufacturing and energy production. Since the CTG policy primarily targets the energy production (i.e., mining, energy production) and consumption (i.e., agriculture and manufacturing) sectors, it is expected that the number of newly established firms in these sectors should decrease. The results are generally in line with expectations: the number of firms in mining and agriculture decreases significantly, but no effect is observed in the energy production sector. The number of firms in manufacturing also decreases, although the estimate is statistically insignificant.
The effect of CTG policy on newly established firms by industry

Notes: This table shows the effect of the CTG policy on the number of newly established firms by industry. Standard errors are clustered at the provincial level. Columns (1)–(4) show the results for agriculture, mining, manufacturing and energy production. The data on newly registered firms comes from the Industrial and Commercial Enterprise Registration Information Data (2014–2019). The control group is the same as the baseline DID analysis, as shown in Figure 1. Standard errors are in parentheses.
The validity of the DID estimates hinges on the parallel trend assumption. To test the parallel trend assumption in the pre-treatment periods, we perform an event study for each aforementioned sector, and the results are shown in Figure A6. For each sector, the estimates in pre-treatment periods exhibit a null effect, reaffirming the validity of the DID estimates. Furthermore, although the aggregated effect on manufacturing firms is insignificant, the dynamic effects are evident one year after the treatment (at the 0.05 level). Taken together, this evidence implies that, although we cannot study firm exits directly due to data limitations, studying firm entries by sector provides suggestive evidence of structural changes in the treated cities of the CTG policy.
6.3. Policy diffusion
Policy diffusion is usually defined as the process by which policymaking in one government affects policymaking in other governments, and research on this has mostly focused on policy adoptions (Gilardi et al., Reference Gilardi, Shipan and Wüest2021). According to Shipan and Volden (Reference Shipan and Volden2008), there are four main mechanisms through which policy diffusion can take place: learning, competition, imitation and coercion. In the context of this paper, the first three channels (horizontal diffusion) are more plausible. Governments in the untreated area observe and learn from the treated area, in order to be prepared for the nationwide implementation of this policy in the future (imitation and learning).
However, due to the difficulty of measuring these incentives and data availability, it is nearly impossible to distinguish which channel dominates. Only anecdotal evidence is available to support the existence of such policy diffusion in the untreated area. According to a document issued by the Anhui Provincial Government (2018), the provincial government was planning to ‘actively promote the replacement of coal gasification with natural gas in ceramics, glass, casting, and other industries, and orderly implement the coal to gas conversion of coal-fired facilities’. The Hubei Provincial Government (2022) wrote the following in its energy development plan: ‘accelerate the elimination of industrial small and medium-sized coal-fired boilers, and promote industrial enterprises to convert boilers from coal to gas and coal to electricity’. Hunan province also has similar plans (National Development and Reform Commission of the People’s Republic of China, 2022). These government documents provide suggestive evidence to my hypothesis that the CTG policy is becoming a nationwide policy after its official large-scale implementation in the northern cities in 2017. Table A2 in Appendix A provides an inexhaustive list of air quality-related policies in the untreated provinces. However, establishing the causal linkage between the central government’s policy and local directives, possibly using causal text analysis (e.g., Feder et al., Reference Feder, Keith, Manzoor, Pryzant, Sridhar, Wood-Doughty, Eisenstein, Grimmer, Reichart, Roberts, Stewart, Veitch and Yang2022), remains a topic for future research.
7. Concluding remarks
7.1. Summary of findings
This paper evaluates the environmental consequences of the CTG policy in China. Using the SDID method, we find that the air pollution level decreased significantly in the treated ‘2+26’ cities in northern China, with the treatment effect being  $-$14.161
 $\unicode{x03BC}$g/m
 $^3$. Air pollution also declined in the untreated central provinces by
 $-$5.985
 $\unicode{x03BC}$g/m
 $^3$, although they are not directly targeted by this policy. Further, the distribution of the treatment effect (or net effect) exhibits a clear spatial pattern. For the treated areas, places closer to Beijing tend to have a higher treatment effect, while for the untreated areas, the net spillover effect and average winter temperature exhibit a U-shaped relationship. Several spillover effects could cause the air quality in the untreated area to improve or deteriorate, and the resulting net effect indicates that the positive spillovers (geographical spillover and policy diffusion) dominate the price spillover and the pollution relocation channel.
7.2. Policy implications
From these findings, the CTG policy appears to be performing well in alleviating air pollution, as it has not only achieved its goal of reducing air pollution in the regulated cities but also generated beneficial spillover effects in many other cities. This achievement is acknowledged by the National Energy Administration (2025), which states that: ‘by the end of 2024, the clean heating rate in northern China reached 83 per cent, and the air quality had significantly improved’. But does this mean it is worthwhile to promote this policy nationwide? The literature offers ambiguous answers. Wang and Yang (Reference Wang and Yang2025) discuss the strategic efforts phenomenon in policy experiments in China. Although the CTG policy has a specific targeted area and may not be a good example of policy experiment, it is still vulnerable to local governments’ strategic efforts and requires a significant amount of financial inputs if scaled up to the whole country. Cao et al. (Reference Cao, Liu, Ma and Sun2025) focus on the unintended consequences of the Clean Winter Heating Policy (part of the CTG policy) and find that the unlawful burning of agricultural waste and social discontent increase due to its implementation. Wu et al. (Reference Wu, Xie and Liu2023) pay attention to the long-term effect of this policy and conduct a cost-benefit analysis. Their calculation indicates that the environmental benefits of the policy will fail in the long run, and the cost-benefit efficiency is low.
Moreover, with suggestive evidence that industry relocation contributes to spillover effects, expanding the policy to the national level inevitably narrows the space for manufacturing and creates additional unintended consequences. Evidence from the US further indicates a strong causal linkage between heating costs and mortality risk (Chirakijja et al., Reference Chirakijja, Jayachandran and Ong2023). Thus, although it is intriguing to promote clean energy transition at the national level from the perspective of pollution control, scaling up the CTG policy requires more cautious evaluation of its long-term cost-benefit analysis and welfare consequences, especially in rural areas.
After the initial swift implementation of this policy in 2017–2018, which revealed binding constraints in natural gas supply and affordability, central guidance shifted toward a more gradual and orderly transition. Take the clean heating transition as an example: in a recent reply to the National People’s Congress, the National Energy Administration (2022) said it will support clean-heating options tailored to local resources and incomes, requiring minimal subsidies where feasible, while avoiding one-size-fits-all measures. Additionally, policy guidelines also paid special attention to natural gas supply and infrastructure insufficiency. Shortly after the rapid large-scale transition in the winter of 2017, the Ministry of Ecology and Environment (2019) issued a follow-up guideline that requires local governments to set CTG conversion targets based on contracted heating-season gas volumes and actual supply capacity, and add no new CTG households unless gas contracts, infrastructure and safety measures are in place.
The implementation of the CTG policy in China also offers valuable lessons for large-scale energy transition projects in the Global South. Similar to most other Global South countries, China’s energy transition happened in a top-down manner, with bottom-up direction emerging with the development of decentralized off-grid solar panels in rural electrification (e.g., Bhattacharyya, Reference Bhattacharyya2013; Van Veelen and Van Der Horst, Reference Van Veelen and Van Der Horst2018). Unlike many other countries, the primary goal of the CTG in China was to reduce air pollution, whereas other countries primarily target reducing their reliance on fossil fuels to halt climate change (IRENA, 2021). However, some implications can be drawn from the Chinese case to optimize decision-making processes in Global South countries. Firstly, spillover effects are non-negligible. Although the combined net effects may be heterogeneous, depending on each country’s institutional background, development stage and industrial composition (Chauvin et al., Reference Chauvin, Glaeser, Ma and Tobio2017), policymakers must be aware that spillovers may generate unintended consequences in untargeted areas. Secondly, the treatment effect of energy transition projects may posit heterogeneous spatial distribution patterns and lead to unbalanced development across space. Thirdly, local governments may proactively implement local policies that could enhance or hinder central government policies. Effective policy implementations require synergies among the central government, industry and local governments to create an incentive-compatible operational scheme (Wu et al., Reference Wu, Xu and Zhang2015; Kong and Liu, Reference Kong and Liu2024).
7.3. Future extensions
Further steps can be taken to improve the understanding of the full impact of this policy. Firstly, the aforementioned spillover effects can be quantitatively disentangled when proper data is available. For example, by tracking the location and emission volume of polluting plants, it is possible to identify the third (relocation) spillover effect more accurately. Secondly, this paper only considers the impact of this policy on air pollution, but not the welfare of residents in different areas. Numerous pieces of evidence have indicated that people from both the treated and untreated areas experienced a shortage of heating and dissatisfaction because of the rapid implementation of this policy (e.g., Xu and Ge, Reference Xu and Ge2020; Wang et al., Reference Wang, Su, Chen, Tao, Streets, Lu, Zheng, Carmichael, Lelieveld, Pöschl and Cheng2020a, Liang et al., Reference Liang, He and Qiu2021; Shi et al., Reference Shi, Sun and Shen2021; Xie et al., Reference Xie, Hu, Zhang and Zhang2022). As pointed out by Redding and Rossi-Hansberg (Reference Redding and Rossi-Hansberg2017) and Butts (Reference Butts2021), these interconnection channels and general equilibrium effects are hard to identify with a DID approach. Thus, evaluating the welfare changes requires a general equilibrium model that evolves a limited supply of natural gas and spatial allocation of resources. Thirdly, it is beneficial to investigate the long-term influence and dynamic effects of the policy, and to pay attention to the staggered rollout of this policy across the nation. It is possible that the long-term impact can be different from the short-term impact (Callander, Reference Callander2011).
Supplementary material
The supplementary material for this article can be found at https://doi.org/10.1017/S1355770X26100527.
Acknowledgements
The author thanks the editors and two anonymous reviewers for their helpful comments. The author is grateful to Elena Irwin, Yao Wang, Leah Bevis, Allen Klaiber, and various seminar participants for their suggestions. The author is solely responsible for any errors.
Competing interests
The author declares none.



