1. Introduction
The national accounts measure aggregate economic activity, summarised using indicators of economic performance such as gross domestic product, national income and inflation. First published by the United States in 1947, other countries soon started producing their own accounts, with the United Nations setting out international conventions. But, it is only since the 1990s that attempts have been made to recognise properly the contribution of the non-market sector in the national accounts, mainly because of the difficulties in defining, measuring and valuing these outputs (Pont, Reference Pont2008). To address these difficulties international bodies such as Eurostat published recommendations about how to account for non-market outputs, using an approach termed ‘direct measurement’ (Eurostat, 1995).
All European (EU) countries have implemented direct measurement of non-market outputs, with many hoping to ensure that the measures provide a comprehensive indication of the amount of varied outputs produced in each sector. However, to realise this ambition it is necessary to tackle a problem that has received little attention to date. For any particular output to be included in an index of output growth (or analogously of price growth) there has to be data about it for two adjacent periods. If not, there is no baseline to measure growth against, and the output in question will be dropped from the index.
In the past, when only the output of the market sector was measured directly in national accounts, this was not much of an issue. Rather than a comprehensive measure, output or price growth in market sectors of the economy has typically been estimated from a sample of goods or services. An example is the United Kingdom’s Consumer Price Index (CPI). It would be impractical to calculate the CPI using information about all goods and services traded in the economy. Instead, the CPI is based on price changes for a basket of some 650 items, the composition of this basket remaining constant for a succession of periods (Pike, Reference Pike2008). If new products appear, they can be included when the basket is reconstituted. This ensures that, rather than being brand new when accounted for, the product will be established to the extent that there will be volume and price data in adjacent periods, thereby allowing either output or price changes to be calculated for the product in question. The inevitable lag in accounting for new products will not have a substantial impact on growth estimates provided that they represent only a small proportion of products in the sector.
This solution is not satisfactory when considering the non-market sector because outputs are much less stable from one accounting period to the next. This instability is not driven by a greater frequency of new products appearing. Rather, it is because the ways of classifying non-market outputs are often subject to wholesale revision. This is particularly true in the health system. For instance, countries that classify hospital outputs using some form of diagnosis-related groups periodically overhaul the classification architecture. France completely revised and expanded their Groupe Homogenes de Malade (GHM) from 784 to 2291 GHMs when introducing version 11 in 2009; in 2010 the Dutch consolidated their 100,000 Diagnose Behandeling Combinaties (DBCs) into just over 30,000 DBCs; and in 2007 the English expanded the number of Healthcare Resource Groups (HRGs) from 565 to 1400.
There is no agreed way to deal with such categorisation overhauls in constructing estimates of productivity growth. In this paper, after briefly describing how indices of output growth are specified, we outline the challenges associated with categorisation changes, review ways of dealing with the matter and propose a solution. We then turn to the construction of indices of input growth.
We populate output and input indices in order to estimate productivity growth in the English National Health Service (NHS) for the period 2003–2004 to 2007–2008. We construct a comprehensive index of output growth, incorporating all care provided to NHS patients and capturing improvements in survival rates, waiting times and disease management and we implement our proposed solution to dealing with changes to how health services are defined. We assess how estimates of output growth vary according to how categorisation changes are handled.
Our index of input growth captures all inputs into health service production and we improve on how capital has been measured in the past. Productivity is assessed by comparing output growth with growth in inputs and we draw conclusions about changes in productivity of the NHS in England for the period considered.
2. Methods
Total factor productivity growth is calculated by dividing an index of output growth by an index of input growth:

where ΔTFP is total factor productivity growth, I is the index of output growth and Z is the index of input growth. In order to estimate total factor productivity, it is therefore necessary to correctly define and measure the output and input indices. Section 2.1 addresses the methodological challenges involved in measuring NHS outputs and dealing with categorisation changes, whereas Section 2.2 addresses the issues involved in dealing with NHS inputs.
2.1 An index of output growth
In previous work, we developed an output index that has now been adopted for the UK national accounts (Dawson et al., Reference Dawson, Gravelle, O’Mahony, Street, Weale, Castelli, Jacobs, Kind, Loveridge, Martin, Stevens and Stokes2005; Office for National Statistics (ONS), 2008). This index takes the general form:
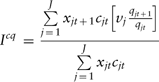
where xj is the number of patients who have output type j, where j = 1 … J; cj indicates the cost of output j; and time is indexed by t.Footnote 1 Costs are likely to be an imperfect reflection of the relative value of different types of output and we proposed that cost-weighted output should be adjusted for quality. The above formulation does this by scaling cost-weighted output by the change in quality, where qj represents a unit of quality for output j, and vj is the value of a unit change in quality.
We allow the characterisation of quality to vary across healthcare settings, partly because activities in different settings have different quality characteristics and partly because the available data differ by setting. Complete details of rationale behind and operationalisation of the quality measures used in England are provided elsewhere (Dawson et al., Reference Dawson, Gravelle, O’Mahony, Street, Weale, Castelli, Jacobs, Kind, Loveridge, Martin, Stevens and Stokes2005; Castelli et al., Reference Castelli, Dawson, Gravelle and Street2007; Derbyshire et al., Reference Derbyshire, Zerdevas, Unsworth and Haslam2007). In brief, however, these measures attempt to capture characteristics of health outputs of value to patients: how long they have to wait for outpatient appointments and admission to hospital; the impact of hospital treatment on health status; and the impact of a primary care consultation on the control of cholesterol and high blood pressure.
2.1.1 Changes in output categories
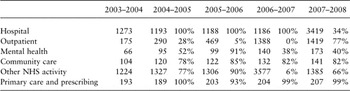
Conventional calculation of output growth requires output categories to be consistent across adjacent time periods (Eurostat/Commission of the European Communities et al., 1993). But, this requirement is not satisfied in England where categorisation of health service output has been subject to frequent wholesale revision. The extent of these revisions is evident from Table 1. This shows the number of output categories by healthcare setting each year and the percentage of categories each year that were used in the previous year. Version 3.5 HRGs were used to describe hospital output until 2007–2008, when a new version was introduced – but 34% of hospital outputs were still described under the old version in 2007–2008. The classification of outpatient activity has changed dramatically each year. Only 28% of the categories used in 2004–2005 had been defined in 2003–2004; there was another major revision in 2005–2006; and complete overhaul in 2006–2007 whereby visits were newly classified according to whether or not they were consultant led, were delivered by a multi-professional team and whether or not they were ‘face to face’. There have been similar year-on-year overhauls to how mental health, community care and other activities have been described. There has been a consistent set of output categories only in primary care over the full period. Without addressing the requirement for consistent definition of output categories over time, it would be impossible to measure NHS output growth over this period.
Number of output categories and percentage in previous year, by setting

NHS=National Health Service.
A common solution is to measure growth using a ‘basket’ of outputs. For this to be valid, the basket must be representative of the entire set of outputs and over time. It also precludes comprehensive measurement of all outputs in the sector under consideration.
Another approach is to include output categories only if information is available in two successive years. This ‘traditional’ approach suffers the same drawbacks as above: the index will not be comprehensive and it might not be representative. This can have a profound impact on estimates of output growth, as we shall demonstrate in due course.
A third approach involves mapping of new and retiring activities. This strategy was adopted in Dawson et al. (Reference Dawson, Gravelle, O’Mahony, Street, Weale, Castelli, Jacobs, Kind, Loveridge, Martin, Stevens and Stokes2005) and is used by ONS (ONS, 2009a). Implementation of this strategy involves addressing three challenges.
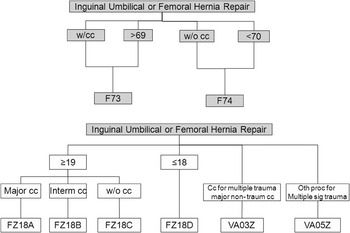
First, all new and obsolete categories must be mapped to each other in some way. It is not at all straightforward to do this – if it were, a new classification system would probably not have been required. In Figure 1, we present an example of version 3.5 and version 4 HRG codes for inguinal umbilical or femoral hernia repair. In version 3.5 HRGs, patients are split according to whether complications are present and by subdividing elderly from other patients. With version 4 HRG codes, the way in which activity is defined is completely different. The age division subdivides younger from other patients; complications are now graded; and some HRGs are now defined on the basis of trauma. As a consequence, the specific relationships required for mapping of the version 3.5 to the version 4 HRG codes are not evident.
Structure of versions 3.5 and 4 HRGs for hernia repair

Second, even if a mapping system could be devised, there remains the need to attribute costs weights to each category. The primary motivation for overhauling healthcare classification systems is to devise a more resource homogenous set of categories. Therefore, for instance, an old category comprising a heterogeneous set of patients might be disaggregated into several new categories of patients with similar costs. But, there is no obvious way of determining what cost weight to apply when mapping these old and new categories.
We propose an approach that involves imputing values for cost (and quality) where the requisite information is missing. The fundamental problem in calculating a Laspeyres index is that when a new output category ( ) is introduced in t + 1, there is no value for its cost in the previous (base) year cjt.Footnote 2 Our proposed method requires a judgment to be made about the unobserved price for the missing period. Most obviously the unobservable value for cjt might be based on the observed value cjt + 1. The use of cjt + 1 necessitates an assumption about how costs would have changed for the specific output type from the previous period, had these outputs been provided. This involves specifying a cost deflator,
 , so that
 can be calculated, where
 is the imputed value for cjt. The US Bureau of Labor Statistics assumes that, for a new product, the relationship between its earlier and current price reflects the change observed for other goods in the relevant sector (Cutler et al., Reference Cutler, McClellan, Newhouse and Remler2001).
It is also necessary to impute a value,  , for what quality would have been in the previous year. As for costs, it might be reasonable to assume that (unobserved) quality in the previous year would be related to observed quality in the current year, such that
 where
 describes the change in the output’s quality over time.
Provided that suitable estimates of  and
 can be found, it is now possible to include all outputs in the index. Subdividing the total set of J categories into those that were newly defined at time t + 1, j = 1…D and those that were defined at time t, j = D + 1…J, the output index becomes:

2.2 Indices of input growth
Inputs into the healthcare system consist of labour, intermediate goods and services and capital. Growth in the use of these ‘factors of production’ can be calculated directly or indirectly. A direct measure of input growth can be calculated when data on the volume and price of inputs are available. If so, input growth is measured as:

where znt is the volume of input of type n at time t and ωnt is the price of input type n at time t. In practice, it is difficult to calculate this index because comprehensive volume data are rarely available. The alternative is to use an indirect measurement approach that relies on expenditure data. Expenditure is driven by both the volume and price of inputs, so for input 1 we have E 1 = z 1 × ω 1. The growth in expenditure for this input from one period to the next is driven by changes in both volume and price:

Thus, expenditure growth comprises both a price effect and a volume effect. To isolate the volume effect it is necessary to convert ‘nominal’ monetary values into ‘constant’ or ‘real’ expenditure using a deflator γn for each input. This deflator reflects the underlying trend in prices for the input in question, such that ωnt = γnωnt + 1. If these are available, the input growth index can be specified as:

This shows that, provided that accurate price deflators are used, and that accurate data are available about the volume and price of each factor, direct and indirect measurements of input growth are equivalent.
The measurement of capital input growth poses special challenges because the contribution of capital in any given period will be a function partly of current expenditure on the asset (Ent) and will also draw on previous investments Ent − 1, Ent − 2,… The questions are: (i) What proportion of past expenditure is devoted to current production? And (ii) What proportion of current expenditure represents investment that will be drawn upon in the future?
The proportions reflect the rate of decayFootnote 3 of the asset, denoted θn. The decay rate that applies to each period’s expenditure relates to how old the asset is (its vintage) at the time that some proportion of it is used (Oulton, Reference Oulton2001, Reference Oulton2005; Oulton and Srinivasan, Reference Oulton and Srinivasan2003). Hence, if we consider an asset deployed across just two periods our indirect input growth index would take the following form:

where  captures the proportionate contribution of current expenditure and θnt + 1Ent − 1 captures the proportionate contribution of expenditure in the previous period to current production. In the denominator, θntEnt − 1 captures the proportionate contribution of the previous period’s expenditure on production in that period and θnt + 1Ent − 2 captures the proportionate contribution of expenditure two periods earlier to production in the previous period. This expression needs to be extended back over all the periods from which past investments are drawn in the current use of the asset.
3. NHS productivity – data sources
3.1 Data sources – outputs
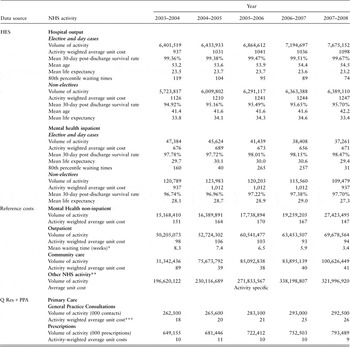
Table 2 provides a summary of data sources and summary statistics for NHS outputs. The hospital episode statistics (HES) are the prime source for identifying the provision of hospital (inpatient and day case) services to NHS patients. HES covers all medical and surgical specialities and includes private patients treated in NHS hospitals. In addition, HES captures hospital care funded by the NHS but provided by the private sector – although the quality of data from some private providers is poor (Healthcare Commission, 2007; Mason et al., Reference Mason, Street and Verzulli2010).
NHS activity sources and data description

NHS=National Health Service; HES=Hospital Episode Statistics; PPA=Prescription Pricing Authority; DH=Department of Health.
*Source: DH performance website.
**Some data from Information Centre.
***Source: Personal Social Services Research Unit.
HES now comprises over 15 million patient records each year. Records are stored according to the financial year in which the period of care finished and each includes a number of data fields, containing demographic data (e.g. age, gender), waiting times, clinical information (e.g. diagnoses, procedures performed) and details of the hospital and specialty where the patient received treatment. We are also able to link HES data to death registry records, so deaths following discharge can be measured.
Each HES record is defined as a ‘finished consultant episode’ (FCE), which is the time that a patient spends under the care of a single consultant. During their course of treatment a patient may be treated by more than one consultant and may be transferred to another hospital, with a new record being created each time this happens. Eurostat recommends that a unit of hospital output should be measured from admission to the end of hospital treatment (Eurostat, 2001). To meet this recommendation we link successive FCEs for each individual patient in HES in order to construct ‘continuous inpatient spells’ (CIPS) that track patients when transferred between consultants and hospitals as part of their care pathway (Lakhani et al., Reference Lakhani, Coles, Eayres, Spence and Rachet2005). We improve on the method described by Lakhani et al. (2005) by linking records across successive financial years. A full description of the algorithm used to identify CIPS and its new characteristics can be found in Castelli et al. (Reference Castelli, Laudicella and Street2008). We use Reference Cost data to assign costs to each CIPS using the method described in Castelli et al. (Reference Castelli, Laudicella and Street2008).
Activity in HES is aggregated using HRGs, which form the output categories for the hospital sector. We calculate the average unit cost, survival rates, age, life expectancy and 80th percentile waiting time of all patients allocated to the same HRG. As it is impractical to report these values for each HRG, Table 2 provides summary statistics on patients admitted to hospital on an elective or non-elective basis or with mental health problems.
The Reference Costs capture data on patients who are not admitted to hospital and whose care is delivered in mental health and community care settings, outpatient and accident and emergency departments and diagnostic facilities.Footnote 4 First introduced in 1997, coverage has increased to include progressively more NHS output. Data are reported using various means of describing a unit of activity, including attendances, contacts, bed days and number of tests.
Although there is a minimum data set equivalent to HES for outpatient appointments, the Reference Costs are the preferred data source because they report both activity and costs. We evaluate the relative merits of the two data sources elsewhere (Castelli et al., Reference Castelli, Laudicella and Street2008). Outpatient waiting times are taken from the Department of Health (DH) performance website.Footnote 5
Community care services comprise activity provided to NHS patients in a community setting, such as nursing services, midwifery visits and therapy services. Categorisation of community services has undergone major year-on-year changes. Even though the number of categories has remained fairly constant, only about 80% of categories are common across adjacent years (Table 1).
‘Other’ NHS activity encompasses various healthcare outputs captured by the Reference Cost data including A&E activity, paramedic services, pathology tests, radiology, chemotherapy, radiotherapy, bone marrow transplantation, high-cost drugs, renal dialysis, spinal injuries, critical care, audiological services, cystic fibrosis and rehabilitation. Information about ophthalmic and dental services and activity provided by Walk in Centres and NHS Direct is derived from the Information Centre (The Information Centre, 2007a, 2007b).
As well as being subject to substantial changes in how output is defined, there has been a major expansion in data collection for both community and ‘other’ NHS activity, with Primary Care Trusts (PCTs) making increasingly detailed returns since 2003–2004. This drives much of the ‘growth’ in these activities and, as a form of sensitivity analysis, we construct output indices with and without these activities.
Estimates of primary care consultations are based on data collected as part of the QRESEARCH project.Footnote 6 QRESEARCH is a large consolidated database derived from the anonymised health records of over 9 million patients. The data currently come from 554 general practices in the United Kingdom using a common clinical computer system. These data are used to derive estimates of primary care output for England as a whole (Fenty et al., Reference Fenty, Coupland, Hippisley-Cox and Gravelle2006).Footnote 7
The volume and cost of prescribing is derived from Prescription Pricing Authority (PPA) data. The PPA data are collected in order to remunerate pharmacists and dispensing general practitioners. It is therefore a reliable and comprehensive measure of the volume of prescriptions dispensed.
3.2 Data sources – inputs
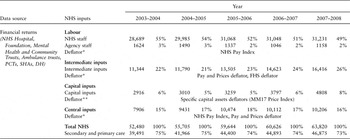
The Workforce Census captures information about the number of staff employed in the NHS, thereby allowing for direct measurement of growth in the use of this input (equation (4)). However, the workforce census provides a partial indication of labour input, as overtime working by NHS staff and the contributions of agency staff are not captured. In view of this, we use the financial returns made by all NHS organisations and apply the indirect method (equation (6)) to calculate input growth by deflating expenditure on each input type, as summarised in Table 3.Footnote 8 We analyse financial data for all NHS providers, including acute hospitals, foundation trusts, mental healthcare and community trusts and ambulance trusts; for PCTs that act as purchasers of care; and for Strategic Health Authorities and the DH.
Real expenditure on NHS inputs (£million, base year 2003–2004)

NHS=National Health Service; PCT=Primary Care Trusts; SHA=Strategic Health Authority; DH=Department of Health; FHS=Family Health Services; ONS=Office for National Statistics.
*Source: DH.
**Source: ONS.
The financial returns detail expenditure on both NHS and agency staff by broad categories of labour input, including medical, dental and nursing staff, scientific, therapeutic and technical staff, healthcare assistants, maintenance and works staff, ambulance staff, administrative and clerical staff, managers and non-executive directors and chairs. A breakdown of expenditure by these categories is available in Street and Ward (Reference Street and Ward2009).
Intermediate inputs include drugs and gases, clinical supplies, catering, hotel services, uniforms, laundry, bedding, energy, establishment and premises costs. This category also includes purchases of healthcare from non-NHS bodies that comprises the highest proportion of PCT expenditure, capturing care purchased from the voluntary sector and local authorities for older people and those with mental or physical disabilities, and acute care for NHS patients purchased from the private sector (Zerdevas, Reference Zerdevas2009).
The financial returns contain two forms of information about capital expenditure: current outlays on equipment and past expenditure reported as depreciation on assets, based on the particular composition and vintage of capital in each organisation. For current outlays, we make assumptions according to the asset in question about what proportion is employed in the current period (Street and Ward, Reference Street and Ward2009). We believe that the use of these data is preferable to current national accounting practice, whereby capital growth is based on an historical data series that is not specific to the NHS and which the ONS recognises as being imperfect (Lee, Reference Lee2006). Price deflators appropriate to each type of capital asset are applied, in recognition that changes in price and quality vary according to the asset in question (Wallis, Reference Wallis2005).
We also include central expenditure that does not appear in organisational financial returns. This includes expenditure on general medical, dental and ophthalmic services and central administration.
4 Results
4.1 Output growth by setting
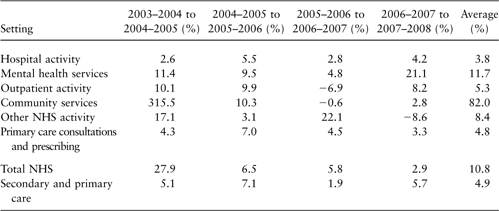
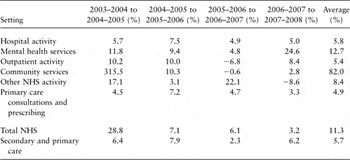
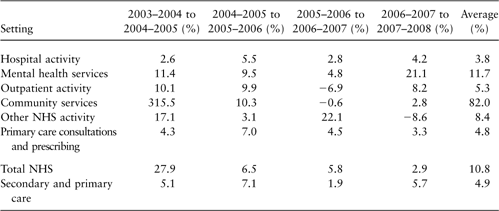
Table 4 reports output growth without accounting for quality, whereas Table 5 incorporates quality into the estimates. Figures are provided according to care setting; for the NHS as a whole; and for the secondary and primary care sectors, excluding community care activity and activities included in the ‘other’ category, where reporting has changed markedly over time.
Output index, no quality adjustment
NHS=National Health Service.
Output index, quality adjusted

NHS=National Health Service.
The volume of elective and non-elective activity has increased each year (see Table 2), and this drives the positive estimates reported in Table 4 with cost-weighted output in the hospital sector increasing by an average of 3.8% per year.
As the summarised data in Table 2 show, survival rates have improved year-on-year and waiting times have fallen, contributing positively to growth. Over time, the NHS has been extending treatment to older patients and, if the age profile of NHS patients increases more rapidly than the improvements in population life expectancy, this will lead to a dampening of output growth. As it stands, the net effect of these various conflicting influences, however, is positive. Quality improvements add an average of 2% to annual output growth in the hospital sector, as the top row of Table 5 reveals, with quality-adjusted output growing by 5.8% per year.
The second quarter of Table 2 indicates that, over time, fewer people with mental health problems are being treated in hospital, with 22,000 fewer CIPS in 2007–2008 than there were in 2003–2004. But, there is increasing provision in other settings, this being captured in the Reference Costs data. There was a marked increase in the number of non-inpatient contacts in 2007–2008 (from 19 m to 27 m), but the concurrent reduction in unit costs suggests that these additional contacts are of below average complexity. The second row of Table 4 shows strong annual positive growth in the provision of mental health care averaging 11.7% per annum, while comparison with Table 5 indicates that improvements in quality add around 1% per year to mental healthcare output.
Outpatient activity has increased steadily over the time period considered, from 50 m appointments in 2003–2004 to 69 m in 2007–2008 (Table 2). But, the average cost of these attendances has varied over time, most notable being the reduction from £103 to £93 between 2005–2006 and 2006–2007. This implies a shift towards less complex activity between these two years, which shows up as a reduction in output of −6.9% (Table 4). Other year-on-year comparisons show positive growth in the cost-weighted volume of outpatient activity with growth over the whole period averaging 5.3% per year. Outpatient waiting times have experienced a continuous reduction over time, falling from eight weeks in 2003–2004, to six weeks in 2006–20/07 and three weeks in 2007–2008. This has contributed a further 0.1% to annual output growth (Table 5).
Between 2003–2004 and 2004–2005 there was a substantial improvement in the data collected on community care. As Table 2 shows, the reported volume of community care contacts increased from 31 m to 76 m, with data collection extending to relatively less costly activities as revealed by the fall in average costs from £89 to £39. Even so, there was dramatic ‘output’ growth of 315% between these years (Table 4). There has also been a sharp increase in activity between 2006–2007 and 2007–2008 from 84 m to 101 m contacts. Some of this may be genuine but could also reflect improved reporting.
Improved data collection also affects the volumes captured in the ‘other’ category that comprises a diverse range of activities reported in the Reference Costs. Data collection has expanded to cover more activities and the description of existing activities has been subject to substantial annual revision, making it difficult to isolate genuine changes in output from improved data collection.
The final rows of Table 2 show that the volume of general practitioner (GP) and nurse consultations has increased over time, and there have been year-on-year increases in the volume of prescriptions dispensed, which have led to positive annual output growth (Table 4). Improvements in the management of blood pressure by GPs contribute around 0.1% to annual output growth (Table 5).
The penultimate row of Table 4 reports total output growth across all settings. Output growth averages 10.8% per year. The figures in Table 5 show that quality improvements add around 0.5% to annual growth. However, the growth of 27.9% between 2003–2004 and 2004–2005 in particular is contaminated by the improved reporting of community care and ‘other’ Reference Cost activity, and expansions in the Reference Costs collection may also impact on other years. For this reason, the final rows of Tables 4 and 5 report growth rates for the secondary and primary care sectors only. This captures activity in hospitals, outpatient departments, in mental health and in primary care (including prescribing). Here, data collection has been consistent and comprehensive over the full period, meaning that the figures measure output growth in those settings accurately. Output growth in secondary and primary care has been subject to year-on-year variation but has been consistently positive, averaging 5% per year (Table 4). Comparison with the figures in Table 5 reveals that improvements in quality have added a further 0.7% to output growth.
4.2 Sensitivity to how categorisation changes are handled
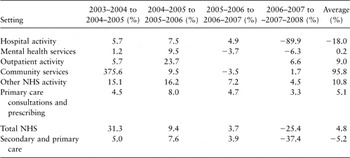
Table 6 reports estimates of quality-adjusted output if only categories that are common across adjacent years are included in the calculation. As the output index is no longer comprehensive, estimates will be biased according to how unrepresentative the included outputs are of the whole.
Output index, quality adjusted – ‘traditional’ approach

NHS=National Health Service.
For hospital activity, the consistent use of HRG version 3.5 from 2003–2004 to 2006–2007 means that the estimates of output growth for this period are the same in both Tables 5 and 6. However, the introduction of version 4 HRGs in 2007–2008 has a pronounced effect on the estimates of output growth between 2006–2007 and 2007–2008. Our imputation method suggests output growth of 5% (Table 5). In contrast, when only those categories that appear in both years are used in the construction of the index, output appears to fall by 90% (Table 6).
The estimates of growth in outpatient activity are also erratic if only categories that are consistently defined over time are included in the index. This is most evident for the years 2005–2006 to 2006–2007 when the overhaul of the categorisation system makes it impossible to calculate the growth in outpatient activity at all (Table 6).
Comparing the final rows of Tables 5 and 6, there are clear differences in the estimates of output growth for the NHS as a whole and for the primary and secondary care sectors. These differences arise because the activity included in the indices reported in Table 6 are no longer comprehensive and the output categories that remain are not representative of the whole.
The mapping approach is likely to be imperfect, particularly if some output categories cannot be mapped, in which case they are dropped from the index altogether. The mapping employed by ONS means that their index of health output captures only 77% of healthcare expenditure, whilst assuming that included and omitted activities grow at the same rate (ONS, 2009b).
4.3 Input growth
Table 3 reports expenditure in constant terms (using 2003–2004 as the base year) for each of the main factors of production. Full details are available in Street and Ward (Reference Street and Ward2009). Real expenditure on NHS staff has increased from £28.7 billion in 2003–2004 to £31.2 billion in 2007–2008, due to increased numbers of staff being recruited into the NHS. Recruitment began to level off after 2005–2006, evidenced by the slowdown in real expenditure growth. The use of agency staff has varied year-on-year, but there have been overall reductions, with real expenditure falling from £1.6 billion in 2003–2004 to £1.2 billion in 2007–2008. The health sector is labour intensive, accounting for around 53% of total inputs. The proportion has fallen over time, particularly as the use of intermediate inputs and capital assets has increased.
The use of intermediate inputs has increased substantially each year, this growth being evident across all major types of input. Purchases of healthcare by PCTs from non-NHS bodies have increased most markedly, accounting for £3 billion (65%) of PCT expenditure in 2003–2004 and £6 billion (72%) in 2007–2008.
There have also been increases in the use of capital over time, real expenditure increasing from £2.9 billion in 2003–2004 to £4.8 billion in 2007–2008. Increases are apparent across all capital assets. Capital accounts for around 6% of NHS inputs, a higher proportion than the 2% estimate used by the ONS (Lee, Reference Lee2006) and in line with the planned capital allocations for the NHS in the 2002 Spending Review.Footnote 9
Real expenditure on inputs for the NHS as a whole has increased from £52.5 billion in 2003–2004 to £63.8 billion in 2007–2008, a rise of 4.3% per year. The final row of Table 3 reports real expenditure on inputs utilised in the secondary and primary care sectors.
4.4 NHS productivity
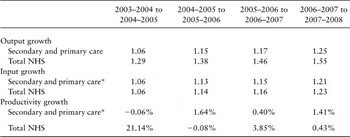
Table 7 reports indices of quality-adjusted output and input growth, taking 2003–2004 as the base year, followed by year-on-year estimates of productivity growth calculated by applying equation (1). Two sets of estimates are presented, one for the secondary and primary care sectors only and the other for the entire NHS.
Output and input growth indices (2003–2004 = 1) and productivity growth

NHS=National Health Service.
*Including primary care prescribing.
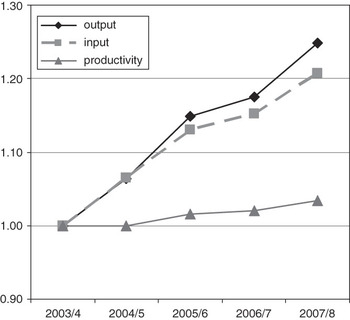
For secondary and primary care only, outputs and inputs grew at virtually the same rate between 2003–2004 and 2004–2005. Since then output growth has exceeded input growth, resulting in positive productivity growth. These three series are illustrated in Figure 2.
Growth in outputs, inputs and productivity, 2003–2004 to 2007–2008 secondary and primary care services

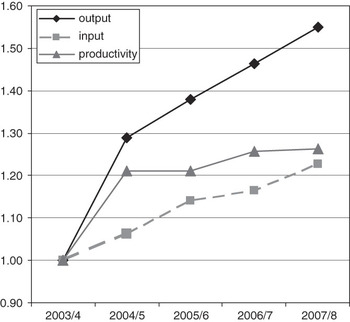
For the NHS as a whole, output growth was very strong initially, driven largely by improved data collection in the community care sector, but has levelled off in subsequent years. The rate of input growth has been more consistent over time. Figure 3 shows positive productivity growth over time.
Growth in outputs, inputs and productivity, 2003–2004 to 2007–2008 total National Health Service

Not only are more patients being treated, but the quality of care they receive has also been improving. Waiting times have been falling, both for outpatient appointments and for admission to hospital; survival rates have been improving for patients admitted to hospital whether as electives or non-electives; and improved disease management in primary care has led to reductions in blood pressure for patients suffering chronic heart disease, stroke and hypertension. Although inputs have increased over time, since 2005–2006 there has also been a slowdown in input growth, primarily the result of a levelling off in staff recruitment and less reliance on the use of agency staff. Consequently, recent productivity growth has been constant, with output growth similar to the growth in inputs.
5 Conclusions
Our indices of NHS output and input growth are designed to be comprehensive, capturing as far as possible all the activities undertaken for NHS patients by both NHS and non-NHS providers. We analyse information about every patient treated in hospital and improve on methods used to define the patient pathway in secondary care, tracking patients across providers and financial years. We use the Reference Costs returns to quantify the volumes of activity conducted in mental health and community care settings, outpatient and accident and emergency departments, diagnostic facilities and PPA data to quantify prescriptions dispensed. All these data sets are comprehensive and only for consultations in primary care do we rely on survey data. We also construct a comprehensive index of input growth, making use of financial returns from every NHS organisation. These returns also allow us to quantify the use of all inputs into production and to improve on previous estimates of capital utilisation.
We address a major practical challenge that arises in the NHS because of periodic wholesale revisions to the classification systems used to describe output categories. Reference Cost categories used to describe outputs in community care were completely re-defined after 2005–2006, the description of outpatient activities was overhauled in 2006–2007, and in 2007–2008 there was a complete revision in the way that hospital output is defined, with the move from version 3.5 to version 4 HRGs. For only primary care consultations and prescribing has there been no major re-categorisation. Despite the lack of consistency in how outputs are described, our approach allows us to construct a comprehensive index, and avoid having to make assumptions about representativeness or about how to map old and new categories.
We show that our imputation method produces very different estimates of output growth than if we calculated an index that included only those output categories that remained consistently defined across adjacent years. We contend that our estimates are more accurate because the output index remains comprehensive. This ensures that we do not need to make assumptions about whether omitted categories are representative or not.
Nor does our approach require us to map old and new categories, which can prove an onerous undertaking when there are substantial overhauls and the accuracy of the mapping cannot be verified (Casemix Service, 2008). Our approach does, however, require an assumption about how costs for each output vary over time. A general assumption could be made that the change reflects observed changes for other outputs in the sector (Cutler et al., Reference Cutler, McClellan, Newhouse and Remler2001). Alternatively, the assumption could be specific to the output in question, in just the same way that input deflators are input-specific. To apply output-specific deflation, information about the changes in cost must come from another source. One possible source is to observe how costs of the output change in subsequent periods after it has been established, and assume that the unobserved change in cost between t and t + 1 is similar to the observed change between t + 1 and t + 2. It is straightforward to assess the sensitivity of growth estimates to the use of general or specific deflators simply by substituting one for the other.
Considering productivity from 2003–2004 and 2007–2008, the NHS has treated more patients, and the quality of the care patients receive has improved. Waiting times have fallen, survival rates have improved for patients admitted to hospital, and levels of blood pressure have been reduced for patients suffering chronic heart disease, stroke and hypertension. We find that output growth, including quality improvements, between 2003–2004 and 2007–2008 for the NHS as a whole averages 11.3% per year. However, this estimate is contaminated by extended coverage of the Reference Costs collection. A more conservative estimate, based on the secondary and primary care sectors only, reveals that output growth has averaged 5.7% per annum. Improvements in quality have contributed 0.8% to annual output growth.
Inputs have increased over time. The volume of intermediate inputs and capital has increased year on year. Growth in labour input has varied over this time: after an initial increase in the number of staff recruited into the NHS, numbers began to level off after 2005–2006 and less reliance was made of agency staff. We conclude that between 2003–2004 and 2007–2008, growth in inputs is matched by growth in outputs. This suggests that the NHS is operating under constant returns: we get out what we put in.
Acknowledgements
Thanks are due to Mark Chandler, Keith Derbyshire, Warren Goldthorpe, Hugh Gravelle, Katherine Mills, Rob Unsworth, Panos Zerdevas and to the journal’s reviewers for their insightful comments. The project was funded by the Department of Health in England as part of a programme of policy research at the Centre for Health Economics, University of York. The views expressed are those of the authors and may not reflect those of the funder.