1. INTRODUCTION
Accurate positioning is essential for smartphone users. The positioning solution of the smartphone is mainly determined by a low-cost built-in global navigation satellite system (GNSS) receiver. With differential GNSS correction, the smartphone can achieve positioning solutions within one to two metres of error in open areas. However, urban areas are still a challenging environment for the majority of smartphone users, usually suffering positioning errors of dozens of metres (Dabove and Petovello, Reference Dabove and Petovello2014; Pesyna et al., Reference Pesyna, Heath and Humphreys2014). In urban areas, the GNSS signal can be blocked or reflected by building surfaces. Hence, both the direct signal and reflected signal, or only the reflected signal, may be received. These are termed multipath and non-light-of-sight (NLOS) reception, respectively (Groves, Reference Groves2013). The extra travelling distance of the reflected signal can further introduce a large error during positioning, possibly exceeding 50 m, being the major source of error in GNSS urban positioning, especially in deep urban canyons (Hsu, Reference Hsu2018).
Since the smartphone can intelligently determine the environment class in which it is located, a specific algorithm for GNSS-challenged environments should be developed (Gao and Groves, Reference Gao and Groves2018). To improve the urban positioning accuracy of GNSS, researchers have focused on the exclusion of NLOS affected measurements. The consistency-check method (Groves and Jiang, Reference Groves and Jiang2013) is used to detect and isolate unhealthy pseudorange measurements, achieving a satisfactory positioning result. However, the performance may be degraded in a dense urban scenario with severe NLOS reception. Multiple NLOS receptions as the outliers may lead to fault consistency issues, degrading the correctness of fault detection and exclusion (Hsu et al., Reference Hsu, Tokura, Kubo, Gu and Kamijo2017). A method using a sky-pointing fish-eye camera to detect the NLOS signal by image recognition (Suzuki and Kubo, Reference Suzuki and Kubo2014; Moreau et al., Reference Moreau, Ambellouis and Ruichek2017) has also been introduced. Another approach is using three-dimensional (3D) light detection and ranging (LiDAR), whereby NLOS signals can be detected (Wen et al., Reference Wen, Zhang and Hsu2018b) and corrected based on scanned surrounding building distance and NLOS propagation model (Wen et al., Reference Wen, Zhang and Hsu2018a, Reference Wen, Zhang and Hsu2018b). This requires extra equipment and power consumption, however, which is not practical for hand-held devices.
To prevent adding extra equipment and to make use of all the received measurements, 3D mapping aided (3DMA) GNSS positioning algorithms, such as NLOS-excluded positioning (Obst et al., Reference Obst, Bauer and Wanielik2012), shadow matching (Groves, Reference Groves2011; Wang et al., Reference Wang, Groves and Ziebart2013) and ray-tracing (Miura et al., Reference Miura, Hsu and Chen2015; Hsu et al., Reference Hsu, Hu and Kamijo2016a), have been proposed to improve the positioning in dense urban areas. Shadow matching uses the building boundaries (Wang et al., Reference Wang, Groves and Ziebart2012) – the highest elevation angle of the surrounding building on each azimuth angle – from the 3D city model and the position of the satellite from the ephemeris to predict the satellite visibility of a specific location. Therefore, the user's position can be determined by the candidate location with a satellite visibility best matching the measurements. This can effectively improve positioning accuracy in the across-street direction, however, it is less effective for the along-street direction, due to the similarity of building geometry (Adjrad and Groves, Reference Adjrad and Groves2018a). As shadow matching only provides a partial solution, a likelihood-based 3DMA GNSS ranging method has been demonstrated to focus on the use of measurements on the along-street direction (Groves and Adjrad, Reference Groves and Adjrad2017). With their complementary characteristics, the integration of the likelihood-based 3DMA GNSS and GNSS shadow matching was proposed by Adjrad and Groves (Reference Adjrad and Groves2018a). Recently, the implementation of the integrated method has been tested on an Android device (Adjrad and Groves, Reference Adjrad and Groves2018b). To improve the positioning solution in both along-street and across-street directions, the University College London (UCL) integrated solution was introduced. The entire scope of works with performance analysis is presented in Groves and Adjrad (Reference Groves and Adjrad2019) and Adjrad et al. (Reference Adjrad, Groves, Quick and Ellul2019). One idea is not only to detect the NLOS measurement but also correct it. Ray-tracing based 3DMA GNSS positioning algorithms were developed to detect and correct the reflected signal from NLOS and multipath propagation. This method traces the possible transmission route of both direct and reflected GNSS signals based on 3D building models. Hence, the pseudorange error from reflection can be simulated and further corrected to improve positioning accuracy. This approach can estimate the NLOS reception error precisely for correction, providing a positioning accuracy within about 10 m or less (Miura et al., Reference Miura, Hsu and Chen2015). With NLOS correction, affected measurements become useful for positioning, which gives a better dilution of precision and sufficient amount of measurements even in dense urban environments. The integration of 3DMA GNSS with inertial sensors for pedestrian and vehicle applications was introduced by Suzuki and Kubo (Reference Suzuki and Kubo2013), Hsu et al. (Reference Hsu, Gu, Huang and Kamijo2016b) and Gu et al. (Reference Gu, Hsu and Kamijo2016), respectively. However, the ray-tracing algorithm requires a high computational load since it performs the comparison between simulated pseudorange and measurements (Ziedan, Reference Ziedan2017). These criteria lead to the need for a high-performance computing platform to apply this algorithm, which is not feasible for real-time positioning by a smartphone. As a result, the challenge remains to perform an accurate positioning method without intensive computational load. For the ray-tracing approach, numbers of candidates are initially distributed around. The transmission path of each signal is then simulated on every surface at each candidate, which is computationally expensive. Furthermore, the positioning performance also depends on the level of detail of the 3D building model (Biljecki et al., Reference Biljecki, Ledoux, Stoter and Zhao2014), and consideration of multiple reflections.
This paper develops a new 3DMA GNSS positioning method based on the enhanced skymask, which includes the building boundaries as well as building height information to provide the NLOS corrections. The details will be described in Section 3.2. The main contributions of the proposed 3DMA GNSS method are: (1) reducing the computational load while maintaining similar performance to the ray-tracing algorithm, within 5 m extra positioning error compared with ray-tracing; and (2) using the same format of building boundary used in GNSS shadow matching to correct NLOS measurements. The proposed method is a position hypothesis based estimation method. To estimate the NLOS pseudorange delay in each hypothesised position, we propose to use the characteristic of perfect reflection where the incidence angle is identical with the reflection angle. The elevation angle of the reflecting point is equal to that of the satellite. The reflecting surface is parallel to the direction of travel, and the azimuth of the reflecting point position with respect to the direction of travel is equal and opposite to the azimuth of the satellite with respect to the direction of travel. Here, we named it the azimuth angle of the reflecting plane (AARP), as shown in Figure 5. Therefore, innovatively, based on the enhanced skymask and the satellite's position, we can determine the reflecting plane direction AARP and predict the incoming signal direction. With the building height from the enhanced skymask, the exact coordinates of the reflecting point can be further obtained. With the characteristic of NLOS signal transmission and reflected by the reflector, this assumption avoids searching for the appropriate reflection point on each building surface, which significantly decreases the computational requirements compared with ray-tracing based 3DMA GNSS. This simplification still maintains the accuracy of reflected signal simulation regarding the conventional approach. To conclude, the proposed simplified ray-tracing NLOS correction algorithm is applicable for smartphones achieving a real-time accurate positioning solution in dense urban environments with the presence of many unhealthy measurements.
The preliminary result is reported in Ng et al. (Reference Ng, Zhang and Hsu2019). However, in the previous work, the parallel direction in azimuth angle (from north) of the reflecting planes, as the AARP in Section 3.2, of the surrounded building surfaces were labelled manually. We further propose a new algorithm to identify different surfaces in the skymask. As a result, the proposed method can be tested in more complicated building distribution environments compared with that in Ng et al. (Reference Ng, Zhang and Hsu2019).
2. OVERVIEW OF THE PROPOSED 3DMA GNSS ALGORITHM
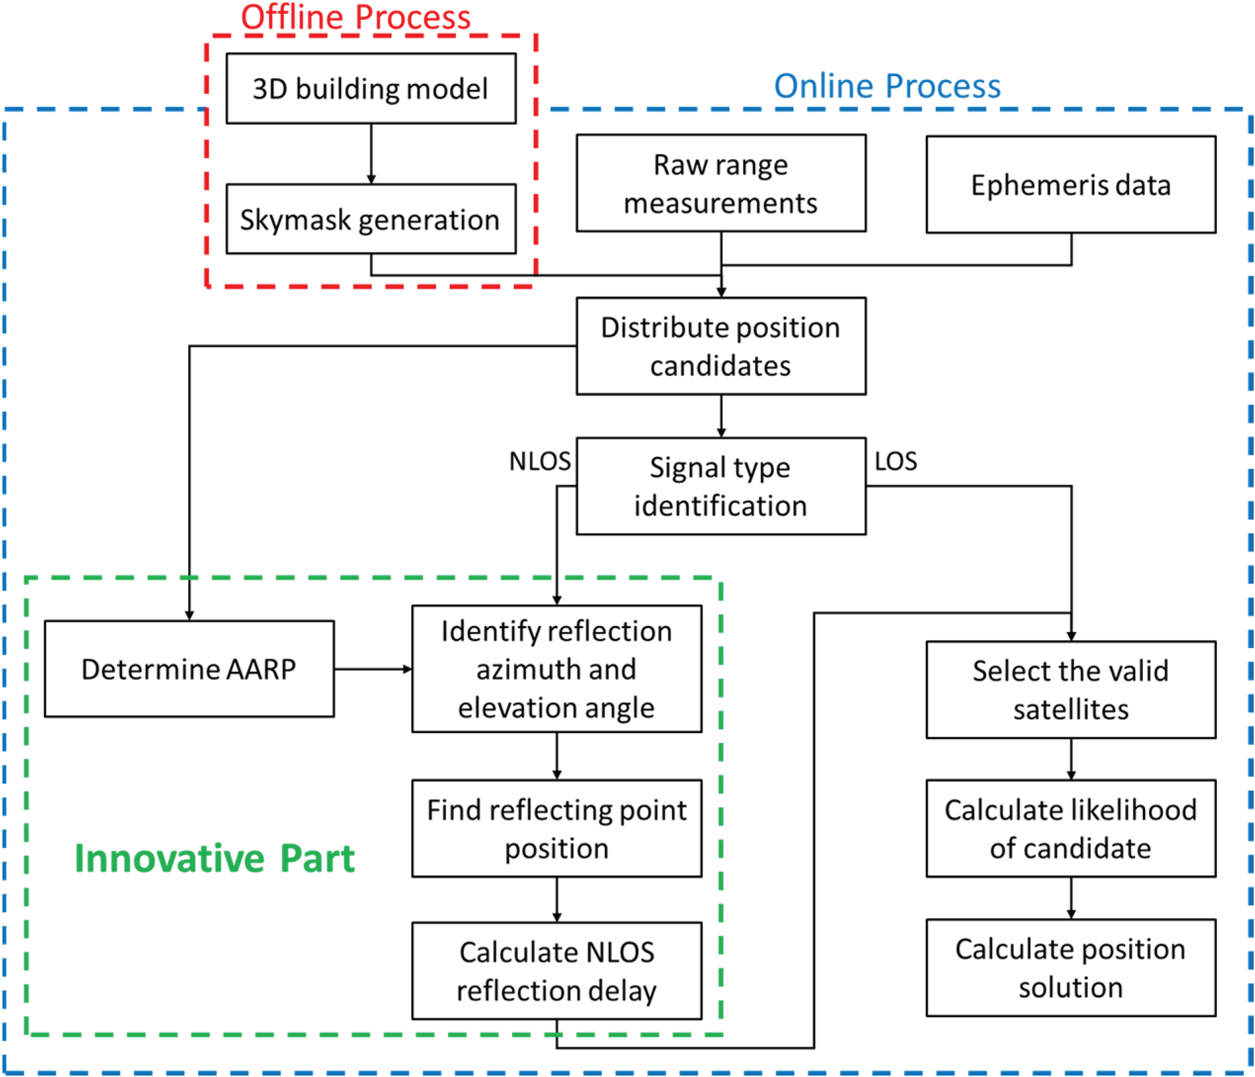
Figure 1 shows the flowchart of the proposed algorithm. The algorithm can be divided into two main parts: offline and online processes. The offline process is pre-computed on the server while the online process is processed by the receiver after receiving the GNSS measurements.
Flowchart of the proposed range-based 3DMA GNSS algorithm.

The offline process is to generate the building boundaries on a skyplot, termed ‘enhanced skymask’ in this paper. The skymasks are stored in a specific format in the receiver with resolution of one degree for azimuth angle; the elevation angle is 0·1 degree. For practical implementation, the skymasks can be downloaded from the server from time to time to reduce the storage requirements for storing skymasks for a wide area. For the online process, position candidates are distributed evenly around an initial position. For each candidate, the AARP will be found on each corresponding azimuth angle by the candidate's skymask and feature points. The AARP value on each azimuth means the parallel direction of the surrounding building surface, also known as a possible surface for reflection to occur, on the corresponding azimuth. This value is used to predict the azimuth angle and will be explained in Section 3.2. Meanwhile, for each candidate position, satellites are placed on the skymask to identify whether it will be blocked by the building. For the NLOS measurements, the possible reflecting point can be found based on the azimuth and elevation angle relationship between the receiver and satellite, and the law of reflection. The detailed processes to identify the reflecting point are stated on Section 3.2. Therefore, the reflection delay can be estimated and used to correct the NLOS measurement. After that, if the type of measurement is agreed by both skymask classification and signal strength classification, it is identified as a valid measurement for the candidate, as shown in Table 1. The simulated pseudorange is calculated for each valid satellite on each candidate. The similarity between measured and simulated pseudorange is then compared. A scoring scheme based on the average of pseudorange difference on each candidate is applied to score the candidate. A higher score is given to the candidate position with a greater similarity between measured and simulated pseudorange. Finally, the solution is estimated by weighted averaging the scored position candidates.
Signal classification rule based on machine learning classification and enhanced skymask prediction.

3. ALGORITHM DESCRIPTION
The algorithm description can be divided into three main parts: skymask generation, reflecting point detection, and positioning with simulated range.
3.1. Skymask generation
In the offline stage, the building boundaries are projected on the skyplot, termed ‘skymask’ in this paper. If the satellite elevation is lower than the building boundary elevation (under the same azimuth angle), the signal is assumed to be the NLOS signal blocked by buildings.
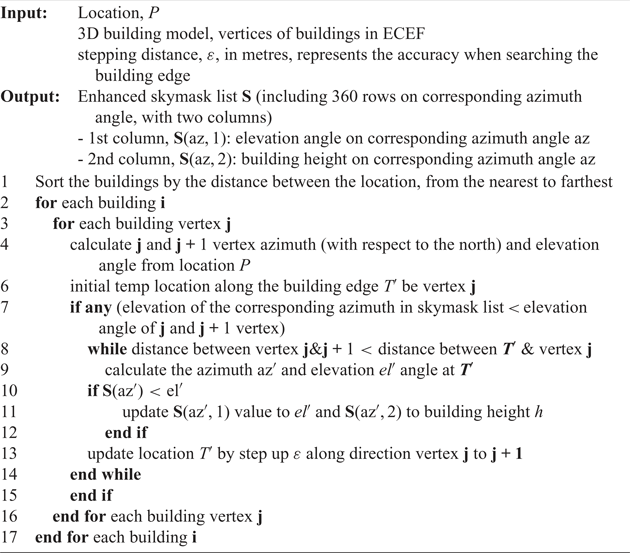
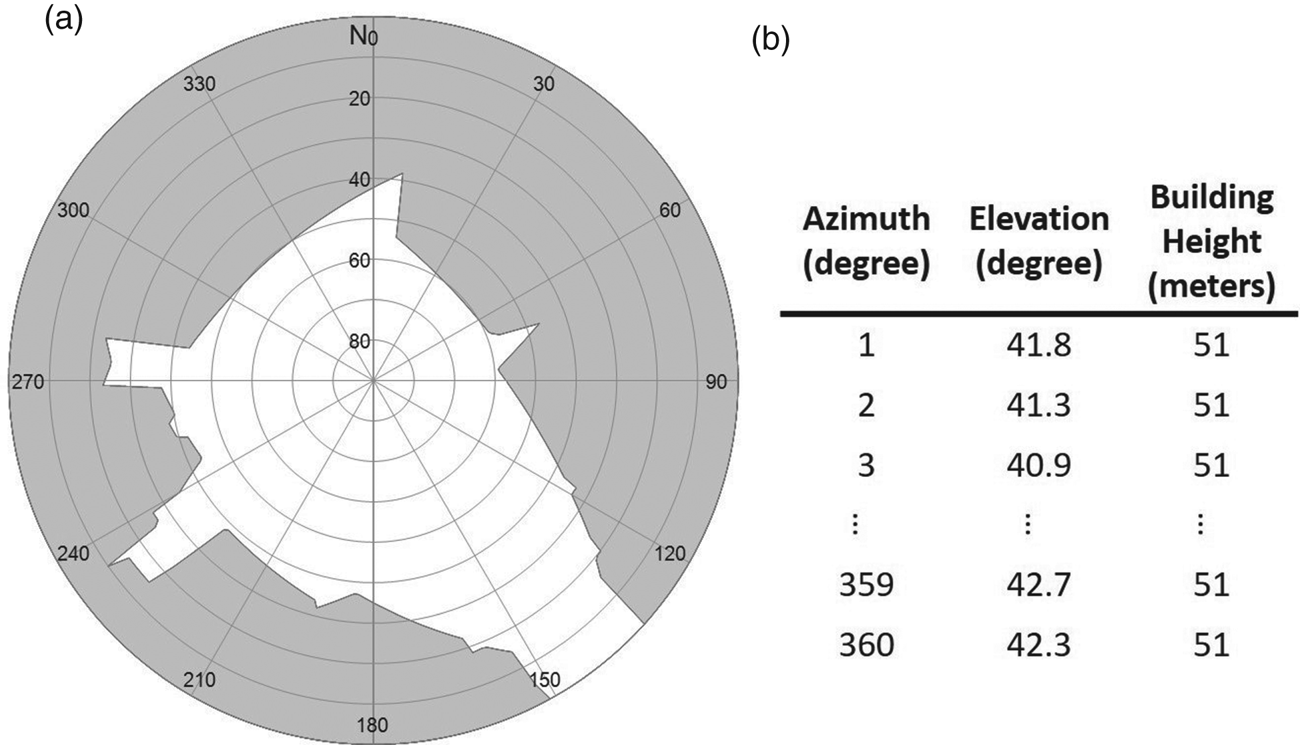
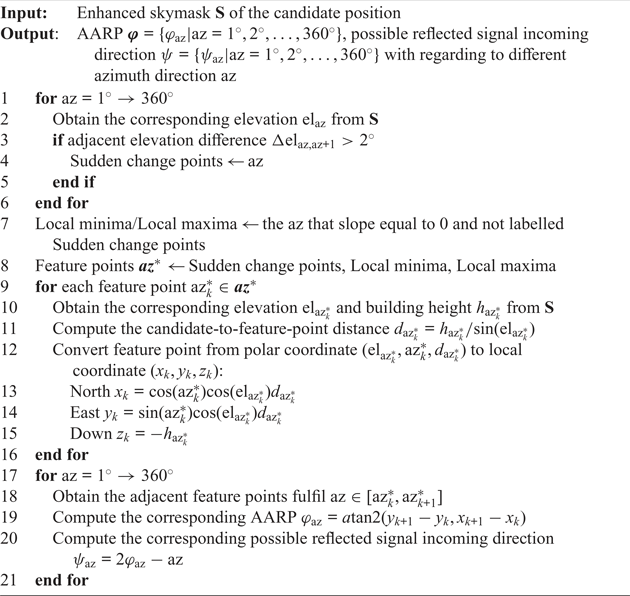
The skymask of each location is generated with the 3D city model offline, as shown in Algorithm 1. Thus, the skymask can be initially stored in the device. Based on the 3D building model or in storage perspective, a specific area is selected and divided into grid points to construct the skymask table; the grid point separation is 2 m to generate the skymask. Here, an assumption is made that the candidate is always on the ground (mean sea level). Therefore, in this study, the height of the skymask position is given by the mean sea level datum provided by the Hong Kong Lands Department (Survey and Mapping Office, 1995). Figure 2 is an example of the generated skymask and storage format. The azimuth is in one-degree resolution; the elevation is in 0·1-degree resolution; and the building height is in one-metre resolution. The azimuth angle starts from the north direction, rotating in a clockwise direction; the elevation angle starts from the horizon as zero degrees.
Skymask generation on a specific location

Example of skymask (a) and skymask array (b).
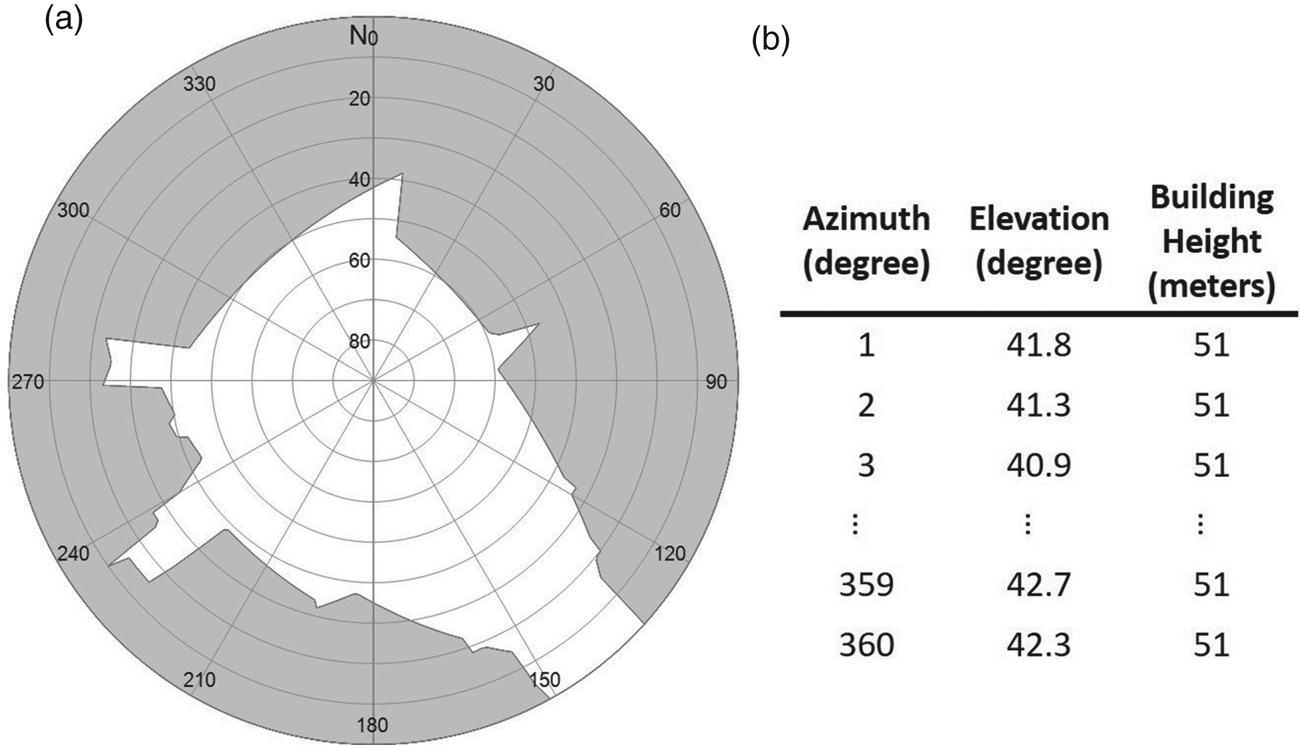
Each location will first be classified as to whether it is inside the building. For the ‘outside building’ location, a matrix of 360-by-2 will be used to store the skymask for single location, first column store the maximum elevation angle of the building edge for the corresponding azimuth angle; second column store the building height on the corresponding azimuth angle, as shown in Figure 2, for later use to find the valid reflecting point. For the ‘inside building’ location, a flag will be given to represent this is a building.
This offline generation perspective is especially important for a low-cost device with limited computational power, as it is nearly impossible for such devices to generate the skymask every time in both time consumption and power management aspects. This step is similar to the process proposed in Wang et al. (Reference Wang, Groves and Ziebart2012), but the enhanced skymask includes the building height information associated with each azimuth angle for NLOS correction usage.
3.2. Detection of reflecting points on skymask
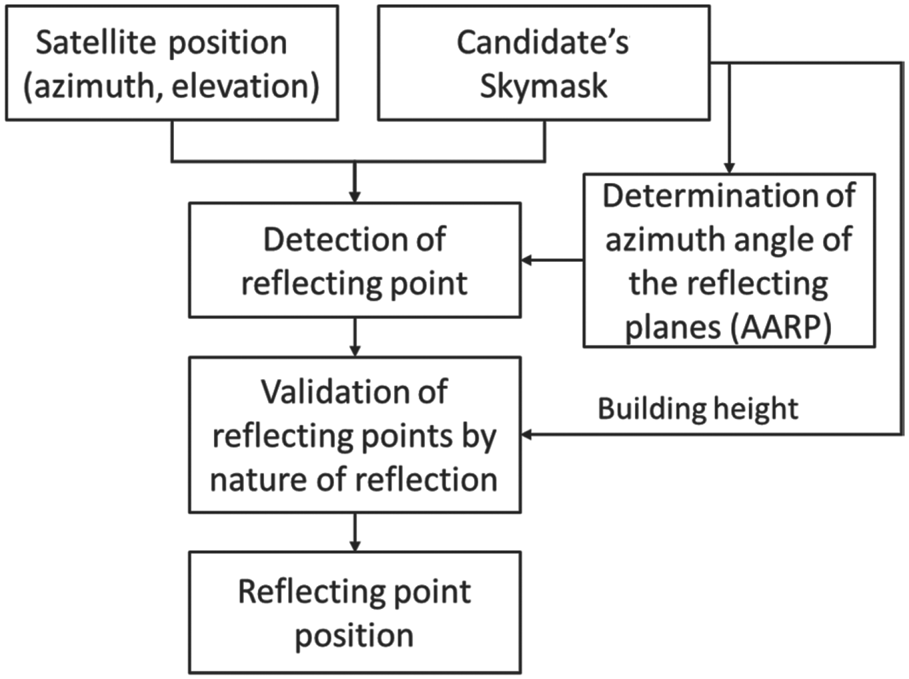
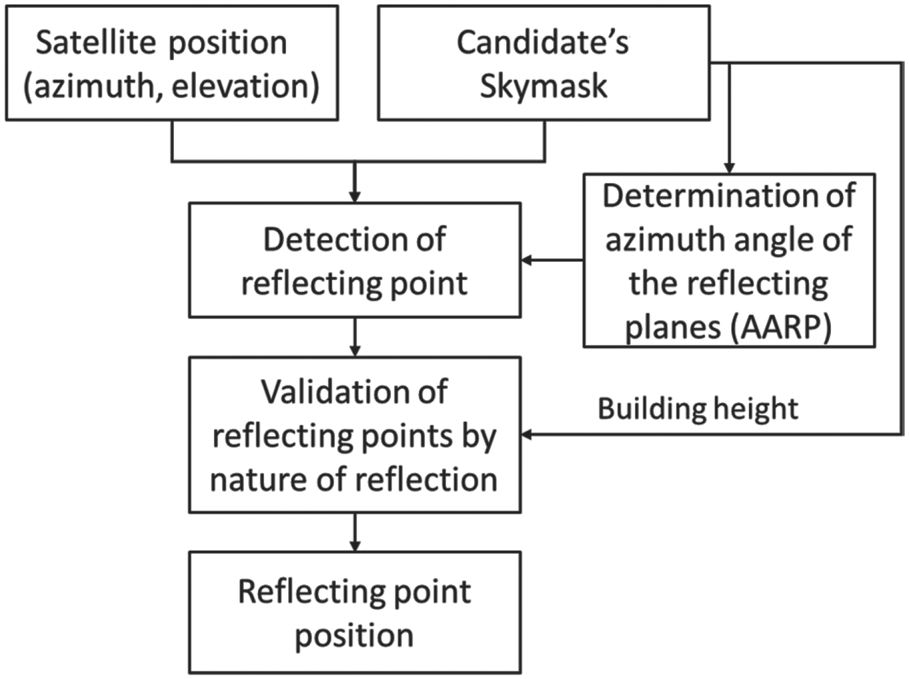
In the real-time positioning, theoretically, an initial position is first given by single point positioning at each epoch to distribute positioning candidates around. To provide a more sophisticated initial solution, the National Marine Electronics Association (NMEA) position provided by the receiver will be used in this paper. A grid of searching area with 40 m radius and 2 m separation between adjacent candidates will be constructed. Since the skymask information is pre-computed based on grids, distributing the candidate in the same grids makes it feasible to load the corresponding skymask information directly and avoids applying interpolation. If the candidate is distributed inside the building, it will not calculate its likelihood. The satellites are then projected onto the skyplot of each candidate based on their position estimated using ephemeris data, as well as loading the corresponding skymask. As a result, the satellites can be classified into LOS and NLOS from the candidate skymask. Figure 3 shows the flow to determine the reflecting point from the skymask for the NLOS satellite.
Flowchart of reflecting point detection.
With the skymask information of the candidate, we should determine the AARP value on each surrounding building surface, as shown in Algorithm 2. The geometric meaning is the parallel direction of the building surface where the reflection occurs. The AARP value, φ, is the building surface's parallel direction in azimuth angle with respect to north in the clockwise direction, as shown in Figure 5. Note that determination of the AARP value can be processed in the offline stage by the server or in the online stage by the receiver. The advantage of processing by the server when generating the skymask is that it can obtain the AARP value directly from the 3D building model. The advantage of online calculation is that it can reduce the storage required on the receiver, as the AARP value on each grid needs to be stored with the skymask if calculated offline.
AARP-based possible reflected signal incoming direction prediction

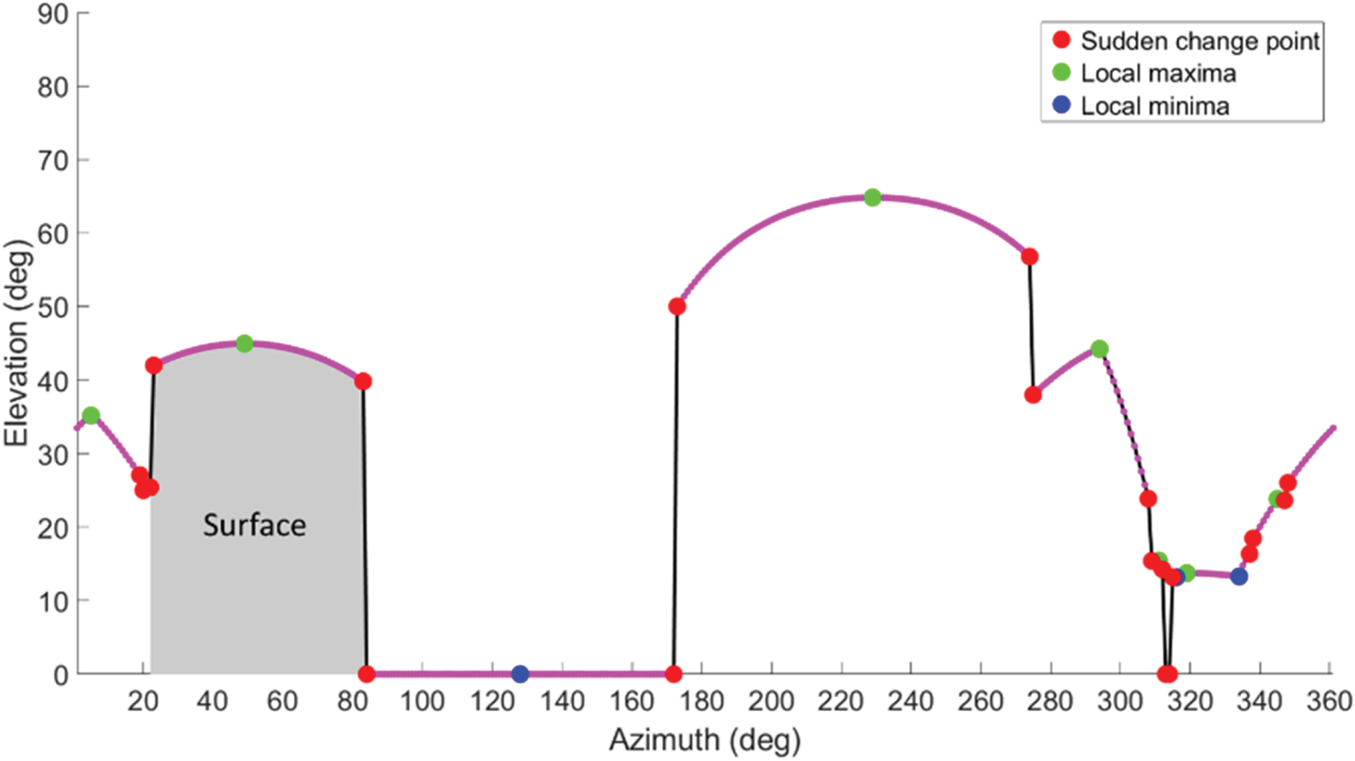
Unlike the 3D building model used in the ray-tracing 3DMA GNSS (Hsu et al., Reference Hsu, Hu and Kamijo2016a), surrounding buildings are mixed together in the skymask and are not separable. Thus, it is important to identify the individual building surface since each surface may have a different AARP. The building boundary on the skymask can be illustrated as a curve with respect to the elevation and azimuth, as in Figure 4. As shown in Figure 5, the corresponding AARP needs to be identified to estimate the valid reflecting point for a different building.
Plot of skymask (Figure 5(b)) in elevation-azimuth format and determined feature points. Red, green and blue points are feature points; purple lines represent valid surface; black lines are invalid surface; grey shadowed area is the blue surface in Figure 5.

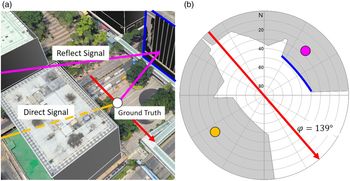
Actual position (a) and polar position projected on skymask (b). Red arrow is the AARP for the blue surface that causes reflection and φ is the axis direction angle; orange line is the direct path blocked by building; purple line is the reflecting path. Orange and purple points on the skymask represent the signal incoming azimuth and elevation angle of the direct and reflected path, respectively.

Two features from the skymask curve are extracted to determine the corresponding AARP of the potential reflection surface. The first feature is the sudden changing point, corresponding to the building boundary points with over two degrees of elevation angle difference between two adjacent points. The curve between two sudden changing points indicates the transition to different buildings, which is invalid for signal reflection. The skymask curve with small change (less than two degrees) represents a valid surface for signal reflection. The second feature is the local minima or maxima within the valid curve. The feature points could be representing the different visible surface from the candidate.
This is followed by identifying the valid surface and its orientation from the skymask. As mentioned above, the feature points represent the building corners. Therefore, the azimuth angles between two consecutive feature points will be considered as one surface. In two exceptional cases, if two adjacent azimuth angles (e.g., az and az+1) are sudden change points, it means this change to another building and surface should exist, and it will not be considered as a surface. Another such situation is the elevation of zero degrees, as there is assumed to be no valid reflector on the ground.
After obtaining the feature points including sudden change points, local minima and local maxima, the AARP on each azimuth angle is computed by two adjacent feature points. The possible reflected signal incoming direction ψaz regarding the building surface on different azimuth direction az can then be computed with step 20 in Algorithm 2. Therefore, for a specific satellite i, the corresponding signal reflecting point azimuth can be obtained by matching the known satellite azimuth azi with the predicted possible reflected signal incoming direction, as follows
 $${\rm az}_{{\rm Refl}}^i =\mathop{\arg\,\min}\limits_{{\rm az}\in \{ {1^{\circ}, 2^{\circ}, \ldots , 360^{\circ}}\}} ( {\psi_{{\rm az}} -{\rm az}^i} ) $$
Note that if no existing ψaz fulfils  $\vert {\psi_{{\rm az}} -{\rm az}^{i}}\vert \lt1^{\circ}$ for a satellite at a candidate, no valid reflecting signal can be found for this satellite on this candidate position.
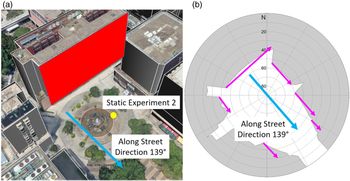
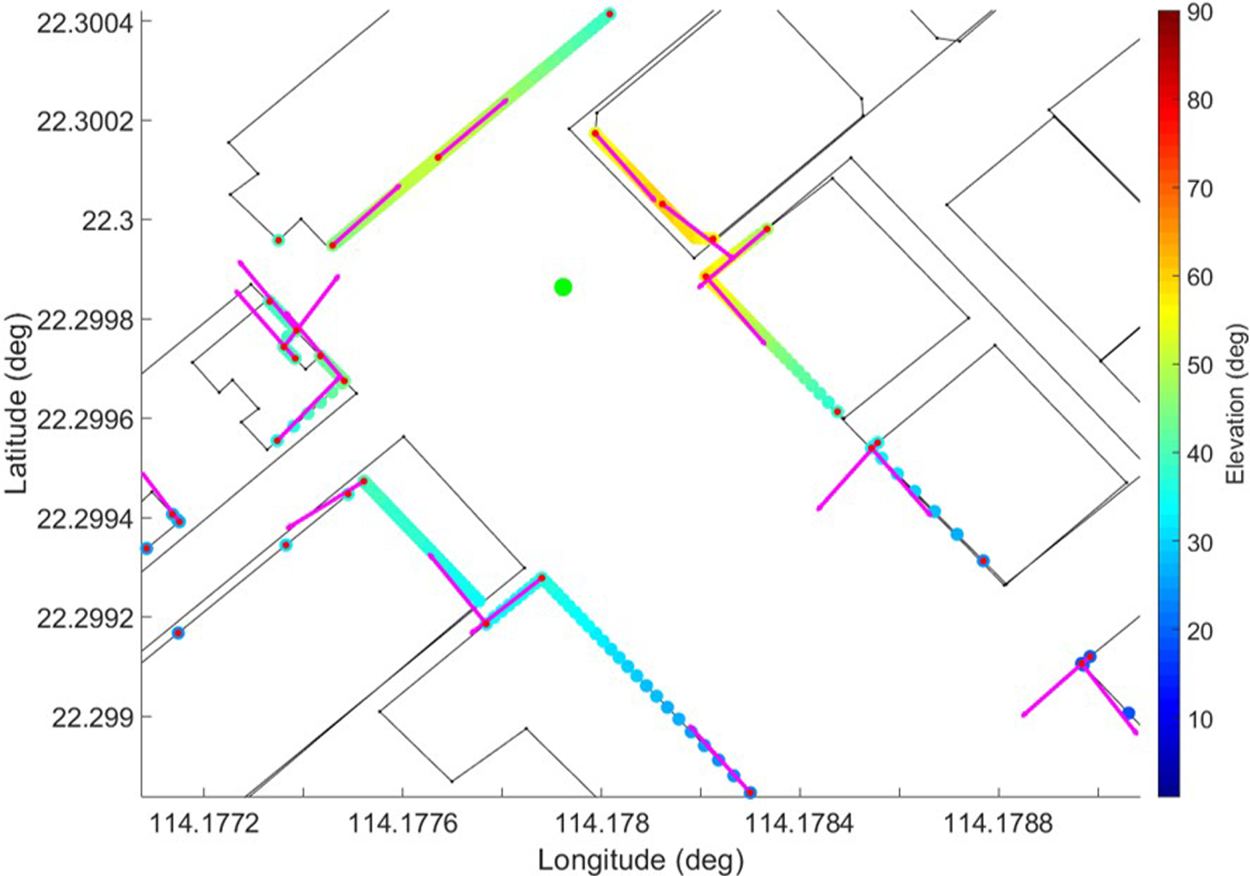
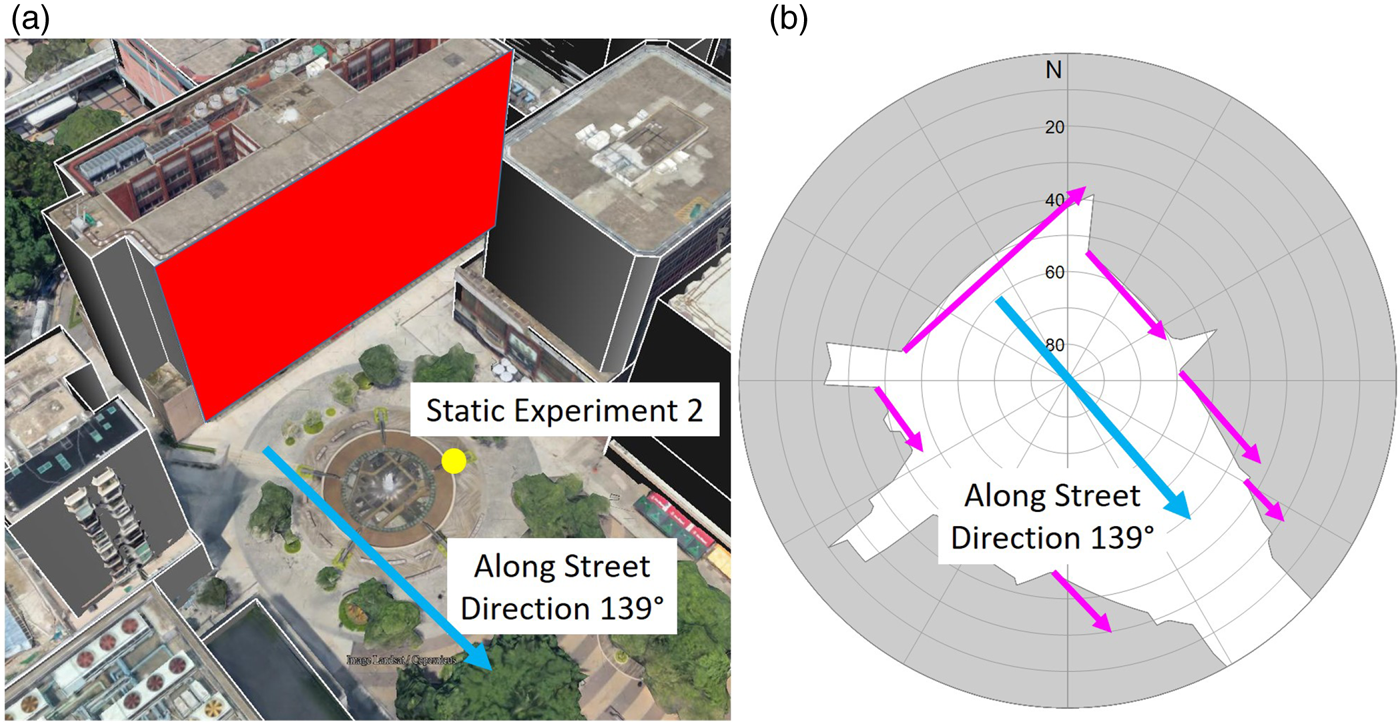
The AARP determination algorithm aims to provide a more accurate possible reflection surface determination based on skymask; the results can be illustrated using Figures 6 and 7. In the Figure 6 environment, the orientation of the red surface is different from other surfaces. The actual AARP of surrounding surfaces are expressed with purple arrows in Figure 6. The purple arrows in Figure 7 show the AARP determined by our proposed algorithm. From the results, the algorithm can identify the correct AARP of the surrounding surface, as well as some small visible surface from the location's skymask.
Complex environment (a) with multiple axis directions and corresponding skymask (b). Blue arrow is the along-street direction; purple arrows are the surrounding visible surface AARP; the red curve in (a) represents the red surface in (b).
Demonstration of the result by the proposed AARP algorithm. Green point is the ground truth location in Figure 6; black solid line is the building contour; colour points are the location used on the skymask, the colour represents the elevation angle; purple arrows represent the AARP vector determined by propose algorithm.

As indicated in Hsu (Reference Hsu2018), NLOS delay can be modelled with elevation angle and lateral distance from the receiver to the reflector. Therefore, after determining the AARP and predicting the incoming signal direction with the candidate's skymask, we can detect the reflecting point and output actual position.
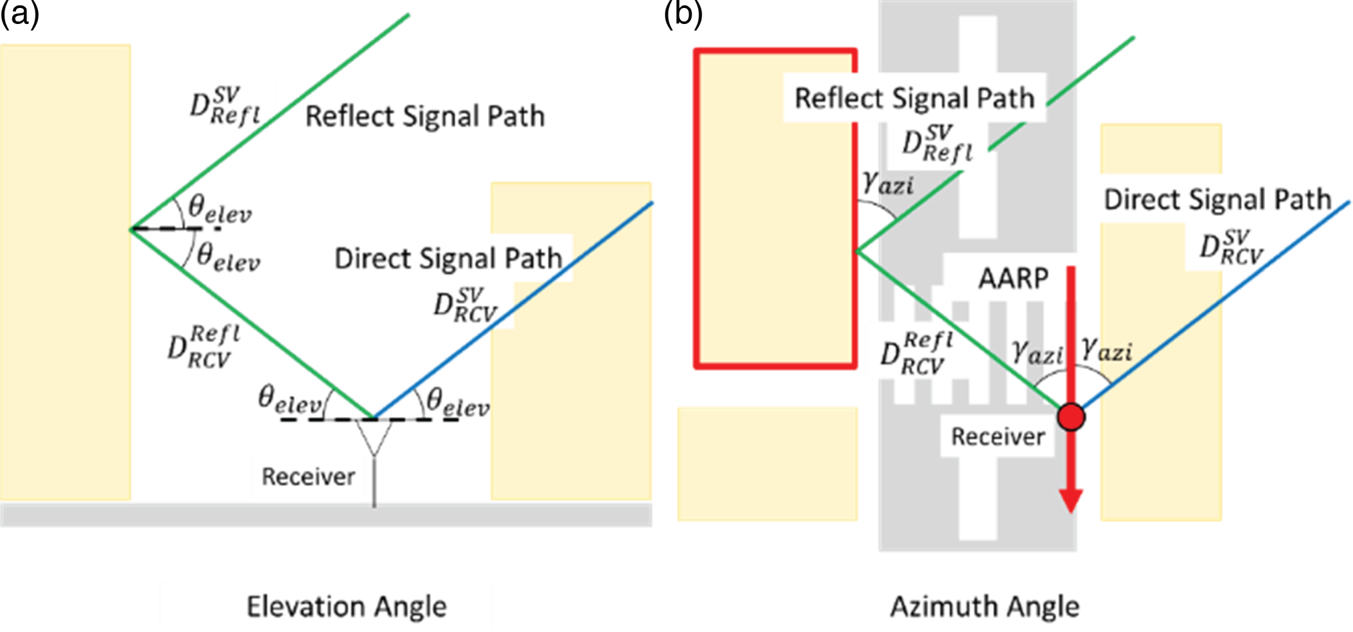
Before detecting the reflecting point from the AARP found in the above step, we need to know the angular relationship between the receiver, satellite position and AARP. As shown in Figure 8(a), the satellite elevation at the receiver is the same as at the reflecting point provided that the reflecting surface is vertical, since the satellite is far away from the reflecting point and receiver. With the law of reflection, the incident angle is equal to the reflection angle which is the elevation angle of the reflecting point, as θelev. On the other hand, on the view above from the receiver, as shown in Figure 8(b), an AARP is defined as parallel to the building surface that reflects the NLOS signal. Since the satellite is far away from the receiver and the reflecting point, the incident reflected signal (from satellite to reflected plane) is parallel to the direct signal, the angle between reflected plane and incident reflected signal (or 90°-incident angle) equals the azimuth angle between the AARP and the direct signal, as γazi. Due to pure reflection behaviour, the incident angle is equal to the reflection angle, which is also equal to the azimuth angle between the reflecting point and the AARP (which is parallel to the reflecting surface). Therefore, the location of the reflecting point can be estimated by the satellite elevation and azimuth angles with respect to the receiver in the skymask. As Figure 5 shows, based on the preceding relationship, the valid reflecting point (purple point) of the GNSS signal on the building surface can be determined symmetrically to the satellite position (orange point) on the skymask with respect to the AARP.
(a) side view to demonstrate the angular relationship between the direct and reflected signal on elevation; (b) top view to demonstrate the azimuth angle relationship. Green and blue line represent reflect and direct path respectively; red arrow is the AARP of reflection causing surface (red framed building).

Finally, the horizontal distance from candidate to building height on the corresponding reflecting point's azimuth can be resolved by building height and elevation angle to the building edge. By further combining with the azimuth and elevation angle of the reflecting point, the actual position of the reflecting point can be obtained by converting from local coordinates to Earth-Centered, Earth-Fixed (ECEF) using the standard coordinate transformation matrix.
As well as the reflection delay of i-th satellite on n-th candidate,  $\varepsilon _{n}^{{\rm refl}( i) }$, is calculated by the total geometric distance of the reflect path (1. Satellite to reflecting point,
 $D_{{\rm Refl}}^{{\rm SV}}$; and 2. Reflecting point to the receiver,
 $D_{{\rm RCV}}^{{\rm Refl}} ) $ then subtract the geometric distance of direct LOS path,
 $D_{{\rm RCV}}^{{\rm SV}}$.
 $$\varepsilon _n^{{\rm refl}(i)} =D_{{\rm Refl}}^{{\rm SV}} +D_{{\rm RCV}}^{{\rm Ref}l} -D_{{\rm RCV}}^{{\rm SV}}$$
3.3. Simulated range calculation
To evaluate the likelihood of the position candidates, the difference between pseudorange measurement ρ̃ and simulated range ρ̂ on each position candidate is required. The simulated range  $\hat{\rho}_{n}^{i}$ between the i-th satellite and the n-th position candidate can be calculated by the sum of the geometric distance
 $R_{n}^{i} $, correction for satellite clock and orbit offset,
 $c\delta t_{i}^{{\rm sv}}$, ionosphere errors (using the Klobuchar model (Klobuchar, Reference Klobuchar1987)), I i, and troposphere errors, T i and reflection delay distance,
 $\varepsilon _{n}^{{\rm refl}( i) }$ found in Section 3.2 if applicable, as follows,
 $$\hat{\rho}_n^i=R_n^i c\delta t_i^{{\rm sv}}+I^i+T^i\varepsilon _n^{{\rm refl}(i)}$$
To eliminate the receiver clock offset, a reference satellite will be selected. All measurements and simulated ranges are differenced once to obtain the single difference of the ranges on each candidate. The reference satellite r(i) is selected by the LOS satellite with the highest elevation angle for each constellation on each candidate. Note that inter-constellation timing bias could be obtained from the broadcast navigation message. In that case, we can consider all the measurements are from the same constellation.
 $$D_n^i =|(\tilde{\rho}_n^i-\tilde{\rho}_n^{r(i)})-(\hat{\rho}_n^i-\hat{\rho}_i^{r(i)})|$$
The similarity of the candidate αn is calculated by averaging the single difference range  $D_{n}^{i}$. Table 1 shows the rule of signal type classification; the measurements can be classified into LOS and NLOS by the machine learning suggested by Sun et al. (Reference Sun, Hsu, Xue, Zhang and Ochieng2018) and the prediction of the enhanced skymask. This classification applies to each candidate and measurement individually. If and only if the satellite visibility is consistent between the proposed method and signal strength classification, the corresponding measurement will be included in the candidate score calculation; the N sim denotes the number of valid range differences. Note that if the reference satellite is the only satellite that agrees on signal type, this candidate will not be scored and will be labelled as invalid.
 $$\alpha^n=N_{{\rm sim}}^{-1} \times \sum_i^{N_{{\rm sim}}}{D_n^i }$$
The average of range difference will then rescale between 0 to 1 to become the score of the candidates. The smaller the value of the average of the range differences, the higher the score; in other words, the simulated range is a better match with the measurement.
 $$\mbox{score}^n=\frac{\max ( \alpha ) -\alpha ^n}{\max ( \alpha ) -\min ( \alpha ) }$$
The final step is to determine the position solution of the skymask 3DMA algorithm. All the candidates' scores are then used to calculate the weighted average position. As a result, the positioning solution can be obtained and the positioning solution will apply the height information from the pre-computed skymask grid point information.
 $$x( t ) =\frac{\sum_n {( {\mbox{score}^n( t ) P^n( t ) } ) } }{\sum_n {\mbox{score}^n( t ) } }$$
4. EXPERIMENT RESULTS AND ANALYSIS
To evaluate the performance of the proposed algorithm, experimental data were collected in urban canyons in Hong Kong and post-processed. The experiments involved both a ‘tidy’ environment with few AARP directions and a complex environment with multiple axes.
4.1. Experiment setup
A commercial-grade GNSS receiver (u-blox EVK-M8T with u-blox ANN-MS patch antenna) was used to record raw measurements. The output rate of the receiver was set at 1 Hz. The constellations on single-frequency GPS and BeiDou satellite were enabled. The second static experiment also included measurements recorded by Xiaomi Mi 8. The results of the experiments were then post-processed, and the positioning results using the following algorithms were compared:
1. WLS: weighted least square (Realini and Reguzzoni, Reference Realini and Reguzzoni2013)
2. RT: ray-tracing based 3DMA GNSS (Hsu et al., Reference Hsu, Hu and Kamijo2016a)
3. SKY: skymask based 3DMA GNSS, the method proposed in this paper
Both the ray-tracing algorithm and the proposed skymask based 3DMA GNSS consider only the single reflection, and provide correction only for reflection-found NLOS signals. The difference between the proposed method and the ray-tracing algorithm is that the former uses the skymask to obtain the NLOS correction. Therefore, we can evaluate the accuracy of the proposed method by comparison with ray-tracing.
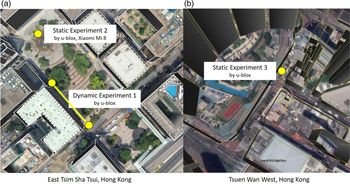
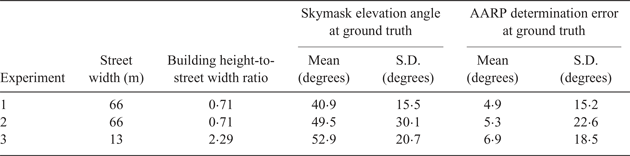
The experiments were conducted in two urban areas of Hong Kong. The dynamic experiment and one static experiment (experiments 1 and 2) were conducted in Tsim Sha Tsui, (TST); and the second static experiment (experiment 3) was conducted in Tsuen Wan (TW), as shown in Figure 9. The referencing ground truth of each experiment is manually labelled based on Google Earth. The walking velocity of the dynamic experiment was assumed to be uniform, so ground truth is given by interpolating between starting point and destination with the total experiment time. The dynamic experiments took 69 s with about 70 m walking distance while the static experiments took 2 min (120 epochs). The experimental environment can be described as shown in Table 2. In terms of the proposed axis determination method, the environment of experiment 1 is relatively simple compared with that of experiment 3.
Experiment locations: (a) Tsim Sha Tsui (b) Tsuen Wan, Hong Kong.

Experiment environment.
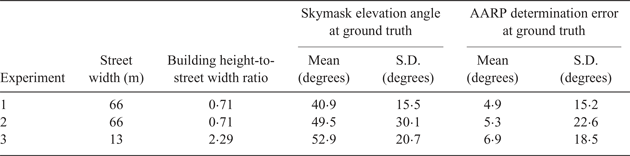
Note that the ratio of building height to street width is calculated by building height/street width, which means that the value is higher when the street is narrower with taller buildings surrounding it and the experiment environment is more challenging for positioning. The ‘AARP determination error at ground truth’ was evaluated by comparing the AARP derived from the proposed method in Section 3.2 with the AARP obtained from the 3D building model in Google Earth, and further demonstrated by mean value and standard deviation of the difference between all azimuth angles.
4.2. NLOS reflection detection and correction accuracy
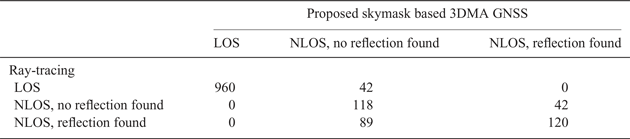
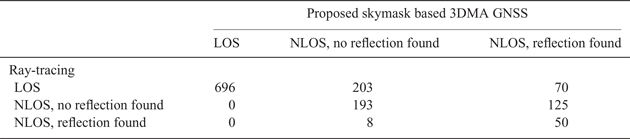
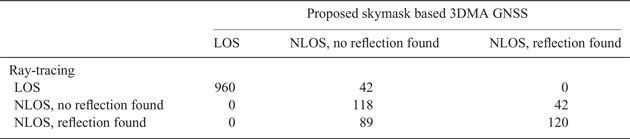
The ground truth from the two static experiments is used here to execute the skymask and ray-tracing based 3DMA GNSS methods to see whether the proposed method provides a consistent reflection delay distance compared with ray-tracing prediction results.Tables 3 and 4 include the total signal, which is labelled as NLOS where reflection was found or not by both methods. Totals of 1,371 and 1,345 signals were found in the TST and TW static experiments (experiments 2 and 3), respectively.
LOS/NLOS signal labelling in experiment 2 (static).
LOS/NLOS signal labelling in experiment 3 (static).
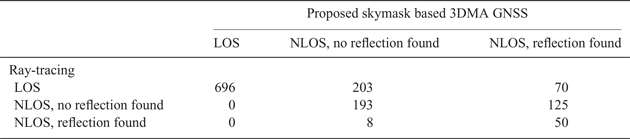
From the above results, the rate of correct signal classification was about 87% in TST and 70% in TW. However, some signals were mislabelled, as the ray-tracing classified them as LOS while the skymask 3DMA classified them as NLOS with no reflection found, as the direct paths of these signals were too close to buildings. This shows a potential problem of the skymask method in handling the uncertainty of the building edge model, where some of the signals may miss detection if they are near the building edge. As a result, there is a difference in classifying the signal type. Another main issue was when the ray-tracing method labelled signals as NLOS with no reflection found and the skymask method labelled them as NLOS with reflection found. The main reason is that the ray-tracing assumes a perfect single reflection, where two parts of the reflected signal path ((1) satellite to reflecting point; and (2) reflecting point to the receiver) are not blocked by any buildings. However, the skymask method did not verify that the path from satellite to reflecting point was free of blockage, so it resulted in misidentification of the reflection found.
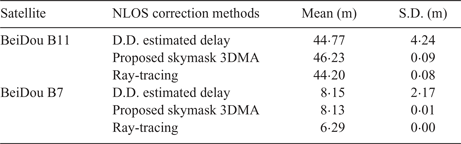
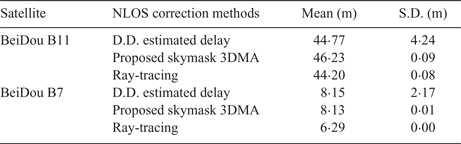
Furthermore, to evaluate the range level correction, we used the ground truth of the experiments, and performed 3DMA GNSS to extract the NLOS range correction and compare it with the double difference. The NLOS correction should be similar to the double difference residual if it is accurate enough. Using the satellite BeiDou B11 in TST (experiment 2) and BeiDou B7 in TW (experiment 3) to analyse further the NLOS correction accuracy in range level, we compared NLOS correction between:
1. NLOS delay by double differencing technique (D.D. estimated delay) (Xu et al., Reference Xu, Jia, Luo and Hsu2019)
2. Proposed skymask 3DMA
3. Ray-tracing
The reflection correction of the proposed method can achieve a similar result to the ray-tracing one, the mean of the correction difference between skymask 3DMA and ray-tracing for BeiDou B11 in TST was 2·02 m with standard deviation of 0·01 m, and the average difference between skymask 3DMA and double difference was 3·75 m with standard deviation of 2·35 m. The mean difference between skymask 3DMA and ray-tracing of BeiDou B7 in TW was 1·84 m with standard deviation of 0·00 m; the average difference between skymask 3DMA and the double difference is 1·58 m with standard deviation of 1·46 m. Other corrections provided by skymask 3DMA were also comparable with the ray-tracing results, the average being within about 10 m difference.
Table 5 summarises the means and standard deviations of the NLOS delay from the proposed skymask 3DMA method and ray-tracing method for two satellites among all the satellites as examples. The performance is further compared with the NLOS delay estimated by the double difference technique using the reference station data and user's true location. It can be observed that the proposed skymask 3DMA can provide a similar accuracy in range level correction compared with the ray-tracing method and actual measurement.
Summary of NLOS reflection delay identified by three methods.
4.3. Positioning results
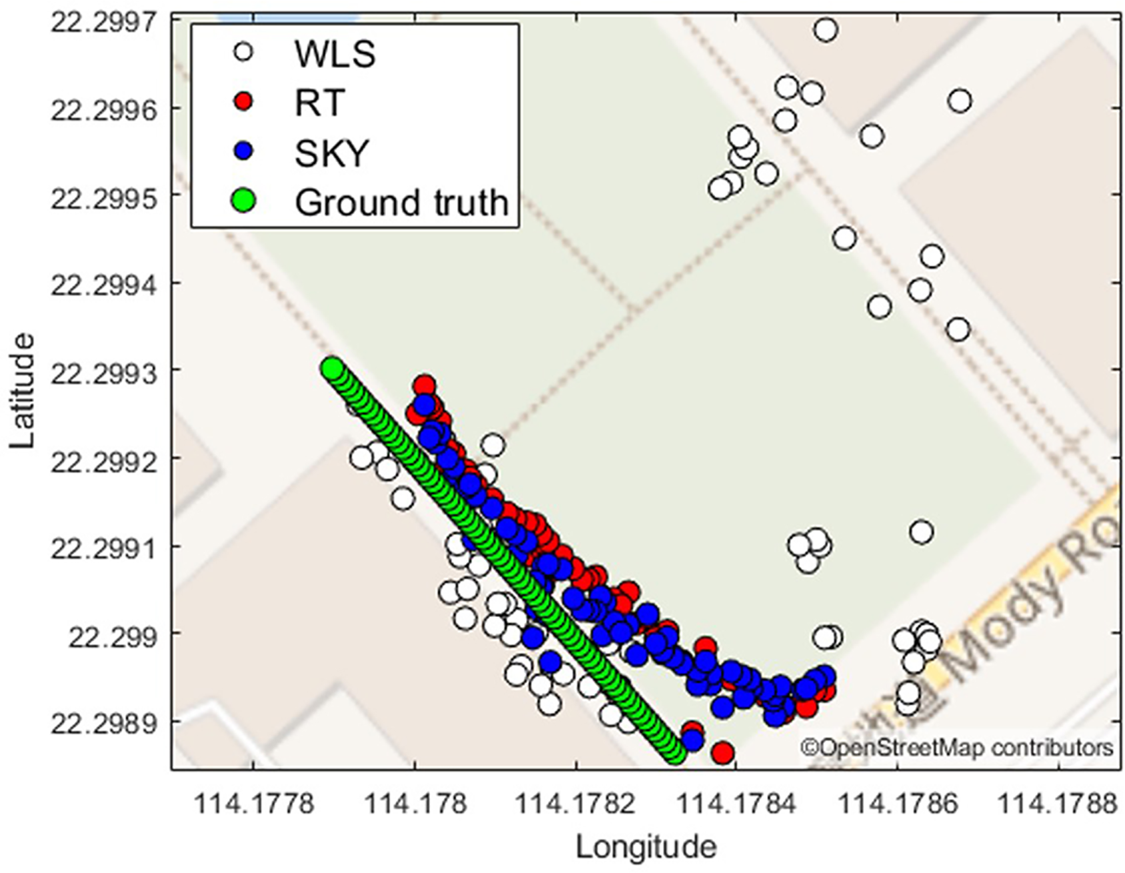
The dynamic experiment (experiment 1) was undertaken in TST, as shown in Figure 10 and Table 6. The u-blox receiver collected the raw measurements during walking along the designed path to simulate a pedestrian scenario.
Dynamic experiment results in Tsim Sha Tsui.

Dynamic experiment results in TST.

The along-street direction of the dynamic experiment is 139 degrees and this angle is used to analyse the positioning error in the along-street and across-street directions. It can be observed that the overall performance of the proposed skymask 3DMA GNSS is over 10 m better than the WLS solution in mean error. The proposed skymask 3DMA GNSS has an extra error of about 1 m on the two-dimensional (2D) and along-street direction, while the across-street direction can achieve similar accuracy to the ray-tracing algorithm.
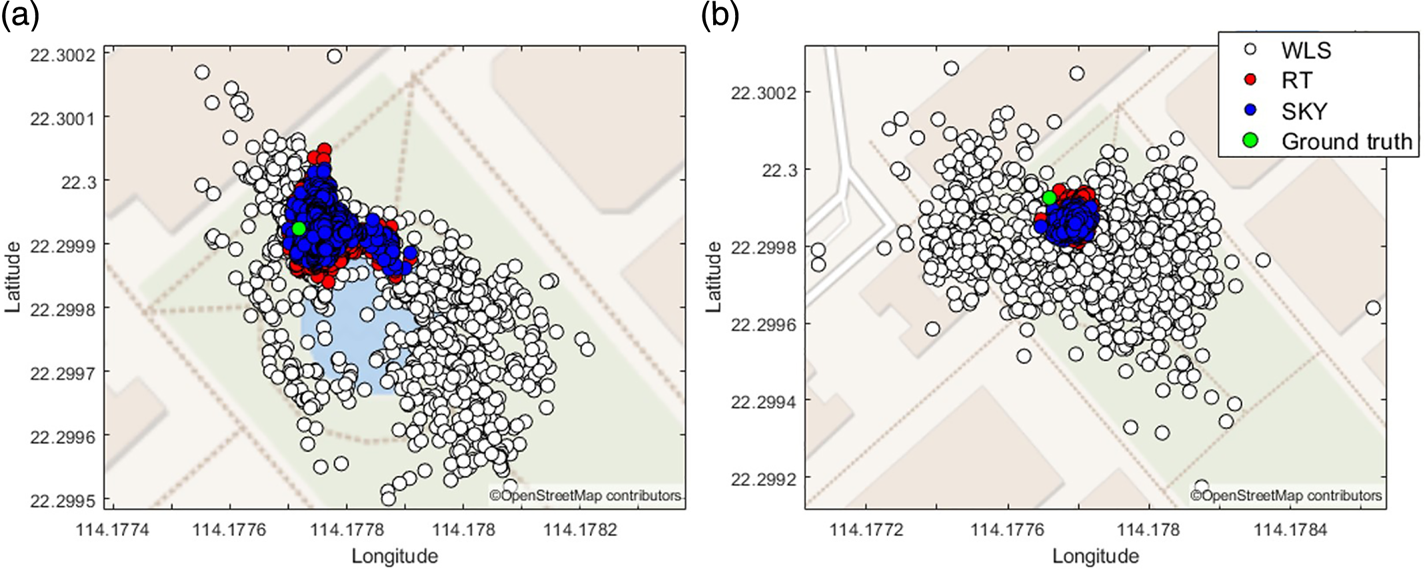
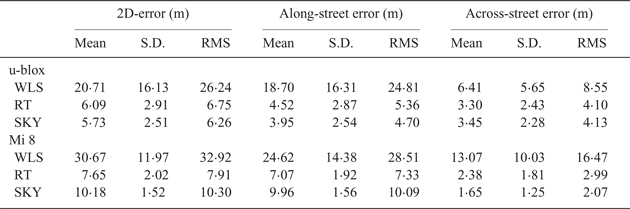
In experiment 2, data was collected by the u-blox and Xiaomi Mi 8 for a duration of 240 s. The positioning results and statistics are shown in Figure 11 and Table 7, respectively.
Static experiment results in Tsim Sha Tsui. (a) data recorded by u-blox; (b) data recorded by Xiaomi Mi 8.

Static experiment results in TST by u-blox and Mi 8.
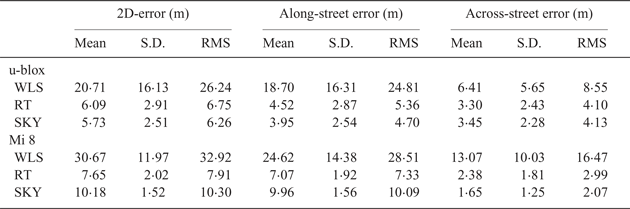
From the positioning results, the skymask 3DMA GNSS algorithm can achieve similar positioning results compared with the ray-tracing based 3DMA GNSS algorithm for the u-blox receiver. For the across-street direction, especially, the root mean square (RMS) error of skymask 3DMA is better than that of the ray-tracing algorithm. The Mi 8 positioning results were worse than the ray-tracing in 2D and along-street error, but the across-street obtained slightly better results than ray-tracing.
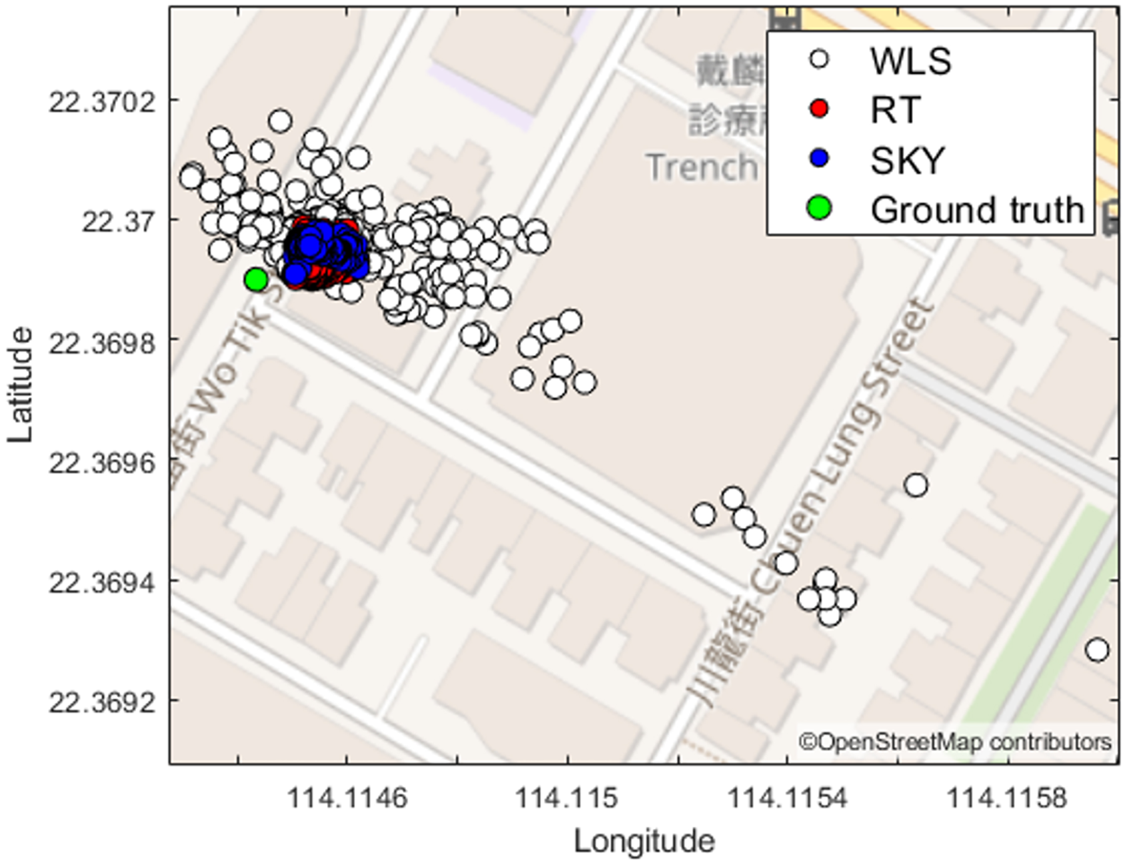
As shown in Figure 12, a static experiment took place in TW with u-blox only (experiment 3). The experimental environment is a dense urban area with streets just 10 m wide, and the building height-to-street width ratio is 2·29. Furthermore, the experiment was located at the intersection of two perpendicular streets. Therefore, the environment potentially has multiple axes. The positioning error statistics are shown in Table 8.
Static experiment results in Tsuen Wan.

Static experiment results in TW.

In experiment 3, the skymask method could also achieve a similar accuracy compared with the ray-tracing method. The 2D error was about 12 m for the skymask method, 10 m and 6 m error on along- and across-street directions, respectively, while the ray-tracing 2D error was 8 m, with along- and across-street directional error as 6 m and 4 m, respectively.
4.4. Computational load
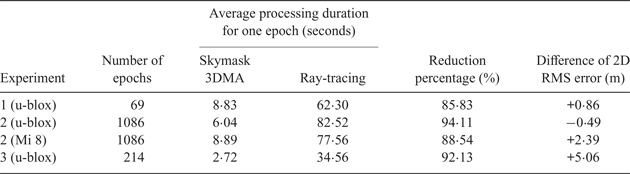
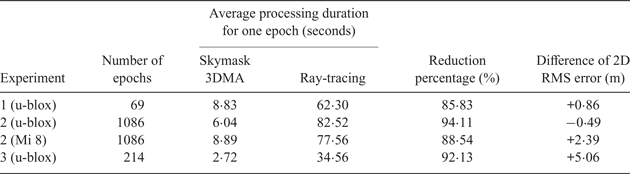
The post-processing of the experimental data was performed by an Intel 7th Generation Intel® Core™ i7 Processor, with Matlab programming platform. The skymask 3DMA was found to be about 10 times faster than ray-tracing in single epoch positioning. Table 9 summarises the average processing time for post-processing for different positioning algorithms and the time reduction. The ‘Reduction on percentage’ is calculated by  $((t_{{\rm RT}}-t_{{\rm SKY}})/t_{{\rm RT}}) \times 100{\rm \% }$ where t RT and t SKY are the average processing duration for one epoch for ray-tracing and skymask 3DMA, respectively. The ‘Difference of 2D RMS error’ is calculated by RMSSKY − RMSRT, where RMSRT and RMSSKY are RMS error of ray-tracing and skymask 3DMA respectively. A negative value here means extra positioning error was observed from the ray-tracing 3DMA GNSS.
Average processing time for experimental data.
5. CONCLUSION AND FUTURE WORK
This paper proposes a new method using the enhanced skymask, including building boundary and height information, to estimate the possible reflecting point for NLOS reception. Based on the valid reflecting point and the signal classification scheme, pseudorange measurements with NLOS delay are simulated for different candidate positions. The similarity between the measurements and simulated pseudorange with NLOS correction is then regarded as the score of the position candidate. By weighted averaging the candidate positions with scores, the receiver location can be better estimated in the urban scenario. Compared with the ray-tracing method, the proposed algorithm can provide similar NLOS correction with much lower computational load without extra equipment, which has the potential to be applicable in portable devices.
The proposed skymask based 3DMA GNSS positioning still has limitations, however. The overlap of building surfaces in the enhanced skymask may cause misdetection of the reflecting surface, which needs to be intelligently separated without adding much computational load. Also, the proposed method does not consider the double-reflected GNSS NLOS that is frequently observed in dense urban canyons (Hsu and Kamijo, Reference Hsu and Kamijo2015), which is possibly contained in the no-reflection-found NLOS part in Tables 3 and 4. The exclusion (Hsu et al., Reference Hsu, Gu and Kamijo2015) or correction (Gu and Kamijo, Reference Gu and Kamijo2017) of the double-reflected NLOS measurement would further improve the performance of 3DMA GNSS. The verification of the path from the satellite to the reflecting point being free of blockage also needs to be further investigated. Compared with the likelihood-based 3MDA GNSS ranging method (Groves and Adjrad, Reference Groves and Adjrad2017), the proposed method considers additional information (e.g. the geometric relationship between reflection and building surface), resulting in a higher computational load. Even though the proposed method has significantly reduced the computational load compared with the ray-tracing algorithm, a further reduction of the processing time is still necessary to guarantee its feasibility for practical real-time applications. A straightforward solution currently is to employ servers instead of the personal device to handle the computational load. In the near future, with the benefit of reduced computational load, the algorithm could resolve the problem by considering multiple reflections of the signal path to enhance the accuracy of NLOS correction.