I. INTRODUCTION
As promising materials in spintronic applications, diluted magnetic semiconductors have become one of the widest investigated subjects in the past decades. Reference Furdyna1,Reference Dietl, Haury and d'Aubigné2 The research on possible practical applications could not succeed in having the Curie temperature above room temperature. Nevertheless, due to theoretical findings showing Curie temperature above room temperature, demand has continued for wide band gap semiconductors. In these types of semiconductors, high Curie temperature value originates from shallow energy levels because of defects Reference Barzykin3 or doped transition-metal atoms Reference Pearton, Abernathy, Thaler, Frazier, Ren, Hebard, Park, Norton, Tang, Stavola, Zavadaf and Wilson4 in the lattice. The oxide semiconductors, such as ZnO, TiO, SnO2 etc., among the wide band semiconductors are thus those mostly in demand, because of their inherent tunable ferromagnetism with high Curie temperature. Reference Fukumura, Yamada, Toyosaki, Hasegawa, Koinuma and Kawasaki5–Reference Chou, Lin, Huang and Hsu11
One such wide band gap oxide semiconductor, zinc gallium oxide (ZnGa2O4), is broadly utilized for various technological applications as transparent conducting oxides such as in solar cell,
Reference Jani, Ferguson, Honsberg and Kurtz12–Reference Meyers14
light emitting diodes,
Reference Chae, Kim, Kim, Sung and Kim15
power electronics,
Reference Trivedi and Shenai16
and solar-blind UV thin film detectors.
Reference Lai, Cheung, Lok, Wong, Ho, Tam and Sou17
ZnGa2O4 lattice consists of Zn and Ga atoms in tetrahedral and octahedral coordinated with oxygen, respectively, and its band gap is about 4.4 eV.
Reference Chae, Kim, Kim, Sung and Kim15–Reference Lai, Cheung, Lok, Wong, Ho, Tam and Sou17
The zinc gallate (ZnGa2O4) crystal structure is a normal spinel structure, which is defined as a cubic phase with
 $Fd\bar 3m$
space group.
Reference Can, Gafferi, Aksoy, Shah and Fırat18
The crystal structures lead the band gap of semiconductors, and the doping with either rare earth elements (Eu, Cr, Dy etc.) or transition metals (Co, Mn etc.) is generally used to tune the band gap.
Reference Tas, Majewski and Aldinger19–Reference Gu, Liu, Li, Howe, Xu, Zhao and Pan21
The reported dopants for ZnGa2O4 semiconductors are Co2+, Mn2+, Ge4+, Li+, Se ions, Eu+3, Cr3+, Dy3+, Mo ions, and Rh3+, to rearrange band gap, and thus the optical and electronic properties.
Reference Kim, Park, Kim, Kim, Hwang, Kim, Mho and Han22–Reference Kumagai, Ni and Irie28
Studies indicate that doping with Ge4+, Li+, Mn2+, and Se ions holds promise for potential applications in field-emission display devices with high brightness operating in green spectral regions.
Reference Kim, Park, Kim, Kim, Hwang, Kim, Mho and Han22–Reference Jeong, Moon, Seo, Bae, Yi, Kim and Park24
The doping with Eu+3 and Cr+3 causes the red, green, and blue luminescence in ZnGa2O4 host materials as shown in the study of Rack et al.
Reference Rack, Peterson, Potter and Park25
Co2+:ZnGa2O4 nanocrystals are mentioned as a potential passive Q-switch for Er:glass laser and as tunable solid-state lasers.
Reference Duan, Yuan, Wang, Yu, Cheng, Liu and Yan26
The ZnGa2O4 particles are also candidate materials in transparent electrodes, and can be doped with Mo ions to increase the number of free carriers in ZnGa2O4 lattice without changing the transparency.
Reference Dutta, Gupta, Bhosle and Narayan27
Another study is based on Rh3+ doping in the octahedral site of ZnGa2O4 to enhance the visible-light sensitivity toward overall water splitting.
Reference Kumagai, Ni and Irie28
Moreover, the doping with transition metals leads the ferromagnetic/antiferromagnetic ordering in semiconductors because of the forming shallow energy levels close to both conductance and valance bands.
Reference Pearton, Abernathy, Thaler, Frazier, Ren, Hebard, Park, Norton, Tang, Stavola, Zavadaf and Wilson4
However, scant literature in the past few years has been concerned with magnetic behavior forming in ZnGa2O4 structures.
Reference Maitra and Valent29–Reference Pisani, Maitra and Valentí31
The magnetic studies on ZnGa2O4 structures generally focus on Fe-doped structures.
Reference Maitra and Valent29–Reference Pisani, Maitra and Valentí31
In this study, the origin of net magnetization—conceived in terms of the coercivity value at room temperature—in the (Zn1–x Co x )Ga2O4 semiconductors (x = 0.05 and 0.10) is investigated. The increase in Co amount decreases the arbitrariness of Co atoms in ZnGa2O4 lattice. After at Co amount threshold, the periodicity of Co atoms in lattice increases. To inhibit the periodically settling Co atoms in the tetrahedral site of lattice, the doped Co amount was not exceeded by 20%. Furthermore, at the high amount of Co atom concentrations, the Co atoms may also settle into the octahedral site of lattice. The 3d levels of Co atoms in the octahedral site split with the octahedral crystal field and complete filling of t 2g levels as seen for Co3O4 structures. Reference Dutta, Seehra, Thota and Kumar32 Because of this nature, the replacement of transition metals in octahedral site caused a decrease in effective magnetization. Consequently, the correlation between Co atoms in lattice and the dominant magnetic interactions, such as double exchange and superexchange, on the effective magnetization of (Zn1–x Co x )Ga2O4 semiconductors (x = 0.05, 0.10, and 0.20) were investigated.
II. EXPERIMENTAL
The (Zn1–x Co x )Ga2O4 (x = 0.05, 0.10, and 0.20) particles were synthesized in two steps: mixing/milling the ingredients metallic Zn, metallic Ga, and metallic Co powder in H2O, and then followed by thermal treatment at 1200 °C to form the chemical reaction:
 $${\rm{Zn}} + {\rm{Co}} + 2{\rm{Ga}} + 4{\rm{H}}_2 {\rm{O}} \to ({\rm{Zn}}_{1 - x} {\rm{Co}}_x ){\rm{Ga}}_2 {\rm{O}}_4 + 8{\rm{H}}_2 \quad .$$
Metallic Zn powders with purity 99% were purchased from Riedel-de Haen and metallic Ga powder (purity 99.9995%) and metallic Co powder (purity 99.9%) were procured from Sigma Aldrich, St. Louis. Mixing and milling of these powders under a deionized water (H2O) environment were performed in a tungsten carbide (WC, consisting of 94% WC and 6% Co) vial with 100 pieces of WC (10 mm diameter) balls for 2 h under 250 rpm. Then, the milled sample was annealed for an hour at 1200 °C. The annealed particles were taken from the oven and manually milled in agate vial for 15 min; and then, the powder was annealed again at 1200 °C for an hour. The process, annealing at 1200 °C and milling, was repeated twice. This process was similar to a ZnGa2O4 synthesis in a previous report. Reference Can, Gafferi, Aksoy, Shah and Fırat18
The x-ray powder diffraction (XRD) patterns were recorded using a powder diffractometer (Rigaku D Max-B diffractometer, Rigaku, Tokyo, Japan) with Cu Kα radiation (1.5418 Å) in the 2θ range of 25°–90° with a scanning rate of 0.02°/min. Furthermore, the XRD patterns were used for lattice parameter calculations with the CRYSFIRE subprogram. Reference Shirley33 The elemental compositions were revealed with energy dispersive x-ray spectroscopy. The optical properties were performed by a Shimadzu UV-3600/UV-VIS-NIR (Shimadzu, Kyoto, Japan) absorption spectrophotometer equipped with Praying Mantis (diffuse reflectance accessory) in a wave length range of 200–1500 nm. The UV-vis spectral studies were also performed to understand the replacement positions of Co atoms in lattice. Furthermore, the room-temperature micro-Raman measurements were taken in the backscattering geometry using a Renishaw in via Reflex Model Raman spectrometer (Renishaw, Gloucestershire, UK). The Ar-ion laser with a 514 nm wave length, applying 5% of total power, was used by focusing into ∼2 µm diameter on the surface. The measurements were recorded in between 120 and 800 cm−1 Raman shift range.
III. RESULTS AND DISCUSSION
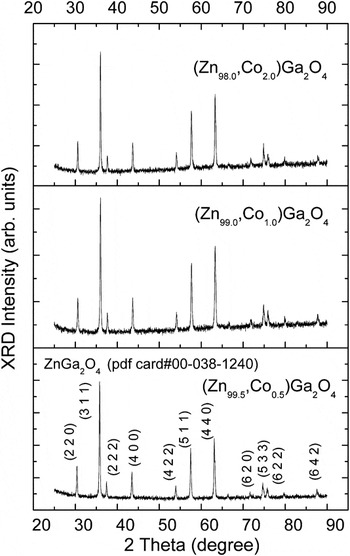
The structures of the particles were characterized using XRD patterns analysis and are shown in Fig. 1. The ZnGa2O4 diffractograms are observed as dominant in the patterns, which are in accordance with the Inorganic Crystal Structure Database (ICSD) card with PDF#00-038-1240. Furthermore, indexing and calculating the lattice parameters were performed using the CRYSFIRE subprogram. The adjacent intensive peaks, between 30° and 80°, were used in lattice parameter calculations. The structure was found coherent to the ICSD cards. Additionally, the crystal structures of (Zn1–x Co x )Ga2O4 (x = 0.5, 0.10, and 0.20) particles were found cubic with the lattice parameters of 8.295 ± 0.006 Å, 8.288 ± 0.007 Å, and 8.285 ± 0.008 Å, respectively. An impurity phase, such as Co compounds or contamination elements during the synthesis abrading from WC vial and balls, was not observed. The distribution particle size is almost the same size interval, changing from 20 to 100 nm, as in the previous study. Reference Can, Gafferi, Aksoy, Shah and Fırat18 The optical analyses were used to understand the positions of Co atoms in lattice and the band gap calculation of each doping amount. The optical studies were done using UV-vis spectra, as shown in Fig. 2. The band gaps were calculated from the inflexion point between 228 and 335 nm of the UV-vis curve. The extremum values of differentiation of each curve were used in calculation of the band gap energy by Eq. (1).
 $$E_{\rm{g}} = {{\left( {hc} \right)} \mathord{\left/ {\vphantom {{\left( {hc} \right)} {\rm{\lambda }}}} \right. \kern-\nulldelimiterspace} {\rm{\lambda }}}\quad .$$
The XRD patterns of synthesized particles (the Miller indices were specified on the patterns).

UV-vis absorption spectra of (Zn1–x Co x )Ga2O4 (x = 0.05, 0.10, and 0.20) particles.

E g, h, λ, and c indicate band gap energy, Planck constant, wave length, and speed of light, respectively. The calculated band gaps were found as 4.97, 4.93, and 4.93 eV for 5%, 10%, and 20% Co doping amount, respectively. The calculated band gaps for Co-doped ZnGa2O4 particles were in accordance with the reported literature values, which changed from 4.4 to 5.0 eV. Reference Zhang, Zhang, Lan, Chen and Wang34,Reference Binet and Gourier35 Furthermore, doping with transition metals caused narrow band gaps. Reference Zhang, Zhang, Lan, Chen and Wang34 However, the narrowing in band gap disappeared for Co amount higher than 10%. No specific change in the band gap was observed despite increasing Co amount up to 20% in the lattice. The specific absorptions of 3d 7 symmetry, in addition to the electronic transition between band gaps, were detected between 510 and 730 nm as pointed out in Fig. 2. Substituting Co atoms in the tetrahedral site at the 4A2(F) ground level, permitted transitions, Ʋ1(Co+2 Td): 4T2(F) → 4A2(F), Ʋ2(Co+2 Td): 4T1(F) → 4A2(F), and Ʋ3(Co+2 Td): 4T1(P) → 4A2(F), which were in (infrared) IR, near-IR, and visible regions, Reference Bouloudenine, Viart, Colis and Dinia36 respectively. The near-IR transitions in between 4T1(F) → 4A2(F) electronic transitions were found at 1312 and 1406 nm. In addition, the transition in visible region of UV-vis absorption spectra at 554, 595, and 640 nm should correspond to 4A2 (F) → 2A1(G), 4A2(F) → 4T1(P), and 4A2(F) → 2E(2G) transitions, Reference Koidl37–Reference Denisov, Volk, Malyarevich, Yumashev, Dymshits, Zhilin, Kang and Lee39 respectively. The intensities of transitions are sensitive to the Co amount in tetrahedral site. Reference Mindru, Gingasu, Marinescu, Patron, Diamandescu, Feder, Calderon-Moreno and Stanica40,Reference Volk, Malyarevich, Yumashev, Alekseeva, Dymshits, Shashkin and Zhilin41 Thus, the increased doped atoms in tetrahedral site caused an increase at intensities. Reference Mindru, Gingasu, Marinescu, Patron, Diamandescu, Feder, Calderon-Moreno and Stanica40 However, a systematic change in intensity from the amount of Co atoms in lattice could not be observed, thus indicating that the Co atoms in the lattice were not only in the tetrahedral site.
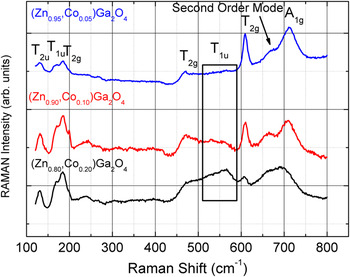
The replacement of Co atoms in the lattice was also analyzed using Raman spectra, shown in Fig. 3. The spinel structure related phonon modes in AB2O4 structures with space group Fd3m were classified as follows Reference Kang, Kim, Lee, Bahng, Choi, Park, Kim, Kim, Hwang, Mho, Eom, Yu, Song and Kim42–Reference Bouchard and Gambardella44 :
 $$\Gamma =\; {\rm{A}}_{1{\rm{g}}} + {\rm{E}}_{\rm{g}} + {\rm{T}}_{1{\rm{g}}} + 3{\rm{T}}_{2{\rm{g}}} + 2{\rm{A}}_{2{\rm{u}}} + 2{\rm{E}}_{\rm{u}} + 4{\rm{T}}_{1{\rm{u}}} + 2{\rm{T}}_{2{\rm{u}}}\quad .$$
Raman spectra of (Zn1–x Co x )Ga2O4 (x = 0.05, 0.10, and 0.20) particles.

The infrared-active mode is defined by 4T1u and the Raman active modes by A1g, Eg, and 3T2g, first-order Raman modes. The first-order Raman active modes in relation with spinel ZnGa2O4 structure were observed at 712 cm−1 (A1g), 609 cm−1 (T2g), and 468 cm−1 (3T2g) which corresponds to Zn2+ ions in the tetrahedral sites and independent from the motions of Ga3+ ions in the octahedral sites. Reference Lopez-Moreno, Rodriguez-Hernandez, Munoz, Romero, J.Manjon, Errandonea, Rusu and Ursaki45,Reference Van Gorkom, Haanstra and Boom46 On the other hand, the low frequency modes at around 131 cm−1 (T2u), 167 cm−1 (T1u: infrared active), and 183 cm−1 (T2g: Raman active) were Zn ions related modes as mentioned in the study of Lopez-Moreno et al. Reference Lopez-Moreno, Rodriguez-Hernandez, Munoz, Romero, J.Manjon, Errandonea, Rusu and Ursaki45 Furthermore, as illustrated in Fig. 3, doping Co atoms raises the infrared active mode at around 540 cm−1 (4T1u); a finding reported in a previous study as well. Reference Van Gorkom, Haanstra and Boom46,Reference Boppana and Lobo47 Increasing the Co amount in the lattice disorders the structure. Thus by deforming the structure's periodicity, the vibration modes of the bonds change. The second-order Raman line was obtained at 670 cm−1, which originated from the disordered structure due to exceeding the stoichiometric composition to the ZnO rich site Reference Iida and Okazaki48 or/and Co ions in octahedral site. Reference Withnall, Lipman, Fern, Rose and Silver49 While at approximately 670 cm−1, the intensity of Raman line became apparent with an increasing Co amount, a decrease of Raman lines occurred for A1g, Eg, and 3T2g modes. These lines assigned the disordered structure. Thus, these results can be correlated to the Co atoms in the octahedral site, as also seen in those findings of the previous study. Reference Can, Gafferi, Aksoy, Shah and Fırat18
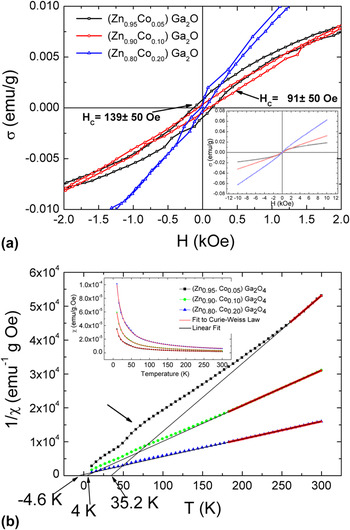
The replacement of Co atoms in both tetrahedral and octahedral sites caused a specific change in magnetic behavior of ZnGa2O4 semiconductors. The magnetization versus magnetic field σ(H) curves was measured at 300 K, as shown in Fig. 4(a) for (Zn1–x Co x )Ga2O4 (x = 0.05, 0.10, and 0.20) particles. The decline at coercivity value was observed with an increasing Co amount in lattice. Enhancing at the Co concentration makes the Co atoms periodic in lattice as mentioned before. Therefore, the formation periodicity for Co atoms in the lattice leads to an increase in the amount of antiferromagnetic coupled Co atoms. The increase of Co concentration upto 20% leads to a decrease at the coercivity value down below the instrument sensitivity, which is between ±50 Oe. On the other hand, the coercivities for (Zn1–x Co x )Ga2O4 (x = 0.05 and 0.10) particles, are at around 139 ± 50 and 91 ± 50 Oe, respectively, which is indicating the long term magnetic ordering (the magnetization sensitivity of VSM apparatus of PPMS is ±50 Oe). The replacement of 20% Co atoms made the antiferromagnetic interaction dominant in all particles; a similar observation was reported earlier for oxide magnetic semiconductors, such as ZnO, SnO, TiO, InO etc. Reference Gao, Li, Liu, Song, Liu and Jiang7,Reference Berardan and Guilmeau8,Reference Can, Firat and Ozcan50,Reference Punnoose, Hays, Thurber, Engelhard, Kukkadapu, Wang, Shutthanandan and Thevuthasan51 However, the ferromagnetic ordering did not totally disappear. Thus, the competition between antiferromagnetic and ferromagnetic interactions cannot be neglected for the oxide diluted magnetic semiconductors. The inverse DC magnetic susceptibility versus temperature χ−1(T) curves are shown in Fig. 4(b). The χ−1(T) curves were used to determine the effectiveness of competition between ferromagnetic and antiferromagnetic coupling on the magnetization. As seen in Fig. 4(b), the linearity at the high temperatures, observed in temperature intervals of 260–300 K, 180–300 K, and 180–300 K for 5%, 10%, and 20% Co-doped particles, disappeared with decrease in temperatures. The linear fits (signed using red lines on the figure) were done to the linear regions on χ−1(T) curves to obtain Curie–Weiss temperatures, which were found from the intersection points on the axis. The Curie–Weiss temperatures for 5%, 10%, and 20% doping amounts were found as 32.5, 4, and −4.6 K, respectively, as shown in Fig. 4(b). The positive Curie–Weiss temperature for (Zn1–x Co x )Ga2O4 (x = 0.05 and 0.10) particles and negative Curie–Weiss temperature for (Zn0.8Co0.20)Ga2O4 are the parameters that prove the dominancy of ferromagnetic and of antiferromagnetic interactions, respectively. Reference Lawes, Risbud, Ramirez and Seshadri6,Reference Berardan and Guilmeau8 In addition, the humpback, which observed at the χ−1(T) curves between 45 and 120 K, also assigns the combination of two separate magnetic interactions, double exchange and super exchange, in the lattice.
(a) Room temperature magnetization curves of (Zn1–x Co x )Ga2O4 (x = 0.05, 0.10, and 0.20) particles and (b) inverse DC magnetic susceptibility curves of (Zn1–x Co x )Ga2O4 (x = 0.05, 0.10, and 0.20) particles (inset shows the DC magnetic susceptibility curves).

The DC magnetic susceptibility versus temperature χ(T) curves, in addition, are shown as the inset in Fig. 4(b). The characteristic of χ(T) curves is coherent with the Curie–Weiss law, which is also used for the wide band gap semiconductors. Reference Wang, Herron, Moiler and Bein53 However, the studies in literature assign the temperature-independent components in the χ(T) curves Reference Berardan and Guilmeau8,Reference Punnoose, Hays, Thurber, Engelhard, Kukkadapu, Wang, Shutthanandan and Thevuthasan51–Reference Wang, Herron, Moiler and Bein53,Reference Kobayashi, Ishida, Hwang, Mizokawa, Fujimori, Mamiya, Okamoto, Takeda, Okane, Saitoh, Muramatsu, Tanaka, Saeki, Tabata and Kawai55,Reference Timm, von Oppen and Hofling57 for DMSs. The temperature-independent component originates from both free electrons and the non-interacting impurity spins due to Co atoms in the (Zn1–x Co x )Ga2O4 lattice, which are known as the Pauli and Curie susceptibilities, respectively. Reference Kobayashi, Ishida, Hwang, Mizokawa, Fujimori, Mamiya, Okamoto, Takeda, Okane, Saitoh, Muramatsu, Tanaka, Saeki, Tabata and Kawai55–Reference Timm, von Oppen and Hofling57 Thus, these ionic transition metals that do not interact with each other, especially for DMSs, do lead strong antiferromagnetic interactions that arise the temperature-independent paramagnetic component in susceptibility curves. Reference Kobayashi, Ishida, Hwang, Mizokawa, Fujimori, Mamiya, Okamoto, Takeda, Okane, Saitoh, Muramatsu, Tanaka, Saeki, Tabata and Kawai55 Moreover, Kobayashi et al. point to the Co ions as having a Néel temperature above the room temperature for the origin of temperature-independent paramagnetic component. Reference Kobayashi, Ishida, Hwang, Mizokawa, Fujimori, Mamiya, Okamoto, Takeda, Okane, Saitoh, Muramatsu, Tanaka, Saeki, Tabata and Kawai55 To add the effects of non-magnetic matrix, the Curie–Weiss equation was modified as shown in Eq. (2). The χ(T) curves [inset of Fig. 4(b)] were fit to Eq. (2) to separate and analyze the effectiveness of all magnetic behaviors. Reference Berardan and Guilmeau8,Reference Punnoose, Hays, Thurber, Engelhard, Kukkadapu, Wang, Shutthanandan and Thevuthasan51–Reference Cao, McCall, Shepard, Crow and Guertin54
 $${\rm{\chi }} = {\rm{\chi }}_0 + {C \over {\left( {T + {\rm{\theta }}} \right)}}\quad .$$
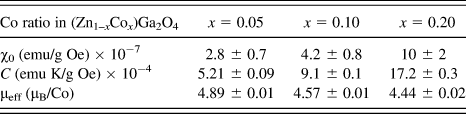
χ0, C, T, and θ were used to assign the temperature-independent part (consisting the Pauli susceptibility, Landau diamagnetism, and core diamagnetism Reference Dutta, Seehra, Thota and Kumar32,Reference Cao, McCall, Shepard, Crow and Guertin54 ), the Curie constant, temperature, and the asymptotic Curie–Weiss temperature, respectively. The calculated values were shown in Table I; and also, used in Eq. (3) to calculate effective magnetic moment (µeff) values (Table I depicts the calculations). Reference Mandal, Das, Nath, Karmakar and Satpati52
 $$\mu _{\rm{eff}} = \sqrt {{{3k_{\rm{B}} CM_{\rm{w}} } \over {Nx}}} \quad .$$
The calculated χ0, C, and µeff values according to the Curie–Weiss law.

k B, C, M w, N, and x are the Boltzmann constant (1.38 × 10⁻¹⁶ erg/K), the Curie constant, the molecular weight of (Zn1–x Co x )Ga2O4 (268.48, 268.16, and 267.52 a.u. for the amount of x = 0.05, 0.10, and 0.20, respectively), Avogadro number (6.02 × 10²³), and Co ratio in lattice, respectively.
The increase of “χ0” by the Co amount in the lattice proved the enhancement of the temperature-independent component of susceptibility, in addition to the diamagnetic component. Reference Kobayashi, Ishida, Hwang, Mizokawa, Fujimori, Mamiya, Okamoto, Takeda, Okane, Saitoh, Muramatsu, Tanaka, Saeki, Tabata and Kawai55,Reference Tovar, Causa, Butera, Navarro, Martinez, Fontcuberta and Passeggi56 The increase of Pauli susceptibility in 20% Co-doped particles assigns the enhancement of antiferromagnetic interactions. The calculated “µeff” values, shown in Table I, are higher than the value for spin only μ (Bohr magnetron value) = 3.87 μB of Co+2 ions Reference Lawes, Risbud, Ramirez and Seshadri6,Reference Dutta, Seehra, Thota and Kumar32 ; however, the “µeff” values are in accordance with the mentioned values in the literature for Co+2 ions. Reference Lawes, Risbud, Ramirez and Seshadri6 The high µeff values per Co atoms indicated the effectiveness of both ferromagnetic and antiferromagnetic coupling upon magnetization. The competitions between ferromagnetic and antiferromagnetic interactions lead to the decrease of µeff values by increasing the Co contents in the lattice. Furthermore, the Co+3 ions on the octahedral site were the other reason of low µeff values at high Co contents. The Co3+ ions in octahedral sites had no magnetic moments because of completely occupied t 2g levels Reference Rack, Peterson, Potter and Park25 and, consequently, these replacements caused the lowering of µeff values. In addition, the presence of Co2+ (tetrahedral site) and Co3+ (octahedral site) ions also caused a change in the magnetic properties due to the nonstoichiometry of oxygen; this finding requires further analyses.
IV. CONCLUSION
The (Zn1–x Co x )Ga2O4 (x = 0.05, 0.10, and 0.20) particles were synthesized via solid state reaction route. Even though the structures in all doping amounts were in accordance with the ZnGa2O4 structure, the optical and Raman measurements assigned the Co3+ ions in the octahedral site, in addition to the Co2+ ions in the tetrahedral site. The increase of Co atoms in the lattice caused a decrease in µeff values from 4.89 ± 0.01 µB/Co (for (Zn0.95Co0.05)Ga2O4) to 4.44 ± 0.02 µB/Co (for (Zn0.80Co0.20)Ga2O4). The decrease in µeff values is a sign of the paramagnetic couplings of Co3+ ions in the octahedral site. Furthermore, increasing Co atoms in the lattice enabled dominant magnetic interactions. Competition between ferromagnetic and antiferromagnetic interactions on magnetization of particles was inferred from the decrease in Curie–Weiss temperatures resulting from the amount of Co atoms in the lattice. Furthermore, replacing the sign of the Curie–Weiss temperature from positive to negative with 20% Co doping enhances the dominancy of antiferromagnetic interactions in (Zn0.80Co0.20)Ga2O4 semiconductors.
ACKNOWLEDGMENT
The author would like thank to Prof. Dr. Tezer Fırat from Department of Physics Engineering, Hacettepe University, for valuable discussions and helpful comments on earlier drafts of this paper.