I. INTRODUCTION
One-dimensional (1D) nanostructures such as nanowires and nanotubes have been the focus of extensive research.Reference Lieber and Wang1 Because of their large surface-to-volume ratio, they are important building blocks for various nanotechnological applications, e.g., when surface sensitivity is required. Nanowires and nanotubes are the active components in nanosensorsReference Heo, Norton, Tien, Kwon, Kang, Ren, Pearton and LaRoche2–Reference Shen, Chen, Ryu and Zhou5 for measuring molecules or gases in concentrations of nanomolars or lower, in optical or molecular tagsReference Keating and Natan6–Reference Wang8 for cell tracking applications, and in self-propelling nanomotors.Reference Wang, Hernandez, Bartlett, Bingham, Kline, Sen and Mallouk9–Reference Wang11 Nanowires and nanotubes may also enable development of new technologies in energy conversion and storage technologies, e.g., novel battery architectures.Reference Chen and Cheng12 A variety of synthesis techniques have been developed, such as vapor-based growth techniques like the Vapor–Liquid–Solid method for nanowiresReference Wagner and Ellis13, Reference Morales and Lieber14 and liquid-based templated growth techniques for nanowires and nanotubes.Reference Martin15
Several types of oxide nanowires and nanotubes, e.g., ZnO,Reference Li, Meng, Zhang and Phillipp16–Reference Ramirez, Pauporte, Gomez and Lincot23 Ni(OH)2,Reference Chou, Cheng and Chen24 and TiO2,Reference Miao, Xu, Ouyang, Guo, Zhao and Tang25 have been made by cathodic electrodeposition in nanopores, in which a sacrificial precursor is electrochemically transformed into hydroxyl ions that raise the pH above the solubility limit of the metal. Anodic aluminaReference Li, Meng, Zhang and Phillipp16–Reference Cui and Gibson18, Reference Ramirez, Pauporte, Gomez and Lincot23 and polycarbonate track-etched (PCTE) membranesReference Leprince-Wang, Yacoubi-Ouslim and Wang19–Reference Sima, Enculescu, Sima, Enache, Vasile and Ansermet22 have been used to guide the growth of the oxide phase. Both systems have a high density of pores with straight channels of uniform diameter.Reference Martin15 In view of our interest in fabricating nanowires and nanotubes with a complex architecture and composition, such as segmented nanowires and core-shell morphologies, it is important to have detailed insight in the way in which the oxide phase grows morphologically in straight-channel nanopores.
In this study, the cathodic electrochemical deposition of two technologically relevant materials inside nanopores of 50- to 200-nm diameter is compared, namely zinc oxide (ZnO) and amorphous iron oxohydroxide (FeO(OH)). Both materials have several possible applications when used in the form of nanowires or nanotubes. ZnO nanowires can find application in nanoscale transistors and gas sensors. Iron oxide is a semiconductor and is photocatalytically active in the reduction of water. Iron oxide wire–like nanostructures are, therefore, interesting as photoelectrodes with high surface-to-volume ratio.
Cathodic electrodeposition of oxides is a generally applicable process and is based on the insolubility of most metal ions in aqueous solutions of high pH. Three oxygen precursors have been described in the literature for cathodic electrodeposition: molecular oxygen,Reference Ramirez, Pauporte, Gomez and Lincot23 nitrate ions,Reference Zheng, Zhang, Li and Shen17, Reference Cui and Gibson18, Reference Lai and Riley20, Reference Sima, Enculescu, Sima, Enache, Vasile and Ansermet22 and hydrogen peroxide.Reference Leprince-Wang, Yacoubi-Ouslim and Wang19–Reference Leprince-Wang, Wang, Zhang and Yu21 By electrochemical reduction of one of these reactants, e.g. nitrate, at an electrode surface, hydroxyl ions are formed that lead to a local rise of pH in the vicinity of the electrode:

This reaction has a standard reduction potential E 0 = 0.01 V. By placing the electrode at the bottom of a nanopore, the pH in the interior of the nanopore increases, ultimately leading to precipitation of metal ions. In our experiments, the electrode covers the bottom edge of the nanopore. Any zinc hydroxide phase formed by precipitation reacts directly to ZnO at slightly elevated temperatures (60–90 °C):

Because the ZnO phase is a natural n-type semiconductor, reactions (1) and (2) can continue at the ZnO/electrolyte interface, forming a crystalline dense ZnO nanowire in the course of time. On the other hand, iron(III) ions precipitate as amorphous FeO(OH) via

The wet iron hydroxide phase, Fe(OH)3, remains stable at room temperature in the form of an electrochemically induced gel embedded in a water matrix inside the pores. It is not a semiconducting phase, and so the electrochemical reduction reaction remains limited to the location of the bottom electrode. Iron hydroxide is decomposed into an amorphous oxohydroxide phase and water upon drying the gel at room temperature in air. The growth mechanism of both types of materials in PCTE membranes with 50- to 200-nm-diameter pores was compared in this study.
II. EXPERIMENTAL
Templated electrodeposition was used for the synthesis of ZnO nanowires and FeO(OH) nanotubes. Commercially available Nuclepore (Whatman Inc., 's Hertogenbosch, The Netherlands) PCTE membranes were used as a template. Membrane pore sizes were between 50 and 200 nm and membrane pore densities were between ∼6 × 10⁸ and 3 × 10⁸ pores/cm2. Before deposition, a gold layer with a thickness of ∼50 nm was sputtered on one side of the membrane. After sputtering, the gold-coated side of the membrane was attached to a glass slide with double-sided tape. The membrane/glass combination was attached as working electrode in a 3-electrode setup using a Bank Elektronik POS 73 potentiostat (Bank Electronik, Pohlheim, Germany). A small piece of platinum mesh was used as counter electrode. The reference potential was set by a 3 M KCl Ag/AgCl reference electrode (REF 321, Radio Analytical, Hach Lange, Tiel, The Netherlands).
ZnO nanowires were deposited from an electrolyte containing 0.01 M Zn(NO3)2·6H2O (98%; Sigma-Aldrich, Munich, Germany) at 62–90 °C using a potential of −1.00 V. The pH of this solution was 5.9. The electrolyte used for the iron hydroxide sol–gel process was made by adding a solution of 100 mL deionized water (ρ = 18.2 MΩ cm), 5.1 g of NaOH (pellets; Sigma-Aldrich), and 9 mL of HNO3 (65% solution; Acros Organics, Geel, Belgium) to 200 mL 0.03 M Fe(NO3)3·9H2O (Sigma-Aldrich). The pH of this solution was 1.8. The potential was set to −1.00 V versus the reference electrode. Deposition times were typically 20 min after which the membranes were removed from the electrolyte and dried in air for at least 3 h.
Gold segments were deposited from an electrolyte containing 0.005 M HAuCl4·3H2O (99+%; Merck BV, Schiphol-Rijk, The Netherlands). Deposition occurred either at a constant potential of +0.25 V or using a saw-tooth potential oscillating between +0.97 and 0 V with a linear rate of 10 mV/s. The electrolyte solution for nickel deposition contained 0.23 M NiSO4.6H2O and 0.15 M H3BO3. The potential was set to −1.00 V versus reference in this case.
After deposition and drying, the PCTE membranes were dissolved in dichloromethane (SeccoSolv, Merck). To isolate individual nanowires on a substrate for further analysis, a droplet of dichloromethane containing wires and dissolved polycarbonate was placed on the substrate and dried. After drying, the substrate was rinsed with fresh dichloromethane by holding it for 15 s in the solvent.
X-ray diffraction was performed with a Philips PanAnalytical PW1830 (Panalytical, Almelo, The Netherlands) with a copper x-ray source and a wavelength of 1.54 Å. Analysis of isolated ZnO nanowires and FeO(OH) nanotubes was performed with a Zeiss HR-LEO 1550 FEF scanning electron microscope (SEM; Carl Zeiss B.V., Sliedrecht, The Netherlands) and an analytical transmission electron microscope (TEM; FEI instruments). X-ray photoelectron spectroscopy (XPS; Siemans, The Hague, The Netherlands) was performed with an OMICRON system using a monochromatic x-ray source (Aluminum; 1486 eV) and an EA 125 series analyzer.
III. RESULTS AND DISCUSSION
A. Growth of ZnO nanowires and segmented metal–ZnO nanowires
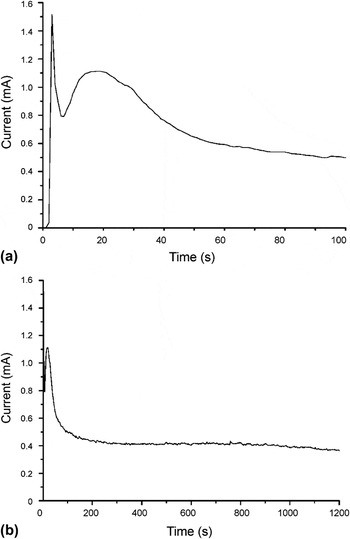
The growth of ZnO nanowires was monitored by measuring the current during deposition at constant voltage applied to the Au working electrode attached to the PCTE membranes. A typical example is shown in Fig. 1(a), where the chronoamperogram of the first 100 s of ZnO deposition in 200-nm pores at 70 °C is given. Crystalline ZnO and water are known to form directly upon precipitation of Zn2+ with OH− above ∼50 °C, without intermediate formation of Zn(OH)2.Reference Lai and Riley20 The chronoamperogram shows a high initial current peak in the first few seconds after a potential was imposed, which is indicative of ionic double-layer charging. Then the current decreased temporarily and rose to a second current maximum after 20 s of application of a potential. The second current increase can be interpreted in terms of independently growing ZnO nuclei that are smaller than the dimensions of the pore and are not influenced by each other’s presence. Essentially, the growth was two-dimensional in this stage, and the rising current indicates that the surface area available for nitrate reduction [reaction (2)] increased with time. Once the ZnO nuclei had grown enough to become connected to neighboring nuclei, the surface area decreased again.Reference Bort, Jüttner, Lorenz, Staitkov and Budevski26, Reference Cherevko, Fu, Kulyk, Cho, Haam and Chung27 Consequently, the current decreased and the system entered a state of pseudo-steady state 1D growth after 60–100 s of deposition. The current then remained more or less constant during the remainder of the deposition process, as shown in Fig. 1(b).
Chronoamperograms of ZnO growth in polycarbonate track-etched (PCTE) nanopores of 200-nm diameter at 70 °C. (a) Current during first 100 s of potentiostatic deposition; (b) current response during entire 20-min deposition process.

The cathodic efficiency of the process was very low. Theoretically, the formation of 1 mol ZnO requires 2 mol electrons when reactions (1) and (2) occur in stoichiometric ratio. However, when the total volume of ZnO that can be deposited inside the entire volume of the nanopores is compared with the total amount of charge that was typically transferred in a 20-min deposition process, it follows that the deposition efficiency was smaller than 5%. The remainder of the formed OH− probably diffused into the bulk of the electrolyte solution. This result indicates that the amount of OH− formed at the cathode via reaction (1) was much larger than the amount of OH− that participated in reaction (2). This suggests that the deposition process was either limited by the rate of reaction (2) or by the diffusional supply of Zn2+ to the growing nanowire. The former hypothesis is less likely because ZnO formation is known to have fast kinetics.Reference Tena-Zaera, Elias, Lévy-Clément, Mora-Seró, Luo and Bisquert28 So diffusional supply of Zn2+ to the OH−-forming electrode is probably the rate limiting step.
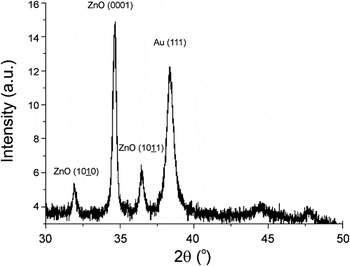
The occurrence of preferential orientation in the nanowires was confirmed by x-ray analysis of arrays of ZnO nanowires after deposition. The diffractogram in Fig. 2 shows a wurtzite crystal structure obtained at 62 °C in 50-nm pores. The Au (111) peak of the bottom electrode is also visible. The (0001) peak of ZnO is comparatively much stronger than the  and
 reflections, indicating that the preferential growth direction of the nanowires was (0001). When the temperature was increased, the relative contributions of the
 (at 70 and 90 °C) and
 (at 90 °C) reflections increased, indicating that the preferential (0001) growth became less dominant. Application of the Scherrer formula to the (0001) peaks of ZnO x-ray diffractograms using a shape factor K = 0.9 indicated that the average crystallite size was ∼46 nm, irrespective of deposition temperature. The preferential growth direction contrasts with an earlier study on the cathodic deposition of ZnO in nanopores of 10- to 90-nm diameter, where no preferential orientation was observed.Reference Leprince-Wang, Wang, Zhang and Yu21 The reason for the difference between these two cases is not clear. Preferential orientation is promoted by conditions in which growth is limited by diffusional supply of reactants. Diffusion-limited growth is also characterized by a stable current, as shown in Fig. 1(b). This is in agreement with the assumption that the growth process is diffusion limited.
X-ray diffraction pattern of electrochemically deposited ZnO nanowires in PCTE nanopores after 20 min of deposition at 62 °C.

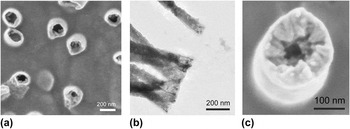
The morphology of the wires was found to depend on the temperature of deposition. Figure 3(a) shows an SEM image of a gold working electrode after 300 s of ZnO deposition at 62 °C. The PCTE membrane with 50-nm pores had been dissolved in dichloromethane before SEM analysis, so that the nanowires are well visible. It can be seen that hollow tubular structures are formed in the PCTE membrane pores. The observation is in agreement with earlier findings, where tubular growth in the initial stages of electrochemical nanowire deposition was also reported.Reference Bort, Jüttner, Lorenz, Staitkov and Budevski26, Reference Konishi, Motoyama, Matsushima, Fukunaka, Ishii and Ito29, Reference Motoyama, Fukunaka, Sakka and Ogata30 As can be seen in the TEM image of Fig. 3(b), the tubular structures became much denser in axial direction upon prolonged deposition. However, even after about 800 s of deposition, the closeup of the top of a growing nanowire in Fig. 3(c) shows a hollow structure with a clear inward growth direction perpendicular to the pore wall and a more or less smooth exterior. The morphology suggests that nucleation occurs on the pore walls and ZnO crystals grow inward.
(a) Scanning electron microscopy (SEM) image showing tubular growth during ZnO nanowire growth at 62 °C after 300 s of deposition; (b) Transmission electron microscopy (TEM) image of ZnO nanowires. The lighter areas at the outer ends of the nanowires indicate the evolution of tubular morphology during the initial stages of growth at 62 °C. The scale bar is 200 nm; (c) Grains grown perpendicular to the pore wall at top of ZnO wire after 800 s of deposition at 62 °C.

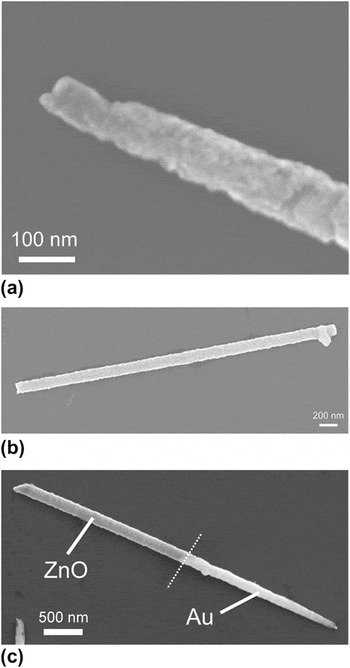
The microstructure of ZnO nanowires grown at 70 °C was more homogeneous than that of wires grown at 62 °C. No hollow tubular structure was formed in the initial stage of deposition, as illustrated in Fig. 4(a). Figure 4(b) shows a typical example of the straight and uniform morphology typical for nanowires grown at 70 °C. It was well possible to use the 70 °C-grown ZnO phase for making axially segmented metal–ZnO nanowires, as illustrated for the case of gold–ZnO in Fig. 4(c). Reduction of AuCl4− ions was used to form the gold phase in this case. Segmented silver–ZnO nanowires were made via the same approach.Reference Maas, Rodijk, Maijenburg, ten Elshof, Blank, Nielsch, Fontcuberta i Morral, Holt and Thompson31
SEM image of ZnO nanowires grown at 70 °C in 200-nm diameter pores for 1200 s; (a) Close-up of the beginning of the ZnO nanowire; (b) Uniform ZnO nanowire with straight beginning and end; (c) Axially segmented Au–ZnO nanowire formed by subsequent electrodeposition of gold and ZnO in a PCTE membrane. The respective phases are indicated in the figure.

B. Growth of amorphous FeO(OH) nanotubes and Ni-FeO(OH) core–shell nanowires
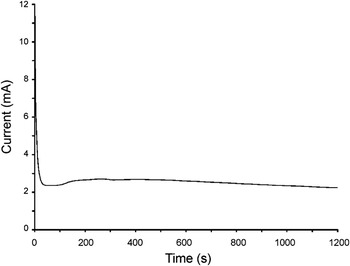
The formation of FeO(OH) nanotubes was carried out in the same electrochemical cell and using similar PCTE membranes. To prevent instability of the gel, the experiments were carried out at room temperature. By adding an excess of nitrate ions, a quick local increase of pH can be realized without reducing iron(III) ions directly at the start of the process. A chronoamperogram of the electrochemical reduction of iron nitrate in a PCTE membrane with 200-nm-diameter pores at room temperature is shown in Fig. 5. As with ZnO, the cathodic efficiency of the process was found to be much smaller than 10%, indicating excess formation of OH−.
Chronoamperogram of iron(III) hydroxide formation in a PCTE membrane with 200-nm diameter pores at room temperature.

In comparison with the chronoamperograms of ZnO growth, the current increase in the first 100 s of the process is more or less absent. This indicates that no free growth of crystalline nuclei occurs, as with ZnO. This agrees with expectation, as it is well known that an amorphous FeO(OH) phase rather than a crystalline iron oxide phase forms at room temperature. After the initial double-layer charging and ion adsorption process, a steady current developed. This is indicative of a diffusion-controlled process. The reduction of nitrate at the working electrode generated a net flux of nitrate species towards the working electrode.Reference Miao, Xu, Ouyang, Guo, Zhao and Tang25 The hydroxyl ion species form a diffusive front that moved in the opposite direction, away from the electrode. As the hydroxyl ions diffused, precipitation of Fe(III) ions into Fe(III) hydroxide occurred wherever the local pH increased to a pH value of about 5.5.Reference Gupta, Pinisetty, Flake and Spivey32 As the nitrate ions could be reduced only at the back electrode, they had to diffuse through the aqueous iron hydroxide sol–gel that is formed in the course of the process, whereas the hydroxyl ions had to diffuse in the reverse direction. The hydroxyl diffusion process through the gel is crucial to generate a sufficiently high pH throughout the volume of the pore to transform all available dissolved iron ions into iron hydroxide gel.
On a time scale of 100–200 s, a temporary current increase can be observed. The effect was less pronounced than with ZnO and occurred only after a period of time that was too long to be explained in terms of free growth. The slow increase of current is probably due to the buildup of the hydroxyl diffusion zone and diffusion front.Reference Maas, Rodijk, Maijenburg, ten Elshof, Blank, Nielsch, Fontcuberta i Morral, Holt and Thompson31 The effect was absent when the same electrodeposition experiment was carried out on a flat electrode. This is in agreement with the expectation that buildup of the hydroxide diffusion zone occurs more slowly in the absence of spatial confinement.
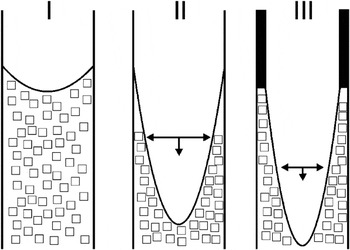
After electrodeposition, the membranes containing the wet iron hydroxide gel were dried. A homogeneous layer covering the walls of all nanopores remained. We think that these layers form because of a capillary collapse of the gel, as a result of volume loss due to solvent evaporation. The process is schematically shown in Fig. 6. The capillary force and the simultaneous adhesive interaction between gel and hydrophilic pore wall results in the formation of a dried layer. Because of the small dimensions of the PCTE membrane pores, the formed layers have a very regular thickness. This is because local concentration fluctuations are inhibited by the low dimensionality and isolated nature of the nanopores.
Schematic illustration of nanotube formation during drying of iron hydroxide gel. Stage I indicates a PCTE membrane pore with iron(III) hydroxide gel; Stage II indicates the capillary collapse of the gel upon drying; Stage III indicates the simultaneous volume loss and pore wall interaction of the iron(III) hydroxide gel, resulting in the formation of an iron oxohydroxide FeO(OH) nanotube.

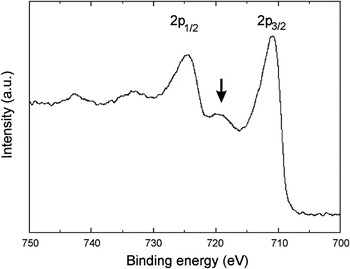
To verify that neither free growth of crystallites nor any other side reactions like the reduction of iron(III) to iron(II) occurred during the deposition process, XPS was performed on the dried gel. The sample was detached from the gold back electrode to expose the initially formed layers. The XPS spectrum is shown in Fig. 7. The presence of a small satellite peak at binding energies between 721 and 716 eV indicates the presence of Fe3+ without the presence of Fe+ or Fe2+ species.Reference Gota, Moussy, Henriot, Guittet and Gautier-Soyer33 This supports the hypothesis that no side reactions involving iron occurred at the electrode interface.
X-ray photoelectron spectrum of iron(III) oxohydroxide layer. The satellite peak indicated by the arrow is characteristic for Fe3+.

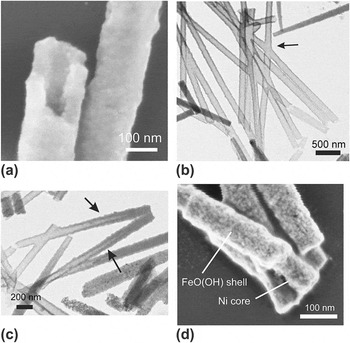
The formed nanotubes were investigated by SEM, TEM, and selected-area electron diffraction (SAED) to check for the presence of crystallinity. Figure 8(a) shows an SEM image of FeO(OH) nanotubes after drying in air. The tubular structure has a very regular wall thickness. SAED gave no indications for the presence of crystallinity anywhere in the tubes. The TEM picture in Fig. 8(b) clearly shows that the nanotubes are hollow on the inside over the entire length of the nanotubes. A complex X-shaped tubular structure can also be seen in Fig. 8(b) that was formed as crossing pores were apparently present in the particular PCTE membrane. Please note that the x-shaped object is a completely tubular structure that could not be realized without the gel-collapse mechanism described earlier. The TEM analyses showed that the majority of tubular structures opened completely during drying. It is estimated that 70% of the nanotubes are hollow throughout their length. The other nanotubes typically have an interior structure that resembles phase II in Fig. 6 and is illustrated in Fig. 8(c).
SEM and TEM images after drying an iron(III) hydroxide gel in 50-nm diameter PCTE membrane pores. (a) SEM image of the hollow interior of an amorphous FeO(OH) nanotube; (b, c) TEM images of FeO(OH) nanotubes. An X-shaped nanotube is visible at the position of the arrow in (b); Two partially opened nanotubes are visible at the positions of the arrows in (c). (d) SEM image of Ni-filled FeO(OH) nanotubes with core-shell architecture.

It was also shown that the hollow interior of the FeO(OH) nanotubes can be filled with a metallic phase, e.g., nickel, in a subsequent electrodeposition experiment using the same membranes. An example of the resulting Ni-filled FeO(OH) nanotubes with core–shell morphology is shown in Fig. 8(d). A standard nickel plating bath was used for the reduction of Ni2+ to metallic nickel.
IV. CONCLUSIONS
The electrochemical growth of ZnO nanowires in PCTE nanopores at 62–70 °C showed that the growth rate seems to be determined by the supply of Zn2+ to the growing ZnO nanowire. Depending on the deposition temperature, the morphology of the as-formed ZnO wires was different. Wires obtained at 70 °C were smooth and dense, whereas wires grown at 62 °C were hollow at the end where the growth began and showed clear indications of morphology development by nucleation on the pore wall and inward-directed growth. The chronoamperograms of ZnO showed clear indications of free growth of crystalline nuclei in the early stages of growth. The final ZnO nanowires have a preferential (0001) growth orientation, but this preferential growth direction became less dominant with increasing deposition temperature. It was shown that axially segmented metal–ZnO wires can be made using this method.
In the case of the electrochemically induced formation of iron(III) hydroxide gel, no indication for free growth of nuclei was found. In contrast to ZnO, where the final oxide phase is formed upon deposition, the Fe(III) ion solution was transformed into an iron hydroxide gel, through which transport of nitrate toward the electrode and diffusion of hydroxyl ions away from the electrode were still possible. Collapse of the gel upon drying led to the formation of nanotubes inside the PCTE pores. The resulting FeO(OH) phase was amorphous and showed no traces of crystallinity by SAED. XPS confirmed that only Fe3+ was present in the as-formed tubes. It was shown that nickel could be deposited inside the hollow FeO(OH) nanotubes, yielding nickel–FeO(OH) nanowires with a core-shell morphology.
ACKNOWLEDGMENTS
Financial support from the Dutch Ministry of Economic Affairs in the framework of the NanoNed program is acknowledged.