I. INTRODUCTION
To enhance the photocatalytic activity of titanium oxide (TiO2) under ultraviolet (UV) light irradiation, various crystal phases and sizes of TiO2 particles have been tested. The best results have been found using anatase TiO2 with crystal dimensions of less than 30 nm, where the primary particles with crystal dimensions of less than 10 nm agglomerated. Reference Xu, Shi, Fan, Dong, Shi and Hu1 Initial studies of photocatalytic TiO2 films have been carried out because of their easy utilization that does not require a recovery step, unlike the case for TiO2 powders, Reference Paz, Luo, Rabenberg and Heller2,Reference Watanabe3 and high photocatalytic activities have been demonstrated for anatase TiO2 films with crystal dimensions of about 10 nm. Reference Yu, Zhao and Zhao4,Reference Yu, Yu and Zhao5 There have also been investigations on the optimization of TiO2 photocatalysis under sunlight and on visible-light photocatalysis of Ag and Au nanoparticle (AuNP)-containing TiO2 films doped with C, N, S, or transition-metal ions. Reference Irie, Watanabe and Hashimoto6–Reference Li and Li11
TiO2 photocatalysts containing AuNPs display high UV and visible-light photocatalytic activity. Under UV-light irradiation, electrons and holes are generated in TiO2 and the AuNPs act as electron traps to inhibit the recombination of electron–hole pairs, and hence, the photocatalytic activity is enhanced. Reference Li, Suyoulema, Wang and Sarina12–Reference Yogi, Kojima, Hashishin, Wada, Inada, Gaspera, Bersani, Martucci, Liu and Sham15 The electrons generated cannot transfer from TiO2 to small AuNPs and cannot transfer from large AuNPs to the adsorbed O2, and the resultant optimum particle size of AuNPs for photocatalysis has been reported to be about 3 nm. Reference Li, Suyoulema, Wang and Sarina12,Reference Tian, Zhang, Tong and Chen16 On the other hand, under visible-light irradiation, photogenerated electrons are produced through surface plasmon resonance in AuNPs, and then the photocatalysis occurs due to injection of photogenerated electrons via TiO2 into O2 adsorbed on TiO2. Reference Li, Suyoulema, Wang and Sarina12 Therefore, small AuNPs, where the surface plasmon resonance occurs under visible-light irradiation, are needed for visible-light photocatalysis. Reference Qian, Sweeny, Johnston-Peck, Niu, Graham, DuChene, Qiu, Wang, Engelhard, Su, Stach and Wei17 The procedures used to prepare the AuNPs and their morphology and adding concentration influence the visible-light photocatalysis. Reference Kaur and Pal18
To make a highly active photocatalyst from a TiO2 film embedded with AuNPs (Au–TiO2), it is necessary to control the phase and average size of the TiO2 crystals and the average size of AuNPs at the same time. In addition, for this purpose, the mechanism of the photocatalytic reaction in an Au–TiO2 film needs to be investigated. However, the phase and average size of TiO2 crystals and the average size of AuNPs in an Au–TiO2 film, prepared by using a combination of sol–gel and dip-coating methods with preheating and post-heating treatments, have never been controlled at the same time. Furthermore, photocatalytic reactions using Au–TiO2 have hardly been investigated using reaction kinetics.
In the present study, in films of both TiO2 and Au–TiO2 prepared using a combination of sol–gel and dip-coating methods with preheating and post-heating treatments, extensive investigations on the crystallization of anatase, the phase transformation from the anatase into the rutile phase, crystal size of TiO2, and average size of AuNPs were carried out by performing X-ray diffraction (XRD) and Ti K-edge X-ray absorption near-edge structure (XANES) analyses and by making transmission electron microscopy (TEM) observations. Moreover, the UV-light photocatalytic activity levels of the films were estimated on the basis of the reaction kinetics of the bleaching of methylene blue (MB) in aqueous solution. Finally, the effects of both the addition of AuNPs and the preheating and post-heating temperatures on the crystallization and transformation of TiO2 and on the UV-light photocatalytic reaction were revealed.
II. EXPERIMENTAL
A. Preparation of TiO2 and Au-TiO2 films
A TiO2 sol solution was prepared from a 1:1:40:1 M ratio of Ti(O-i-C3H7)4:H2O (distilled water):C2H5OH:NH(C2H4OH)2, all purchased from Wako Pure Chemical Industries, Ltd., Osaka, Japan. A solution denoted as “solution A” was prepared by stirring together a 20:1 M ratio of C2H5OH and NH(C2H4OH)2 for 30 min, followed by adding Ti(O-i-C3H7)4 to this solution A with stirring for 30 min at room temperature. A solution denoted as “solution B” was prepared by mixing another aliquot of C2H5OH (the same amount used to prepare solution A) with H2O. A sample of solution B was added dropwise into a sample of solution A with stirring for 30 min, and then the resultant solution was stirred for another 60 min. A TiO2 sol solution containing AuNPs was prepared as follows: an 8.0 mol/L ethanol solution of AuNPs@PVP [PVP: poly(vinylpyrrolidone)], which had been prepared according to the previous report, Reference Yogi, Kojima, Hashishin, Wada, Inada, Gaspera, Bersani, Martucci, Liu and Sham15 was added to a sample of solution B to make Au–TiO2 films containing 5.5 mol% Au. A sol solution was obtained by adding this solution B into a sample of solution A in the same way as mentioned above. One unmodified TiO2 film and several TiO2 films embedded with AuNPs (Au–TiO2) were prepared using the dip-coating method as follows: TiO2 sol solutions without and with AuNPs were utilized to prepare the TiO2 film and Au–TiO2 films, respectively. For each film fabrication, a silica glass substrate (9 × 70 × 1 mm3) was dipped into the relevant sol solution, which was immediately drawn up at a rate of 0.5 mm/s; then the coated substrate was dried at 100 °C for 10 min and preheated at 200 or 400 °C for 10 min. This process of coating, drying, and preheating was repeated 8 times to prepare a gel film. The gel film was heated at T = 400, 500, 600, 700, 800, or 900 °C for 3 h. A total of 18 films including the TiO2 films preheated at 400 °C (T400-T) and the Au–TiO2 films preheated at both 200 (AT200-T) and 400 °C (AT400-T) were obtained.
B. Characterization
To identify the crystal phase of TiO2 and to estimate the crystallite sizes of TiO2 and Au, the films whose fabrication are described above were analyzed using an X-ray diffractometer (SmartLab, Rigaku Corporation, Tokyo, Japan; Cu Kα, 40 kV, 30 mA). To identify furthermore the crystal phase of TiO2 and to investigate the ratio of the amount of amorphous TiO2 to the amount of anatase, Ti K-edge XANES spectra were acquired. Ti K-edge XANES spectral measurements for the T400-T films were performed with an Si(220) monochromator at the BL-3 beamline of the SR Center, Ritsumeikan University; the spectra were recorded in the fluorescence yield (FY) mode using a three-element solid-state detector (SSD). Ti K-edge XANES spectral measurements for the AT200-T and AT400-T films were performed with an Si(111) monochromator at the BL-12C station of the Photon Factory, High Energy Accelerator Research Organization (KEK-PF), Japan; these spectra were collected in the FY mode using a 19-element SSD. To investigate both the crystallite sizes and the states of TiO2 and Au, the AT200-T and AT400-T films were observed using a transmission electron microscope (JEM-2100, JEOL, Tokyo, Japan).
C. Photocatalytic activity evaluation
Photocatalytic activity was evaluated by measuring the absorbance of a MB aqueous solution as follows: an aqueous 1.0 × 10⁻⁵ mol/L MB solution in a quartz cell (10 × 10 × 65 mm3) was kept in the dark at 25 °C for 3.6 ks. A film immersed in the solution was irradiated using a 365-nm UV lamp with a light intensity of 60 μW/cm2. O2 gas was bubbled into the MB solution for 1.2 ks prior to UV irradiation and the bubbling was continued during the UV irradiation. Using a UV–Vis spectrophotometer (UV-1700, Shimadzu, Kyoto, Japan), an absorption spectrum of the MB aqueous solution was recorded every time the solution was irradiated. To evaluate the photocatalytic activity, the relative concentration of MB, that is, [MB] t /[MB]0, was obtained by using Eq. (1),
 $${{{{\left[ {{\rm{MB}}} \right]}_t}} \over {{{\left[ {{\rm{MB}}} \right]}_0}}} = {{{A_t}} \over {{A_0}}}\quad ,$$
where [MB] t and A t are the concentration of the MB solution at UV irradiation time t and the maximum absorbance of the MB solution at a wavelength of 665 nm, respectively.
III. RESULTS
A. XRD and TEM analyses
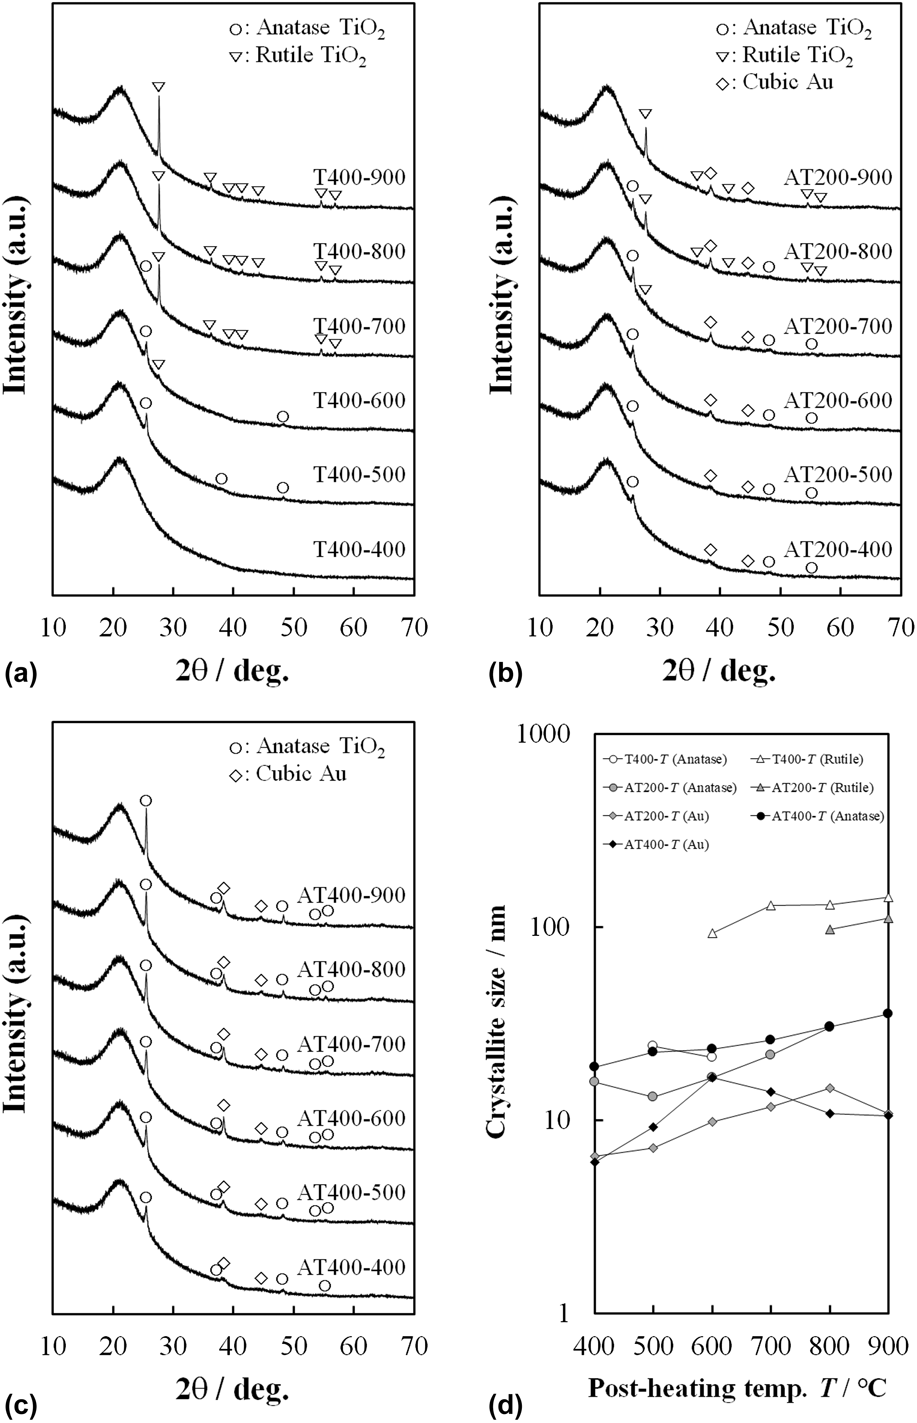
XRD patterns of the T400-T, AT200-T, and AT400-T films, and calculated crystallite sizes of anatase, rutile, and gold in the T400-T, AT200-T, and AT400-T films are shown in Fig. 1. In the XRD of each film tested, a halo pattern appeared, and diffraction patterns resulted from crystals in nearly every film. For the T400-T films, the XRD peaks corresponding to the anatase form appeared for T = 500–700 °C, and their intensities were the strongest at T = 500 °C, whereas the rutile XRD peaks appeared for T = 600–900 °C, and their intensities increased with increasing T in this range. For the AT200-T films, peaks corresponding to anatase, rutile, and gold were observed: the anatase XRD peaks appeared for T = 400–800 °C, with their intensities observed to increase as T was increased from 400 to 700 °C, and then to decrease as T was increased further to 800 °C; the rutile XRD peaks appeared at T = 700–900 °C, and their intensities increased with increasing T; and the gold XRD peaks appeared at 2θ = 38.2 and 44.5° for all of these films, and their intensities increased as T was increased from 400 to 800 °C and then plateaued as T was further increased to 900 °C. For the AT400-T films, the anatase and gold XRD peaks appeared at T = 400–900 °C; the anatase XRD intensities increased with increasing T, while the gold XRD intensities increased as T was increased from 400 to 600 °C but then plateaued as T was further increased from 600 to 900 °C. For the T400-T films (T = 500 and 600 °C), AT200-T films (T = 400–600 °C), and AT400-T films (T = 400–900 °C), which only yielded anatase XRD peaks, the anatase XRD intensities were stronger for the AT400-T films than for the AT200-T films when treated at the same post-heating temperatures, and the intensities for AT400-T films containing AuNPs were stronger than those for T400-T films treated at the same post-heating temperatures. For the T400-T films (T = 700–900 °C) and AT200-T films (T = 800, 900 °C), which yielded rutile XRD peaks, the rutile XRD intensities for the T400-T films were stronger than those for the AT200-T films containing AuNPs when treated at the same post-heating temperatures.
XRD patterns for films of (a) T400-T, (b) AT200-T, and (c) AT400-T, and (d) particle sizes of TiO2 and AuNPs in films of T400-T, AT200-T, and AT400-T as a function of post-heating temperature.
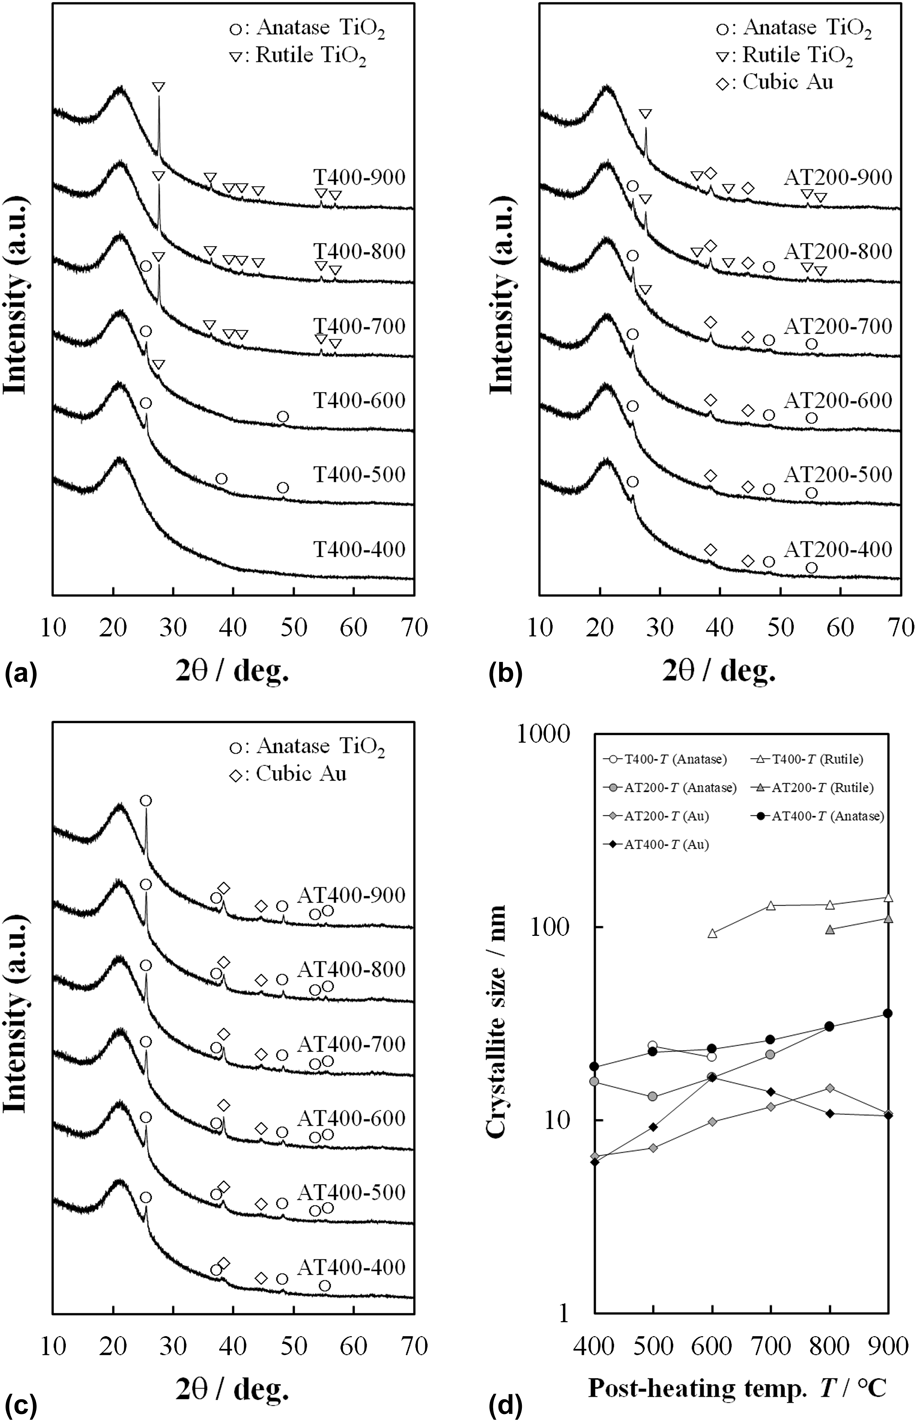
Crystallite sizes of anatase, rutile, and gold [Fig. 1(d)] were calculated from Scherrer’s formula using Scherrer’s constant of 0.89 for the anatase and rutile XRD peaks at 25.5° (101) and 27.6° (110), respectively, and 0.64 for the gold XRD peak at 38.2° (111). For the T400-T films, the calculated anatase crystallite size slightly decreased from 24.1 to 21.2 nm as T was increased from 500 to 600 °C, large rutile crystallites with an average size of 93.0 nm were suddenly formed as a result of the transformation at T = 600 °C, and the calculated rutile crystallite size increased further from 93.0 to 143.5 nm as T was increased from 600 to 900 °C. In the AT200-T films, the anatase crystallite size was calculated to have increased from 13.2 to 30.6 nm as T was increased from 400 to 800 °C, large rutile crystallites with an average size of 97.4 were calculated to have suddenly formed as a result of the transformation at T = 800 °C (similar to the case for T400-T) with the calculated rutile crystallite size having increased to 111.3 nm as T was increased further to 900 °C, and the calculated gold crystallite size increased from 6.5 to 14.6 nm as T was increased from 400 to 800 °C and then decreased from 14.6 to 10.8 nm as T was increased from 800 to 900 °C after the transformation from the anatase to rutile phase. In the AT400-T films, the anatase crystallite size was calculated to increase from 18.8 to 35.6 nm as T was increased from 400 to 900 °C, and the calculated gold crystallite size increased from 6.1 to 16.6 nm as T was increased from 400 to 600 °C and then decreased from 16.6 to 10.5 nm as T was increased from 600 to 900 °C, in which temperature range of the T400-T films without gold were transformed from the anatase to rutile phase.
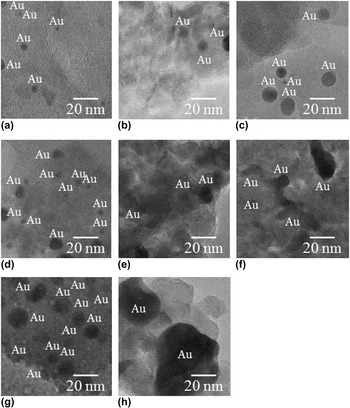
Typical TEM images of AT200-T and AT400-T films are shown in Fig. 2. For the AT200-400 film, the TiO2 crystal grain was hardly observed. Spherical Au grains with sizes of 2–5 nm, which appeared as dark-colored regions compared with regions consisting of titanium, were observed in the amorphous TiO2 region. For the AT200-500 films [Fig. 2(b)], TiO2 crystal grains with sizes smaller than 20 nm and spherical Au grains with sizes of 5–10 nm that were surrounded by the amorphous TiO2 and the TiO2 crystal grains, were observed. For the AT200-600 film [Fig. 2(c)], TiO2 crystal grains with sizes of about 20 nm and spherical Au grains with sizes of 2–15 nm in the TiO2 crystal grains were observed. The average sizes of the Au grains in the AT200-400, AT200-500, and AT200-600 films were 5.5, 6.3, and 11.0 nm, respectively. By contrast, the AT400-T films contained many TiO2 grains as compared with AT200-T films. For the AT400-400 film [Fig. 2(d)], TiO2 crystal grains with sizes of about 20 nm and spherical Au grains with sizes of 5–10 nm dispersed in the amorphous TiO2 and the TiO2 crystal grains were observed. For the AT400-500 film [Figs. 2(e) and 2(f)], TiO2 crystal grains with a size of about 20 nm, and spherical Au grains with sizes of 5–10 nm and aggregated Au grains surrounded by the TiO2 crystal grains were observed. For the AT400-600 film [Figs. 2(g) and 2(h)], TiO2 crystal grains with sizes of 20–40 nm, and spherical Au grains with sizes of 10–20 nm and aggregated Au grains in the TiO2 crystal grains were observed, and the traces of smaller Au grains with sizes of 5–10 nm in a leopard fur-like pattern due to the gold diffusion were also observed. The average sizes of the Au grains in the AT400-400, AT400-500, and AT400-600 films were 6.1, 8.3, and 13.6 nm, respectively.
TEM images of films of AT200-T [T = 400 (a), 500 (b), and 600 (c)] and AT400-T [T = 400 (d), 500 (e) and (f), and 600 (g) and (h)].

B. XANES analysis
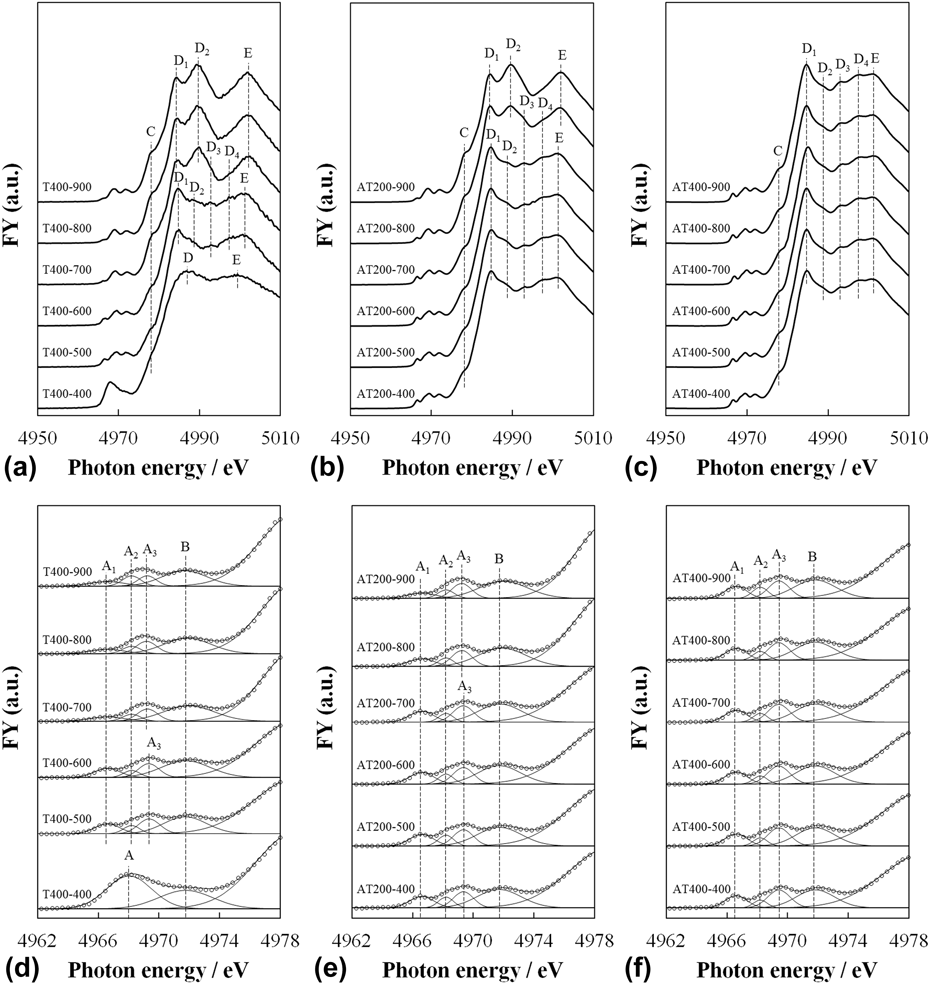
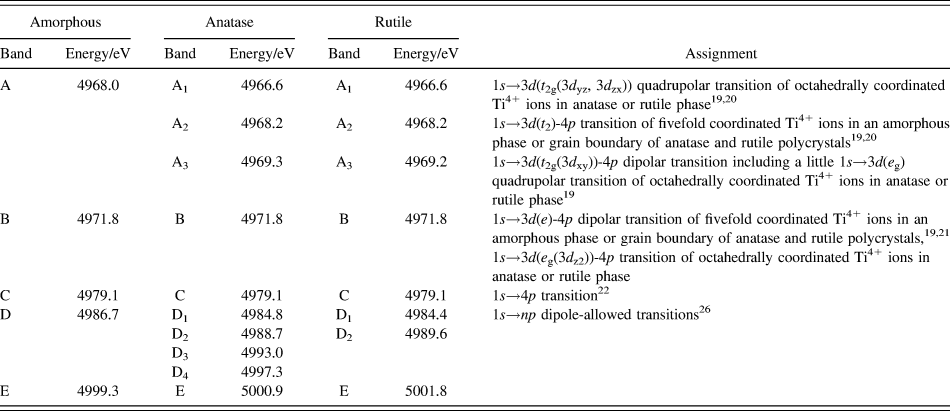
Ti K-edge XANES spectra and their pre-edge regions obtained from the T400-T, AT200-T, and AT400-T films are shown in Fig. 3. For the amorphous T400-400 film, the pre-edge region between 4960 and 4980 eV was deconvoluted by being fit with four Gaussian bands denoted as peaks A, B, C, and D, and for crystallized films of T400-T, AT200-T, and AT400-T, the pre-edge region was deconvoluted by being fit with six Gaussian bands denoted as peaks of A1, A2, A3, B, C, and D1. The energies and assignments of these bands are shown in Table I. For T400-T with T = 400 °C, peak A (transitions of 1s→3d and 1s→3d-4p hybridized states) and peaks D and E (1s→np dipole-allowed transition), all of which were related to the amorphous TiO2 phase, appeared at 4968.0, 4986.7, and 4999.3 eV, respectively. Peak B [pure dipolar transitions of 1s→3d(e g)-4p hybridized states] and peak C (1s→4p transition), both of which were observed in all of the TiO2 phases, appeared at 4971.8 and 4979.1 eV, respectively. Reference Yogi, Kojima, Hashishin, Wada, Inada, Gaspera, Bersani, Martucci, Liu and Sham15,Reference Wu, Ouvrard, Gressier and Natoli19–Reference Luca, Djajanti and Howe23 For T = 500 and 600 °C, eight peaks associated with an anatase phase appeared: A1 [quadrupolar 1s→3d(t 2g) transition] at 4966.6 eV, A2 [the other A series (1s→3d-4p hybridized states)] at 4968.2 eV, A3 [dipolar transition of 1s→3d(t 2g)-4p hybridized character, but also a small 1s→3d(e g) quadrupolar component] at 4969.3 eV, D1 at 4984.8 eV, D2 at 4988.7 eV, D3 at 4993.0 eV, D4 at 4997.3 eV, and E at 5000.9 eV, where the D1, D2, D3, D4, and E peaks were due to the 1s→np dipole-allowed transitions. Reference Yogi, Kojima, Hashishin, Wada, Inada, Gaspera, Bersani, Martucci, Liu and Sham15,Reference Wu, Ouvrard, Gressier and Natoli19–Reference Luca, Djajanti and Howe23 For T = 700–900 °C, the A1, A2, A3, D1, D2, and E peaks related to the rutile phase appeared at 4966.6, 4968.2, 4969.2, 4984.4, 4989.6, and 5001.8 eV, respectively, Reference Yogi, Kojima, Hashishin, Wada, Inada, Gaspera, Bersani, Martucci, Liu and Sham15,Reference Wu, Ouvrard, Gressier and Natoli19–Reference Luca, Djajanti and Howe23 where A1 showed a low intensity, A3 and D1 showed low energies, and D2 and E showed high energies compared with those of the anatase phase. In addition, for T = 700 °C, peaks D3 and D4 related to an anatase phase appeared at 4993.0 and 4997.3 eV, respectively. In the AT200-T films for T = 400–900 °C, peaks B and C appeared for all the TiO2 phases. For T = 400–700 °C, the eight peaks associated with an anatase phase appeared at 4966.6, 4968.2, 4969.3, 4984.8, 4988.7, 4993.0, 4997.3, and 5000.9 eV, and for T = 800 and 900 °C, the six peaks related to a rutile phase appeared at 4966.6, 4968.2, 4969.2, 4984.4, 4989.6, and 5001.8 eV. In addition, for T = 800 °C, peaks D3 and D4 related to an anatase phase appeared at 4993.0 and 4997.3 eV, respectively. The AT200-T films with T = 400–700 °C yielded generally weaker anatase and rutile diffraction peaks than did the T400-T and AT400-T films, but peak A2 was relatively strong. For all of the AT400-T films, eight peaks associated with an anatase phase appeared at 4966.6, 4968.2, 4969.4, 4984.8, 4988.7, 4993.0, 4997.3, and 5000.9 eV. In addition, peaks B and C appeared at 4971.8 and 4979.1 eV, respectively.
Ti K-edge XANES spectra [(a), (b), and (c)] and deconvolution of their pre-edge regions [(d), (e), and (f)]: films of T400-T [(a) and (d)], AT200-T [(b) and (e)], and AT400-T [(c) and (f)].

Energies and assignments of the bands for amorphous, anatase, and rutile phases.

C. Decrease in MB concentration using films under UV light
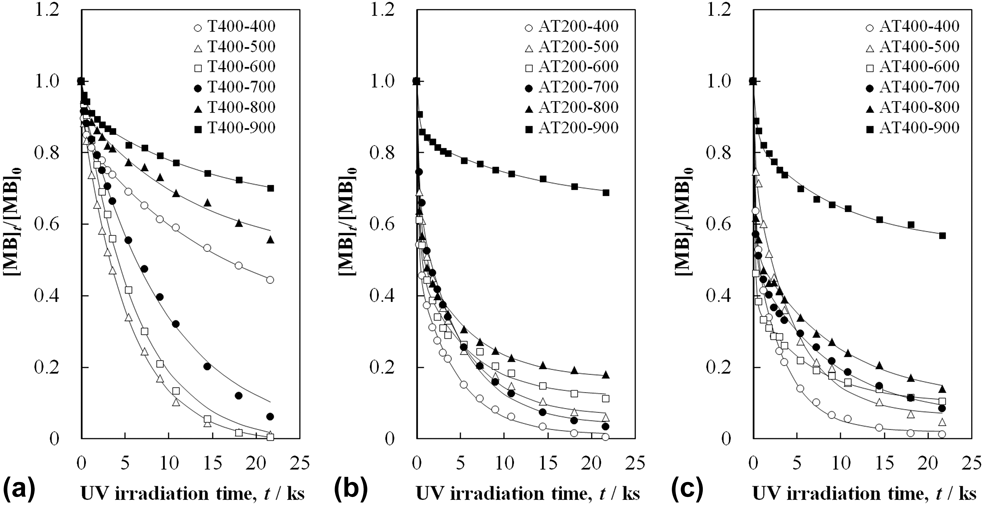
The relative concentration of MB, [MB] t /[MB]0, was found to decrease when it was exposed to UV irradiation in the presence of any of the T400-T, AT200-T, and AT400-T photocatalyst films, as shown in Fig. 4. In the presence of the T400-T films with T = 400 and 500 °C, [MB] t /[MB]0 decreased at similarly rapid rates at the initial stages up to a few ks, and then at the later stages relatively slowly for T = 400 °C but still quite rapidly for T = 500 °C. For T = 600–900 °C, the rate of decrease of [MB] t /[MB]0 at the initial and later stages was low as T was increased. For the AT200-T films, the rate of decrease of [MB] t /[MB]0 was highest at both the initial and later stages for T = 400 °C. With an increase in T, [MB] t /[MB]0 at the initial stages decreased slowly for T = 400–500 °C, decreased rapidly for T = 600 °C, and tended to decrease slowly for T = 700–900 °C. With an increase in T, [MB] t /[MB]0 at the later stages decreased slowly for T = 400–500 °C, decreased rapidly for T = 600 °C, and decreased slowly for T = 700–900 °C. For AT400-T, [MB] t /[MB]0 at the initial stages decreased slowly with an increase in T for T = 400–500 °C, decreased fastest for T = 600 °C, and decreased slowly with an increase in T for T = 700–900 °C. [MB] t /[MB]0 at the later stages decreased fastest for T = 400 °C and decreased slowly with an increase in T for T = 500–900 °C. Although [MB] t /[MB]0 decreased much more rapidly in the presence of any of the AT200-T and AT400-T films, that is, those containing AuNPs, than in the presence of any of the T400-T films, that is, those without AuNPs, [MB] t /[MB]0 eventually reached zero for only the T400-T films. For the T400-T, AT200-T, and AT400-T films, [MB] t /[MB]0 decreased fastest to each minimum value for T = 500, 400, and 400 °C, respectively.
Curves of relative concentration of MB, [MB] t /[MB]0 using T400-T (a), AT200-T (b), and AT400-T (c) films under UV irradiation.

IV. DISCUSSION
A. Assignments of absorption bands in XANES spectra
The XRD of T400-400 showed a halo pattern, indicative of its amorphous phase. This amorphous nature was also indicated by the five bands A, B, C, D, and E of its XANES spectrum, which were assigned to the electron transitions described in Sec. III. Reference Yogi, Kojima, Hashishin, Wada, Inada, Gaspera, Bersani, Martucci, Liu and Sham15,Reference Wu, Ouvrard, Gressier and Natoli19–Reference Luca, Djajanti and Howe23 In the XANES spectra for the T400-T films with T = 500–700 °C, AT200-T films with T = 400–800 °C, and AT400-T films with T = 400–900 °C, the A1, A2, A3, B, C, D1, D2, and E bands originated from the anatase phase and were assigned to the transitions mentioned above. Reference Yogi, Kojima, Hashishin, Wada, Inada, Gaspera, Bersani, Martucci, Liu and Sham15,Reference Wu, Ouvrard, Gressier and Natoli19–Reference Luca, Djajanti and Howe23 In addition, in these spectra, the D3 and D4 bands were also associated with the anatase phase. The T400-T films with T = 700–900 °C and AT200-T films with T = 800 and 900 °C that yielded strong rutile XRD peaks showed XANES spectra featuring the eight bands A, A2, A3, B, C, D1, D2, and E that differed from those of an anatase phase, and these eight bands were related to the transitions in a rutile phase as described above. Reference Yogi, Kojima, Hashishin, Wada, Inada, Gaspera, Bersani, Martucci, Liu and Sham15,Reference Wu, Ouvrard, Gressier and Natoli19–Reference Luca, Djajanti and Howe23 The T400-600 and the AT200-700 films that yielded weaker rutile XRD peaks than anatase XRD peaks showed XANES spectra exhibiting a slight decrease in the intensity of the A1 band.
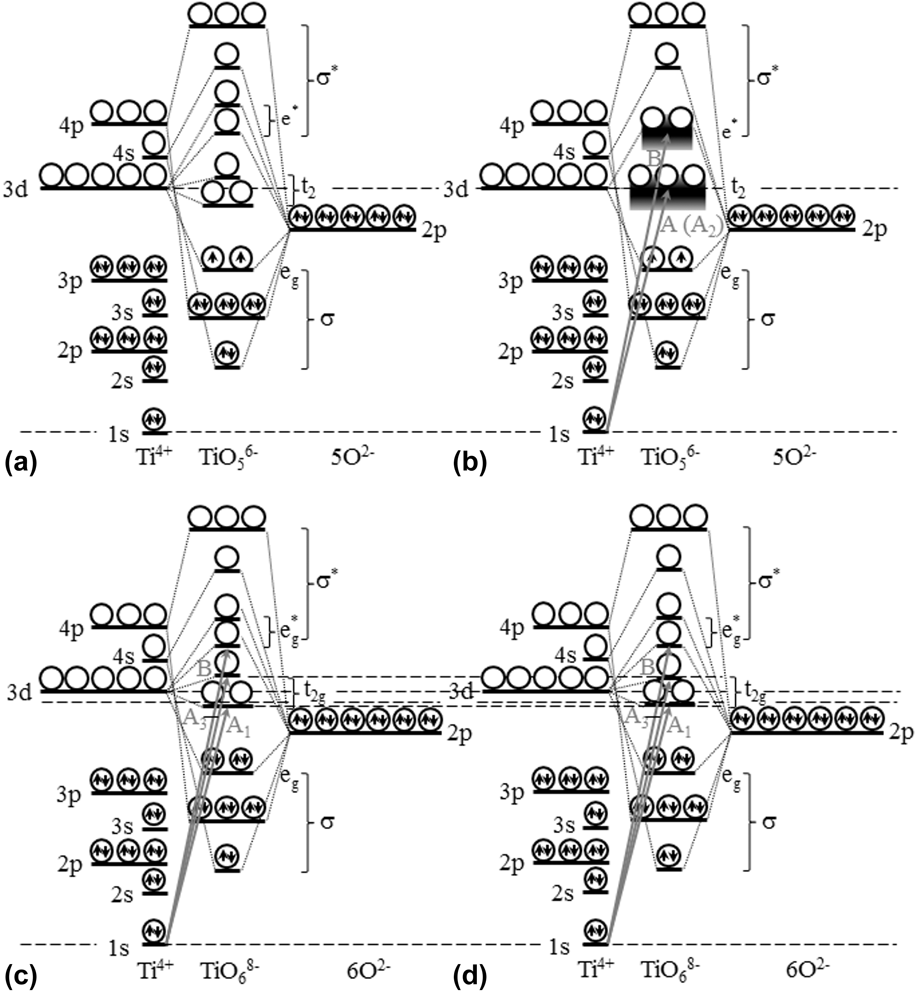
Using the pre-edge region of Ti K-edge XANES spectra, Farges et al. Reference Farges, Brown and Rehr24 investigated the relationship between the coordination number of Ti and the energy and intensity of the pre-edge band in various titanium compounds [Ni2.6Ti0.7O4, Ni2.4Ti0.7Si0.05O4, β-Ba2TiO4, α-Ba2TiO4, CsAlTiO4, Rb2TiO3, K6Ti2O7, Y2TiMoO8, Na4TiO4, KNaTiO3, Ba2TiSi2O8, Sr2TiSi2O8, Ba2TiGe2O8, Na2Ti4O9, K2Ti4O9, Rb2Ti4O9, K2Ti2O5, r-TiO2 (rutile), a-TiO2 (anatase), CaTiO3, BaTiSi3O9, KNa3LiFe2Ti2Si8O24, FeTiO3, CaTiSiO5, TiZrO4, and Ca3(Ti,Zr)2(Si,Al2)O12] and suggested how to determine the coordination number of a Ti4+ ion in a titanium-based multiple oxide using this relationship. In ionic crystals consisting of polyhedrons with a little distortion and with strong ionic Ti–O bonds that are expected for r-TiO2 (rutile), a-TiO2 (anatase), CaTiO3, and BaTiSi3O9, a strong band due to the 1s→3d transition in a fourfold-, fivefold-, or sixfold-coordinated Ti4+ ion appeared in the pre-edge region. Although the A band for the T400-400 film was broad because of its amorphous phase, its intensity appeared as strong as the pre-edge bands observed in the above ionic crystals. For both anatase and rutile phases, which have Ti–O bonds with high covalent character, three bands, namely, A1, A2, and A3, have been reported in the pre-edge region. Farges et al. Reference Farges, Brown and Rehr24 have related the energy of the A3 band to the coordination number of Ti4+ because the intensity of the A3 band is greater than those of the other pre-edge bands. Energy diagrams for fivefold-coordinated Ti4+ ions in an amorphous phase and sixfold-coordinated Ti4+ ions in anatase and rutile phases are shown in Fig. 5. The amorphous T400-400 film was indicated to consist of fivefold-coordinated Ti4+ ions because the strong A band appeared at 4968.0 eV in the pre-edge region as reported previously. Reference Manzini, Antonioli, Bersani, Lottici, Gnappi and Montenero25,Reference Manzini, Antonioli, Lottici, Gnappi and Montenero26 The energy levels of the t 2 and e orbitals for the fivefold-coordinated Ti4+ ions in an amorphous phase were determined not to split as they would for a bipyramidal-type geometry [Fig. 5(a)] but to form broad bands as shown in Fig. 5(b). This energy level formation was attributed to the fivefold-coordinated Ti4+ ions in an amorphous structure showing various geometries because of the different Ti–O bond lengths and O–Ti–O bond angles. As a result of these observations and interpretations, the A and B bands were assigned to the 1s→3d(t 2) and 1s→3d(e) transitions of the fivefold-coordinated Ti4+ ions, respectively, as shown in Fig. 5(b). In the geometrically distorted sixfold-coordinated Ti4+ ions for anatase and rutile structures, five degenerate 3d orbitals were indicated to be split into three degenerate t 2g orbitals and two-degenerate e g orbitals as a result of the sixfold coordination, and in addition, the t 2g and e g orbitals were indicated to be split into the two degenerate 3d yz and 3d zx(t 2g) orbitals and the 3d xy(t 2g) orbital, and into the 3d z2(e g) and 3d x2–y2(e g) orbitals, respectively, because of the distortion as shown in Figs. 5(c) and 5(d). In the TiO6 8− octahedrons, two edges are shared in the rutile structure, but four edges are shared in the anatase structure. As a result, compared with the rutile structure, the Ti4+ octahedrons in the anatase structure, which consists of the Ti–O bonds with the stronger covalent bonding, are distorted more. Therefore, the gap between the energy levels of the two-degenerate 3d yz(t 2g),3d zx(t 2g) orbital and the 3d xy(t 2g) orbital and the gap between the energy levels of the 3d z2(e g) and 3d x2–y2(e g) orbitals for Ti4+ ions in the anatase structure are larger than the corresponding two energy gaps in the rutile structure. As a result, although the anatase phase A1 band appeared at the same energy level as did the rutile phase A1 band, the anatase phase A3 band appeared at an energy level higher than that of the rutile phase A3 band. The A1 and A3 bands were attributed, respectively, to the 1s→3d yz,3d zx(t 2g) and 1s→3d xy(t 2g) transitions of the sixfold-coordinated Ti4+ ions with high covalent character. The structure of the grain boundaries in the anatase and rutile polycrystals were observed to be similar to that of the amorphous phase, and therefore, the A2 band was the same as the A band and was attributable to the 1s→3d(t 2g) transition of the sixfold-coordinated Ti4+ ions. The B band resulted from the 1s→3d(e g) transition of both the sixfold-coordinated Ti4+ ions in the anatase and rutile phases and the fivefold-coordinated Ti4+ ions in their grain boundaries. The assignments and energies of these bands are shown in Table I, which includes assignments in previous reports as mentioned above. The intensities of the A1, A2(A), A3, and B bands were changed depending upon whether the phase is amorphous phase, anatase polycrystal phase, or rutile polycrystal phase because these intensities were influenced by the crystal structures, specifically the local structures (coordination number, bonding length, bonding angle, and geometry), by the ionic and covalent characters of the Ti–O bonds, and by the crystallite sizes that closely relate to the amounts of grain boundaries with amorphous state-like structures.
Energy diagrams of fivefold-coordinated Ti4+ ions in bipyramidal type (a) and in amorphous phase (b), sixfold-coordinated Ti4+ ions in anatase (c), and rutile (d) phases.

B. Characterization and phase transformations
The amorphous nature of the T400-400 film was evident from both the lack of any discrete XRD peaks [Fig. 1(a)] and the presence of the A, B, C, D, and E XANES peaks [Figs. 3(a) and 3(d)]. All of the T400-T, AT200-T, and AT400-T films except for the T400-400 film yielded some aspects of the XRD patterns of anatase and rutile TiO2 and of Au, as shown in Fig. 1, and XANES peaks A1–E, as shown in Fig. 3. Therefore, the T400-T films were characterized by their crystal phases and sizes as follows: the T400-500 film formed by an anatase TiO2 phase with a 24.1-nm crystallite size, the T400-600 film consisting primarily of an anatase phase with a 21.2-nm crystallite size and to a minor extent of a rutile phase with a 93-nm crystallite size, the T400-700 film consisting primarily of a rutile phase with a 130-nm crystallite size and to a minor extent of an anatase phase, the T400-800 film formed by a rutile phase with a 131-nm crystallite size, and the T400-900 film formed by a rutile phase with a 144-nm crystallite size. The AuNP crystallite sizes calculated from Scherrer’s formula agreed with those observed using TEM (Fig. 2), and the AuNPs were therefore considered to consist of single crystals with the size shown in Fig. 1(d). The AT200-T films were characterized by their crystal phases and sizes as follows: the AT200-400 film formed by an anatase phase with a 15.7-nm crystallite size and containing both 6.1-nm single-crystal AuNPs and some amorphous phase, the AT200-500 film formed by an anatase phase with a 13.2-nm crystallite size and containing both 7.2-nm single-crystal AuNPs and some amorphous phase, the AT200-600 film formed by an anatase phase with a 16.6-nm crystallite size and containing both 9.8-nm single-crystal AuNPs and some amorphous phase, the AT200-700 film formed by an anatase phase with a 27.7-nm crystallite size containing both 11.8-nm single-crystal AuNPs and minor amounts of amorphous and rutile phases, the AT200-800 film consisting of an anatase phase with a 30.6-nm crystallite size and a rutile phase with a 96.4-nm crystallite size and containing 14.6-nm single-crystal AuNPs, and the AT200-900 film formed by a rutile phase with a 111-nm crystallite size and containing 10.8-nm single-crystal AuNPs. The AT400-400, AT400-500, AT400-600, AT400-700, AT400-800, and AT400-900 films were determined to consist of anatase phases with 18.8-, 22.6-, 23.3-, 26.0-, 30.6-, and 35.6-nm crystallite sizes and containing 6.1-, 9.2-, 16.6-, 14.0-, 10.9-, and 10.5-nm aggregated single-crystal AuNPs in their grain boundaries, respectively.
Several of our results provided information on the crystallization of the anatase TiO2 phase from the amorphous phase. The AT200-T and AT400-T films, that is, the films containing AuNPs, crystallized into the anatase TiO2 phase at lower temperatures than did the T400-T films. Based on this result, we concluded that the AuNPs promoted nucleation of the anatase TiO2 phase, which means that the AuNPs acted as anatase nucleation agents. In AT200-T and AT400-T anatase films with T = 400 and 500, the intensities of the anatase XRD peaks for the AT400-T film were stronger than those for the AT200-T, and hence, nucleation and growth of the anatase crystals were promoted with an increase in the preheating temperature. The anatase crystallinity of the AT400-T films was therefore concluded to be higher than that of the AT200-T films. We also obtained results that can explain the phase transformation from anatase to rutile. In the T400-T and AT200-T films, the transformation occurred at T = 600 and 700 °C, respectively, when the anatase crystals that had an average crystallite size of 22 nm were transformed into rutile crystals with dimensions of 93–97 nm. The anatase, brookite, and rutile phases have been reported to be stable for the crystallite sizes of 14 nm or below, 14–35 nm, and 35 nm or above, respectively. Reference Zhang and Banfield27 By contrast, for TiO2–ZrO2 composite nanoparticles, the anatase phase has been reported to be stable for crystallite sizes of between 18 and 36 nm, due to the effect of the addition of ZrO2. Reference Pfleiderer, Lützenkirchen-Hecht and Frahm28 Therefore, the transformation in the T400-600 and AT200-700 films was determined to be caused by the significant growth of the anatase crystals. The Ti4+ octahedrons in the anatase structure were observed to be more distorted than those in the rutile structure, and stress due to the distortion accumulated with the growth of the crystals; the transformation from the anatase phase to the rutile phase has been proposed to relax the stress. The transformation in AT200-T films occurred at higher heating temperatures of T = 700 and 800 °C. This transformation is caused by the growth of anatase crystals as well as in T400-T. For AT200-T films compared with T400-T films, the anatase crystallinity is high and the anatase crystallite size is small, and therefore, large numbers of anatase crystals with small crystallite size are crystallized due to the presence of the nucleation agent of AuNPs. As a result, the growth of anatase crystals is repressed by the neighboring anatase crystals, and the anatase to rutile transformation due to this growth occurs at higher post-heating temperatures in AT200-T films than in T400-T films. The suppression of the transformation in AT400-T films is considered as follows: for AT400-T with higher preheating temperature than AT200-T, the anatase nucleation ability is much higher, and a lot of small anatase crystals with the same crystallite size as T400-T are crystallized due to the presence of the nucleation agent of AuNPs. Therefore, the growth of anatase crystals is suppressed by the neighboring small anatase crystals, and consequently the transformation from anatase into rutile is repressed. In addition, it is possible that gold diffusion relates to the suppression of the transformation in the AT400-T films since the traces of the Au grains in Fig. 2(g) were observed at T = 600 at which the transformation occurred in T400-T films.
C. Adsorption ability and UV-photocatalytic activity
As reported previously, Reference Tsumura, Kojitani, Izumi, Iwashita, Toyoda and Inagaki29,Reference Janus, Kusiak-Nejman and Morawski30 not only the photocatalytic reaction of a film but also the adsorption on the film decreases MB concentration. Wu et al. proposed a kinetic model of this photocatalytic process using TiO2 powder, where MB is decomposed after being adsorbed onto the surface of the powder. Reference Wu and Chern31 We think that this model was proposed because the powder has both the irradiated and non-irradiated areas. We have already reported that the photocatalytic degradation of MB leads to the successive demethylations of MB to azure B (AB), then azure A (AA), followed by azure C (AC) and finally thionine (Th). Reference Yogi, Kojima, Wada, Tokumoto, Takai, Mizoguchi and Tamaki32 Therefore, the decrease in [MB] is caused by the following simultaneous reactions:
 $${\rm{MB\ }} ⇄ {\rm{\ M}}{{\rm{B}}^*}\quad ,$$
 $${\rm{MB\ }} \to {\rm{\ AB\ }} \to {\rm{\ AA\ }} \to {\rm{\ AC\ }} \to {\rm{\ Th}}\quad ,$$
where MB is MB in an aqueous solution and
 ${\rm{M}}{{\rm{B}}^*}$
is MB adsorbed on a film. In the present work, we derived a kinetic model dealing only with the demethylation of MB in an aqueous solution containing desorbed MB. According to this model, when the adsorption reaction (2) is faster than the photocatalytic reaction (3), the photocatalytic reaction (3) would become blocked by
 ${\rm{M}}{{\rm{B}}^*}$
covering the film. As a result, the final MB concentration, [MB]∞ would not be able to decrease to zero but instead would remain constant at some nonzero concentration ([MB]∞/[MB]0 ≠ 0) for such films as shown in Fig. 4. Assuming that the production and decay of AA, AB, AC, and Th do not compete with the adsorption and demethylation of MB, the rate equations for MB corresponding to reactions (2) and (3) would then be
 $${{{\rm{d}}{{\left[ {{\rm{MB}}} \right]}_t}} \over {{\rm{d}}t}} = - {k_{\rm{a}}}{\left[ {{\rm{MB}}} \right]_t} + {k_{\rm{d}}}\left[ {{\rm{M}}{{\rm{B}}^*}} \right]$$
and
 $${{{\rm{d}}{{\left[ {{\rm{MB}}} \right]}_t}} \over {{\rm{d}}t}} = - {k_{\rm{p}}}{\left[ {{\rm{MB}}} \right]_t}\quad ,$$
respectively, where k a, k d, and k p are the adsorption, desorption, and photocatalytic degradation rate constants of MB, respectively. Considering an adsorption equilibrium constant K a,
 $${K_{\rm{a}}} = {{\left[ {{\rm{M}}{{\rm{B}}^*}} \right]} \over {\left[ {{\rm{MB}}} \right]}}\quad ,$$
the reaction rate Eqs. (4) and (5) were solved as
 $${\left[ {{\rm{MB}}} \right]_t} = {\left[ {{\rm{MB}}} \right]_0}\exp \left[ { - ({k_{\rm{a}}} - {k_{\rm{d}}}{K_{\rm{a}}})t} \right]$$
and
 $${\left[ {{\rm{MB}}} \right]_t} = {\left[ {{\rm{MB}}} \right]_0}\exp \left[ { - {k_{\rm{p}}}t} \right]\quad ,$$
respectively. For the case of the photocatalytic reaction (3) being blocked by the adsorption reaction (2), [MB] t /[MB]0 was derived from Eqs. (7) and (8) by a linear combination,
 $${{{{\left[ {{\rm{MB}}} \right]}_t}} \over {{{\left[ {{\rm{MB}}} \right]}_0}}} = {r_{\rm{a}}}\exp \left[ { - ({k_{\rm{a}}} - {k_{\rm{d}}}{K_{\rm{a}}})t} \right] + {r_{\rm{p}}}\exp \left[ { - {k_{\rm{p}}}t} \right] + {{{{\left[ {{\rm{MB}}} \right]}_\infty }} \over {{{\left[ {{\rm{MB}}} \right]}_0}}}\quad ,$$
where r a and r p are the reaction ratios of adsorption and photocatalysis, respectively and k a − k d K a is an apparent rate constant of adsorption. Equation (10) was used to relate r a, r p, and [MB]∞/[MB]0 to each other.
 $$1 - {{{{\left[ {MB} \right]}_\infty }} \over {{{\left[ {MB} \right]}_0}}} = {r_{\rm{a}}} + {r_{{\rm{p}}\quad }}.$$
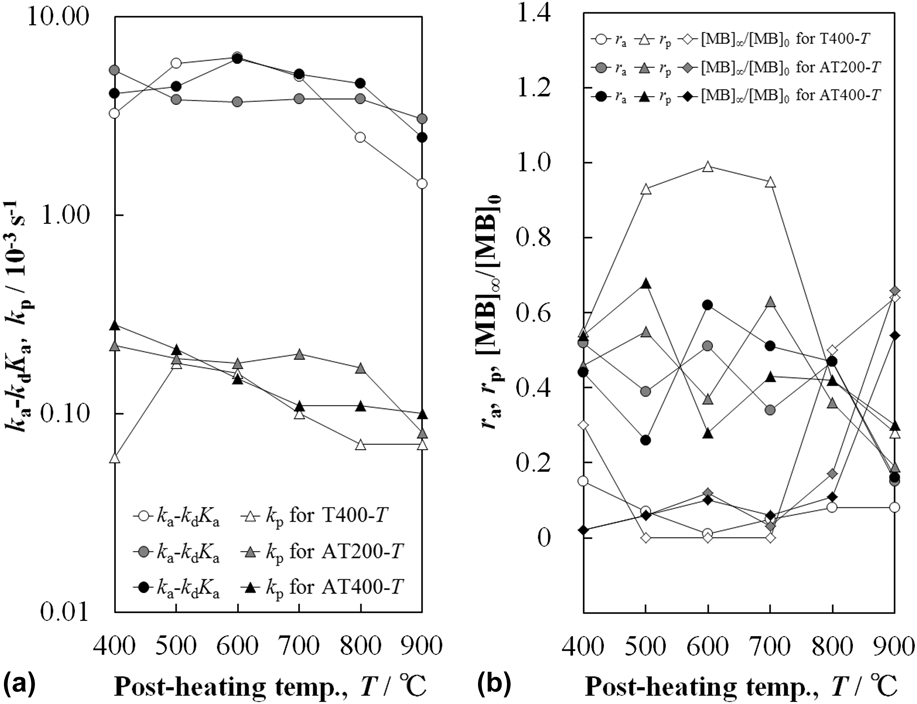
Curves fitting Eq. (9) to the experimental data are shown in Fig. 4 and their r a, k a − k d K a, r p, k p, and [MB]∞/[MB]0 values are shown in Fig. 6. As shown in Fig. 4, the fitting curves well matched the [MB] t /[MB]0 experimental data.
Apparent rate constant of adsorption (k a − k d K a), and photocatalytic degradation rate constant (k p) (a), reaction ratio of adsorption (r a), reaction ratio of photocatalysis (r p), and [MB]∞/[MB]0 (b) for T400-T, AT200-T, and AT400-T films as a function of post-heating temperature.

The apparent adsorption rate constant (k a − k d K a) for the T400-T films tended to increase as T was increased from 400 to 600 °C, attributed to the crystallization of anatase and the increase of its crystallinity, and then to decrease as T was further increased from 600 to 900 °C, due to the transformation from the anatase phase to the rutile phase with its larger crystallite size and the growth of the rutile crystals. This k a − k d K a value for AT200-T films with low TiO2 crystallinity was determined to slightly decrease as T was increased from 400 to 600 °C due to the crystallization of anatase and to slightly increase as T was further increased to 800 °C due to the transformation from the anatase phase to the rutile phase with its larger crystallite size, and then to decrease from 800 to 900 °C due to the growth of the rutile crystals. The value of k a − k d K a for the AT400-T films was determined to increase as T was increased from 400 to 600 °C, due to the growth of the anatase crystals and the increase of crystallinity, and then to decrease as T was further increased to 900 °C due to the further growth of the crystals. The changes in these k a − k d K a values were probably caused by the changes in the surface area due to the crystallization of anatase from the amorphous state, the transformation from anatase to rutile, their crystal growth, and so on.
As reported previously, Reference Xu, Shi, Fan, Dong, Shi and Hu1,Reference Yu, Zhao and Zhao4,Reference Yu, Yu and Zhao5 the photocatalytic activity of TiO2 was lower for its amorphous form than for its rutile form and was greatest for anatase. Moreover, smaller crystallites of anatase TiO2 showed higher photocatalytic activities. Therefore, the rate constant of the photocatalytic reaction, k p, for the T400-T films increased as T was increased from 400 to 500 °C because of the crystallization of anatase, then decreased as T was further increased to 600 °C because of the growth of the anatase crystals and the transformation from an anatase phase to a rutile phase, and then markedly decreased as T was increased from 600 to 900 °C because of the transformation from an anatase phase to a rutile phase and the growth of the rutile crystals. For Au–TiO2, the closer the size of the AuNPs was to 3 nm, the higher was the photocatalytic activity because of the blocking of the recombination of photogenerated electron–hole pairs resulting from the trapping of electrons by the AuNPs. Reference Li, Suyoulema, Wang and Sarina12 We also determined the k p values for the AT200-T and AT400-T films containing AuNPs with particle sizes greater than 3 nm. The k p values of such AT200-T films with T = 400–700 °C were similar because of the low crystallinity of the anatase phase, but the k p for AT200-T was determined to significantly decrease as T was increased from 800 to 900 °C because of the transformation from an anatase phase to a rutile phase and the growth of rutile crystals. For the AT400-T films, the k p value was determined to significantly decrease as T was increased from 400 to 700 °C, attributed to the growth of both the anatase crystals and the AuNPs; and then, the k p value was determined to slowly decrease as T was further increased to 900 °C despite the growth of the anatase crystals due to recrystallization of small AuNPs. Compared with the T400-T films, the AT200-T and AT400-T films, which contained AuNPs, showed high k p values, indicating that the AuNPs were inhibiting the recombination of photogenerated electron–hole pairs and enhancing the photocatalytic activity as reported previously. Reference Li, Suyoulema, Wang and Sarina12 Consequently, the AT200-400 and AT400-400 films consisting of anatase and AuNPs with smaller crystallite sizes were determined to have high photocatalytic reaction rates and large k p values, that is, high photocatalytic activity.
For the T400-T films, the ratio of the photocatalytic reaction, r p, was much greater than that of adsorption reaction, r a. Therefore, the photocatalytic reaction was hardly affected by the adsorption reaction, and the [MB]∞/[MB]0 value reached zero at T = 500–700 °C. Particularly, though the k p value for the T400-600 film, which consisted primarily of anatase phase and a minor amount of the rutile phase, was determined to be lower than that for the T400-500 film, which was composed of the anatase phase, the r p value for the T400-600 film was determined to be higher than that for the T400-500 film. For the T400-400 film, which was amorphous, and for the T400-800 and T400-900 films, each composed of the rutile phase, the r p values were low despite the small r a value, and therefore, the adsorption reaction blocked the photocatalytic reaction from occurring. As a result, the [MB]∞/[MB]0 value did not reach zero. For the AT200-T and AT400-T films, as T was increased from 400 to 800, the r a and r p values tended to decrease, though they were distributed between 0.26 and 0.68, and the [MB]∞/[MB]0 value tended to increase from 0.02 to 0.17 as the r p value decreased. As T was increased from 800 to 900, the r a and r p values decreased, and the [MB]∞/[MB]0 value increased because of a decrease in the r p value. Therefore, for the AT200-T and AT400-T films, the MB concentration rapidly decreased due to both the high adsorption reaction and the high photocatalytic reaction, in contrast to the case for T400-T. Although the [MB]∞/[MB]0 value did not reach zero, the desorption and demethylation of MB occurred after the adsorption stopped, allowing for the possibility of [MB]∞/[MB]0 reaching zero. Therefore, for the AT200-400 and AT400-400 films, the photocatalytic activity was enhanced due to the high adsorption reaction ratio because of the effect of AuNPs.
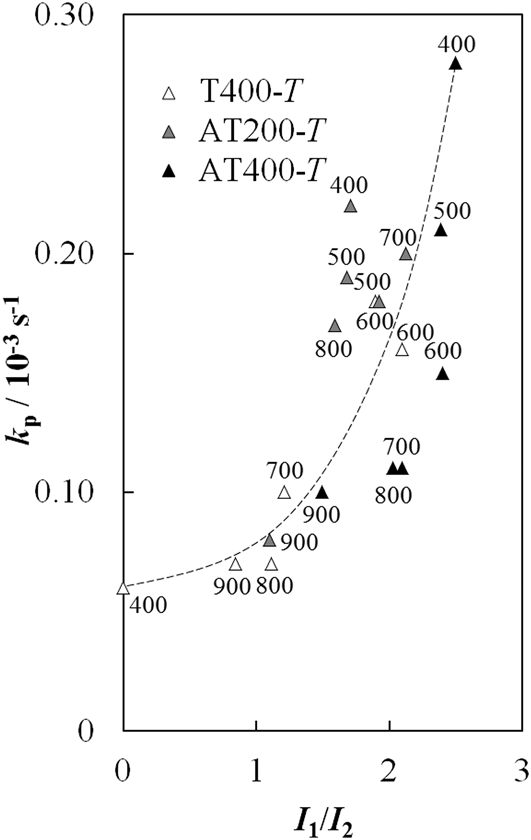
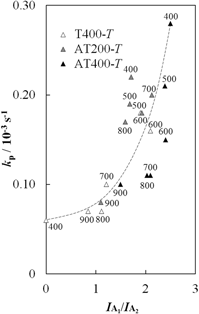
A relationship between anatase crystallite size and the ratio of the integrated intensity of the A2 band to that of the A3 band (I 2/I 3) in the pre-edge region of Ti K-edge XANES spectra was reported in a previous paper Reference Luca, Djajanti and Howe23 because the A2 and A3 bands relate to fivefold-coordinated Ti4+ ions on the surface of anatase particles and sixfold-coordinated Ti4+ ions in the anatase crystals. Reference Farges, Brown and Rehr24 Judging from the assignments of the bands mentioned above, in the samples consisting of amorphous and anatase phases, assuming that the A band corresponds to the A2 band, the ratio of the amount of the amorphous phase to the amount of the anatase phase can be estimated from the I 2/I 3 value. In addition, in the anatase samples with various crystallite sizes, the size of the region displaying an anatase grain boundary-like structure resembling an amorphous phase was found to increase with decreasing anatase crystallite size, and therefore, the anatase crystallite size can be estimated from the I 2/I 3 value. Moreover, the photocatalytic activity can then be described by using the I 2/I 3 value, which is a parameter related to the ratio of the amount of the amorphous phase to the amount of the anatase phase and related to the anatase crystallite size. In addition, since the intensity of the A2(A) band is mainly influenced by ionic and covalent characters, I 2/I 3 is a measure of ionic bonding. The intensity of the A1 band related to the 3d yz and 3d zx orbitals was expected to be stronger than that of the A3 band related to the 3d xy orbital in sixfold-coordinated Ti4+ ions, and therefore, an integrated intensity of the A1 (I 1) band is better to use on behalf of that of A3 (I 3) in a point of accuracy. Consequently, the ratio of the integrated intensity of the A1 band to that of the A2 band (I 1/I 2), which provides information on the covalent bonding in contrast to the ionic bonding information provided by I 2/I 3, should be used to estimate photocatalytic activity. A relationship between the k p and I 1/I 2 values, interpolated by a dashed curve, is shown in Fig. 7. The k p value was found to increase with an increase in the I 1/I 2 value and to reach to a maximum value at I 1/I 2 ≈ 3. In the T400-T films, the k p value increased with an increase in the I 1/I 2 value in the order T400-400, T400-900, T400-800, T400-700, T400-600, and T400-500 due to differences in the relative amounts of amorphous, rutile, and anatase phases in the different films. Therefore, the k p value increased with an increase in conductivity resulting from the formation of the conduction band because the covalent character increases in the order of the amorphous, rutile, and anatase phases. All of the AT200-T films and the AT400-400 and AT400-500 films showed k p values greater than that of the interpolated curve, while the AT400-600, AT400-700, AT400-800, and AT400-900 films showed k p values smaller than that of the interpolated curve. The former set of films was observed to have AuNPs dispersed in the crystal, while the latter films showed aggregated AuNPs in the crystal grains, and this difference apparently influenced both the conductivity and the k p value. Consequently, the AT400-400 film, which consisted of small anatase crystals with high covalent character and high crystallinity, contained dispersed AuNPs with smaller crystallites and showed a larger k p value than did the other films tested.
Relationship between the photocatalytic degradation rate constant (k p) and I 1/I 2 values.

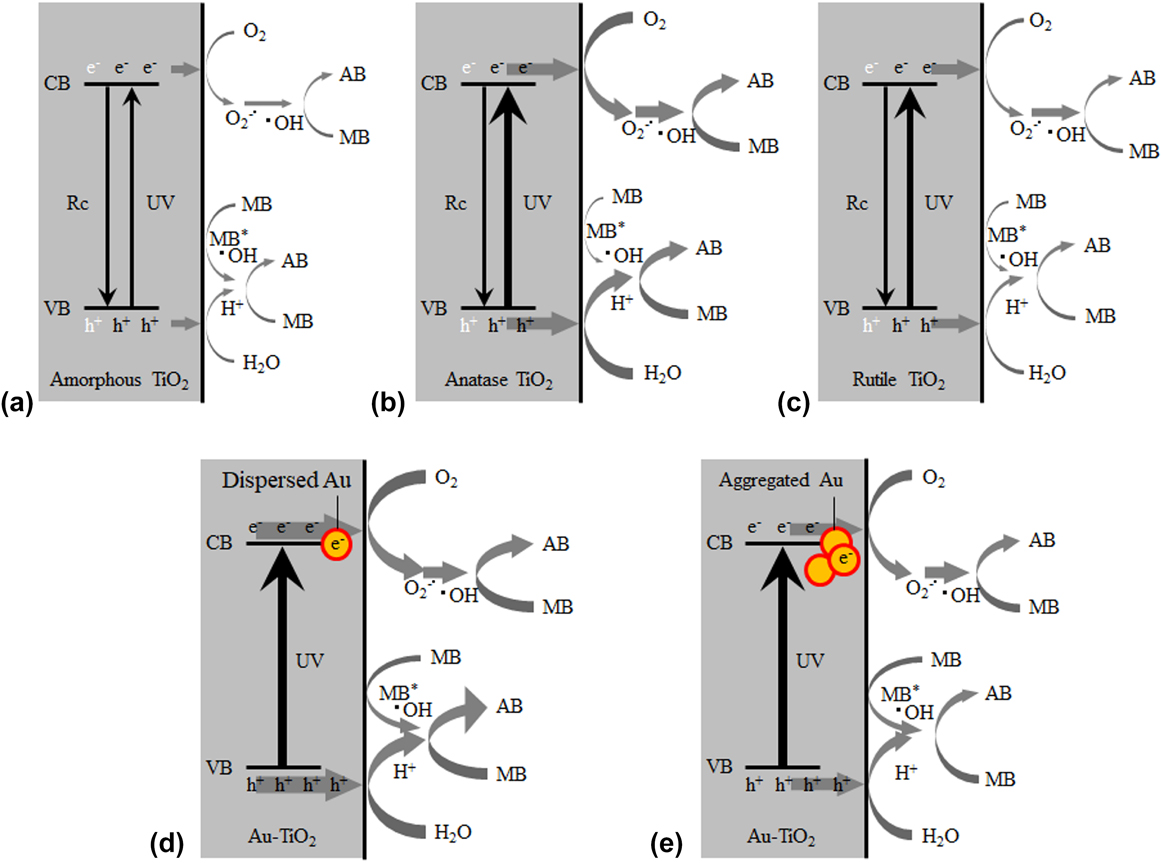
A model for the photocatalytic reaction processes using TiO2 and Au–TiO2 films was derived and is shown in Fig. 8. Very little MB adsorbed onto the amorphous TiO2 (T400-400), anatase TiO2 (T400-500, T400-600), and rutile TiO2 (T400-700, T400-800, T400-900) films as shown in Figs. 8(a), 8(b) and 8(c), respectively, according to their small r a values. In addition, these films apparently had small quantities of carriers (electrons in the conduction band and holes in the valence band), as a result of recombination of photogenerated electron–hole pairs (Rc) occurring easily in these films, as compared with the Au–TiO2 films. Moreover, due to the conductivity of the anatase phase being greater than that of the rutile phase, and least for the amorphous phase, and due to the conductivity increase with a decrease in the anatase crystallite size in anatase TiO2 films, the photocatalytic reaction rate was increased. Consequently, of these TiO2 films, the T400-500 film, which consisted of an anatase phase with small crystallites, showed the highest photocatalytic activity due to the high adsorption reaction and photocatalytic reaction rates and caused mainly demethylation of MB in the photocatalytic reaction process as shown in Fig. 8(b). For the anatase TiO2 films with dispersed AuNPs (AT200-400, AT200-500, AT200-600, AT200-700, and AT400-400) and anatase TiO2 films with aggregated AuNPs (AT400-500, AT400-600, AT400-700, AT400-800, and AT400-900) as shown in Figs. 8(d) and 8(e), the inclusion and state of the AuNPs influenced the photocatalytic reaction processes. In particular, the adsorption reaction occurred for these films more easily, that is, faster, than for any of the TiO2 films since the polar MB molecules adsorbed on these TiO2 films as a result of an electric field generated by electrons trapped in the AuNPs and holes trapped in the TiO2 crystals. The increase in the photocatalytic reaction ratio was attributed to increase in the quantities of the carriers resulting from inhibition of the recombination of photogenerated electron–hole pairs. However, as mentioned above, the AuNPs dispersed in the TiO2 crystals apparently did not influence the conductivity, while the aggregated AuNPs in the TiO2 crystal grains apparently diminished the conductivity. Consequently, the AT400-400 film, which consisted of small anatase crystals with high covalent character and high crystallinity and contained the dispersed AuNPs, caused demethylation of both the adsorbed MB and the dissolved MB by the photocatalytic reaction enhanced by the dispersed AuNPs as shown in Fig. 8(c) and furthermore showed the highest photocatalytic activity.
Photocatalytic processes for TiO2 films of amorphous (a), anatase (b), and rutile (c) phases, and those for Au–TiO2 films containing dispersed (d) and aggregated (e) AuNPs. Rc shows a recombination of photogenerated electron–hole pairs.

V. CONCLUSIONS
We prepared TiO2 (T400-T) films by carrying out dip-coating with preheating at 400 °C and post-heating at T = 400–900 °C. The T400-500 film, that is, that post-heated at 500 °C, crystallized into an anatase phase. We also prepared Au–TiO2 (AT200-T and AT400-T) films by carrying out dip-coating with preheating at 200 or 400 °C and post-heating at T = 400–900 °C. The AT200-400 and AT400-400 films, that is, those post-heated at 400 °C, crystallized into an anatase phase because the AuNPs acted as nucleation agents. The phase transformation from anatase to rutile for the T400-T and AT200-T films occurred at T = 600 and 700 °C, respectively, because of the growth of the anatase crystals regardless of dispersed AuNPs. Conversely, for AT400-T, a lot of small anatase crystals crystallize due to the presence of the nucleation agent of AuNPs, and therefore, the growth of anatase crystals are suppressed by the neighboring small anatase crystals, resulting in repression of the transformation from anatase to rutile. Of the various T400-T films tested, the T400-500 film showed the highest photocatalytic reaction rate and hence highest photocatalytic activity, which were attributable to this film consisting of the anatase phase with the smallest crystallites; compared to the amorphous and rutile phases, anatase has been shown to display higher covalent character and higher conductivity and hence to produce a higher photocatalytic reaction rate. In the AT200-T and AT400-T films, the AuNPs enhanced not only the photocatalytic reaction rate by inhibiting a recombination of photogenerated electron–hole pairs but also the adsorption reaction by producing an electric field generated by electrons trapped in AuNPs and holes trapped in TiO2 crystals. Of all the films we tested, AT400-400, which consisted of the anatase phase with high crystallinity and small crystallites, contained dispersed AuNPs with the smallest average crystallite size and showed the highest photocatalytic activity. This high activity resulted from the high adsorption reaction and photocatalytic reaction rates.