1. Introduction
As a clean energy source, shale gas emits lower greenhouse gases than petroleum and coal. The outstanding achievements in exploration and exploitation of shale gas in North America has led to increased shale gas exploration worldwide (Stephenson, Reference Stephenson2016). Compared with North America, Southern China has experienced multi-stage tectonic activities, with problems such as the development of fault systems, strong tectonic deformation, complex surface conditions and complex in situ stress state (Zou et al. Reference Zou, Dong, Wang, Li, Li, Wang, Li and Cheng2010; Han et al. Reference Han, Zhang, Li, Horsfield, Tang, Jiang and Chen2013; Tang et al. Reference Tang, Jiang, Jiang, Cheng and Zhang2017; Wan et al. Reference Wan, Tang and Pan2017; Zhang et al. Reference Zhang, Littke, Zieger, Shabani, Tang and Zhang2019). In the complex structural areas of Southern China, shale gas has developed rapidly and achieved world-renowned results; several shale gas demonstration areas have been built, such as the Fuling Shale Gas Field and Weiyuan Shale Gas Field (Wang et al. Reference Wang, Liu, Dong, Zhao and Du2013; Luo et al. Reference Luo, Zhong, Dai and Zhang2016; Ma & Xie, Reference Ma and Xie2018). The Lu-203 well recently deployed in the Yixian area of the Sichuan Basin has achieved a test daily production of 1.379 million cubic metres (Mm3), and it has become China’s first shale gas well with a daily test production of > 1 Mm3. As another main field of shale gas exploration in China, the breakthrough of Anye-1 well in northern Guizhou shows that the area has a high potential for shale gas exploration. Previous researchers have conducted a lot of research on shale pore structure and its adsorption mechanism (Slatt & O’Brien, Reference Slatt and O’Brien2011; Chalmers et al. Reference Chalmers, Bustin and Power2012; Chen et al. Reference Chen, Jiang, Liu, Gao and Wang2017; Sun et al. Reference Sun, Yu, Hu, Zhang, Li, Yang, Melnichenko and Cheng2017; Wang et al. Reference Wang, Lu, Wang, Liu, Peng, Zhan and Li2018; Bhowmik & Dutta, Reference Bhowmik and Dutta2019). They observed shale micro-pore structure and its connectivity through field emission scanning electron microscope (FE-SEM), computerized tomography (CT) scanning and transmission electron microscope (TEM), and divided the pores into macro-pores (> 50 nm), meso-pores (2–50 nm) and micro-pores (< 2 nm). Combined with nuclear magnetic resonance (NMR), CO2 adsorption, N2 adsorption experimental results, pore development characteristics and main control factors have been analysed (Thommes et al. Reference Thommes, Kaneko, Neimark, Olivier, Rodriguez-Reinoso, Rouquerol and Sing2015).
However, the influence of differential structural deformation on pore structure, pore type and adsorption capacity are rarely studied. Under high temperatures and high pressures, the shale has strong plasticity and is prone to slip along the layer, forming low-angle shear fractures, fracture zones or folds. These change the organic matter and mineral structure of the shale, and then affect the pore structure and fracture development degree in the shale reservoir, resulting in greater changes in pore types and their structural evolution (Ross & Bustin, Reference Ross and Bustin2009; Ding et al. Reference Ding, Li, Li, Xu, Jiu, Zeng and Wu2012; Yang et al. Reference Yang, Ning, Zhang, Zhao and Krooss2015; Wang et al. Reference Wang, Zhu, Liu and Zhang2016; Zhang et al. Reference Zhang, Li, Xie, Li, Zhang, Sun and Wang2018 a). We therefore focus on the selection of organic-rich shale samples from the Longmaxi Formation in the study area. For shale samples with different deformation modes and degrees, whole-rock analysis, thin-section microscopy, scanning electron microscopy and N2 adsorption experiments were carried out to study the influence of differential structural deformation mode on pore structure and the adsorption performance of a shale reservoir.
2. Geological setting
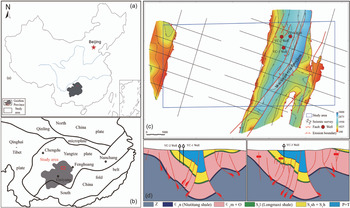
The study area is located in the complex structural area of Southern China. The Fenggang Block experienced multi-phase Caledonian, Hercynian, Indosinian, Yanshanian and Himalayan tectonic movements, and two major uplifting and denudation in the Indosinian and Yanshanian periods, with cumulative denudation thickness exceeding 5000 m (Han et al. Reference Han, Zhang, Li, Horsfield, Tang, Jiang and Chen2013; Tang et al. Reference Tang, Jiang, Jiang, Li, He, Long and Zhu2019). It is only deposited in the interior of Wuchuan synclinorium and the NW of the study area, with the deepest burial depth of 3800 m (Fig. 1). The lower Palaeozoic strata are mainly exposed in the western area, and some of the lower Silurian strata remain in the NW. The altitude is generally around 800–1200 m. In the eastern area, the upper Palaeozoic and Mesozoic strata are mainly exposed, and the altitude is generally around 700–1100 m. The fault system in the study area is well developed; the faults are mainly reverse, some of which are strike-slip, and mostly NE- and NNE-striking with large dip angle of 50–80°. The distribution of strata is controlled by fault development, and the occurrence of strata is complex. There are three wells drilled in the Longmaxi Formation, namely YC-1, YC-2 and YC-3. From the field analysis of gas volume in the study area (Table 1), the weak structural deformation zone is also favourable for shale gas preservation; it also provides storage space and a migration channel for shale gas to a certain extent.
(a, b) Location of the study area. (c) Buried depth map of Longmaxi shale in the study area. (d) Seismic cross-section for wells YC-1, YC-2 and YC-3. Z – Sinian; ϵ – Cambrian; S – Silurian; O – Ordovician; P+T – Triassic and Permian; ϵ1m – Mingxinsi Formation of Cambrian; S1sh – Shiniulan Formation of Silurian; S1h – Hanjiadian Formation of Silurian.

Results of shale gas content test

3. Materials and methods
The samples of this study are from the cores of Longmaxi Formation of three wells in the study area. The thickness of the Longmaxi Formation in the study area is 95–170 m, and the lithology is mainly grey silty shale, grey siliceous shale, black mudstone and carbonaceous shale. Total organic carbon (TOC) content ranges from 0.39% to 9.24%, with an average of 1.72%. The equivalent vitrinite reflectance R 0 is distributed between 1.27% and 3.07%, and the kerogen type index is between 78.3 and 92. The content of brittle minerals in Longmaxi shale is relatively high, and the average content of quartz, feldspar, pyrite and other brittle minerals is 56.7% (Table 2). The experimental methods include TOC, kerogen macerals analysis, vitrinite reflectance (R 0), X-ray diffraction (XRD) analysis of whole-rock and clay minerals, thin-section microscopy, SEM observation and low-pressure nitrogen adsorption.
Mineral and TOC content of Longmaxi shale in the Fenggang Block

TOC content was measured using a CS-200 carbon sulphur analyser at 25°C and 60% relative humidity (RH) according to GB/T 19145-2003 (Xu et al. Reference Xu, Gao, Dong and Wang2003). Vitrinite reflectance and kerogen macerals were measured by micro photometer according to SY/T 5118-2005 and SY/T 5125-2014 respectively (Wang et al. Reference Wang, Meng, Zhu, Fang, Xu, Zhang, Lv and Zhang2005; Xu et al. Reference Xu, Kong, Fei, Wang, Weng, Wang and Ma2014). Whole-rock and clay mineral components were analysed using an X’pert Powder X-ray diffractometer of Panalytical company; the test basis was SY/T 6210-1996 (Wang et al. Reference Wang, Lin, Bao, Han and Wang1996). The micro-structural characteristics of shale were observed using a FE-SEM of Fei quanta 200 F, and the test basis was GB/T 16594-2008 (Zhang et al. Reference Zhang, Lu, Deng, Ding, Liu, Gao and Xu2008); the low-pressure nitrogen adsorption was determined by ASAP 2460 specific surface area and porosity adsorption apparatus, and the test basis was GB/T 19587-2004 (Wei et al. Reference Wei, Li, Wang and Zhang2004).
4. Results and discussion
4.a. Types and characteristics of slip rheological deformation in shale
Shale slip rheological deformation refers to a migration process of solid matter driven by a given tectonic stress. In this process, solid matter migrates and redistributes in a given direction from macro to micro to adapt to the new tectonic environment (Liang et al. Reference Liang, Wang, Gao, Li and Li2017; Li et al. Reference Li, Jiang, Liang, Yu and Yang2019). In the case of plastic strain, the organic-rich shale can be regarded as a solid rheology that undergoes shear rupture and deformation (Ju et al. Reference Ju, Sun, Tan, Bu, Han, Li and Fang2018; Ma et al. Reference Ma, Ardakani, Zhong, Liu, Huang, Larter and Zhang2019). However, when under the effects of long-term, slow strain, the slip rheology will appear similar to that of liquid, and rheological folding often occurs. Due to the obvious differences in mechanical properties of different shale lithofacies (Table 3), the different stress conditions, and the varying physical and chemical environment, brittle deformation, ductile deformation and deformation between them therefore will occur. On the basis of distinguishing between macro and micro scales, the shale slip rheological deformation structure is mainly divided into two categories: ductile-slip rheological deformation (DD) and brittle-slip rheological deformation (BD).
Static rock mechanical properties of Longmaxi shale with different lithology in the Fenggang Block

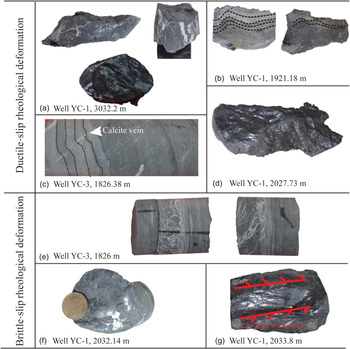
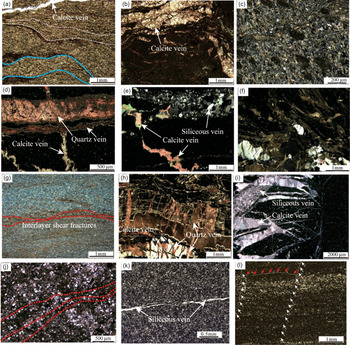
Ductile-slip rheological deformation is mainly formed by the slow creep deformation of plastic shale under low strain rate for a long time. This kind of low-speed creep deformation is only possible under specific temperature and pressure conditions, and mainly manifests as uncoordinated fold deformation. DD can be divided into several types (Table 4) according to the shale matrix texture, mineral deformation and structural characteristics, as well as changes in the properties of micro-fractures. DD is usually manifest in the form of calcite vein, pyrite vein and quartz vein etc., forming complex recumbent, skew and flattened folds (Reference Zhang, Li, Lu, Huang and YinZhang et al. 2018b ; Zhu et al. Reference Zhu, Ju, Qi, Huang and Zhang2018). In addition, for the silty shale on the core scale it can be seen that the calcite veins have fold deformation and collaborative deformation with the argillaceous layer and the crumpled lens formed by the interlayer slip (Fig. 2a–d). Thin-section observation revealed that calcite veinlets develop directionally and are complicated by folds, S-C fabric characteristics of quartz and other granular minerals, and rheological fold phenomena such as pressure shadow (Fig. 3a–f).
Types and genetic mechanism of slip rheological deformation in shale

Slip rheological deformation characteristics of shale cores. (a) Crumpled deformation of calcite vein; (b) calcite slips along the layer and produces fold deformation in accordance with argillaceous layer; (c) crumpled deformation of silty and argillaceous layer, and then cut off by calcite vein; (d) crumpled lens formed by interlayer slip; (e) multiple groups of high-angle fractures, filled with calcite, showing complex cross-cutting relationships; (f) low-angle slip fractures and a smooth frictional mirror can be seen; and (g) multiple rows of low-angle slip fractures; see smooth friction mirror surface.

Characteristics of slip rheological deformation under microscope. (a) Silty shale, silty and argillaceous bands show two stages of fold deformation, and a large number of calcite veins develop directionally. (b) A large number of calcite veins are directionally developed and complicated by folds, with a maximum vein width of 2 mm. (c) Silicification is strong, developing S-C fabric characteristics. (d) Calcite veins develop directionally, and quartz veins are complicated by folds. (e) Two stages of vein body: early folded calcite vein body, cut through by later siliceous vein body. (f) The rock is severely broken; like a pressure shadow, the core crystal is quartz, showing left-side shearing. (g) Silty shale; interlayer shear fractures formed between silty and argillaceous layers. (h) A large number of calcite and quartz veins are directionally developed and inter-penetrated with a maximum width of about 1 mm. (i) Calcite veins and silicified veins are developed after rock fragmentation, with a width of 0.04–0.4 mm. The minerals in the veins are mainly sparry calcite and siliceous, some of them not filled. (j) Along the quartz grain, a large number of directional micro-fractures are developed. (k) Silty shale, siliceous vein in echelon arrangement. (l) Two groups of shear fractures.

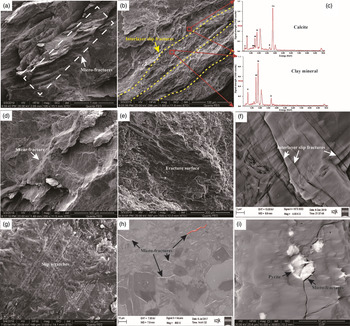
Brittle-slip rheological deformation refers to time-dependent deformation generated in the brittle deformation domain, which generally shows the fracture and fragmentation phenomena in shale under high strain rate (Figs 2e, 3h, i). During the process of fine-granulation a series of micro-fractures are generated, and the particles can be observed to move in a given direction of shear under the microscope. Another type of BD is interlayer slip along the pre-existing weak plane of rock mechanics (usually bedding plane) in shale, forming low-angle slip fractures; a smooth frictional mirror can be observed (Fig. 2f, g). Under SEM, middle- and low-angle micro-fractures and interlayer slip fractures formed by the interlayer slip can be observed (Fig. 4a, b); these fractures are mostly unfilled or partially filled. High-angle shear fractures develop (Fig. 4d), which promotes effective communication between interlaminar fractures, provides an important space for shale gas storage and migration, and enhances the seepage ability of the shale reservoirs. In addition, slip marks and mirror scratches were observed (Fig. 4e, g). There are many rows of smooth scratches or steps on the surface. Micro-fractures in echelon arrangement parallel to the layer can be seen, which is partially filled with calcite to form calcite veins (Fig. 4h). It was also observed that structural fractures cut through pyrite crystals (Fig. 4i). These fractures are not well-developed and have a small aperture of 50–200 nm, but they have a long length and can connect to other types of pores and fractures to form an intricate three-dimensional seepage network.
Microscopic pore characteristics in brittle-slip rheological deformed shale. (a) Middle- and low-angle micro-fractures formed by slip shear between calcite layers. (b) Low-angle interlayer slip fractures formed by different rock mechanics interlayer slip (calcite and clay mineral layer). (c) Energy spectrum characteristics of calcite and clay mineral layer. (d) High-angle shear fracture formed by interlayer slip. (e) Mirror features on low-angle slip fracture surface. (f) Interlayer slip fractures, parallel to or at low angles to the bedding. (g) Slip scratches on the calcite mineral surface. (h) Micro-fractures developed along the interface of solid particles (calcite or quartz) or crystals, which are arranged en echelon and filled with calcite. (i) Micro-fractures developed along pyrite crystals.

4.b. Pore types and characteristics of slip rheological deformation shale
Through high-power focused ion beam SEM we can observe the micro-slip shale rheological deformation characteristics, and the micro-pore deformation and micro-fracture related to the deformation. Loucks et al. (Reference Loucks, Reed, Ruppel and Hammes2012) proposed a trichotomy for shale matrix pores, namely intergranular pores, intragranular pores and organic pores. According to the pore structure and occurrence, Yu (Reference Yu2013) divided shale pores into organic matter pores, mineral matrix pores and micro-fractures; mineral matrix pores are further divided into intergranular pores and intragranular pores. Various types of micro-pores, such as organic pores, intergranular pores, intragranular pores, intracrystalline pores and micro-fractures, are developed in the deformed shale of Longmaxi Formation in the study area. The structure and pore characteristics of shale reservoirs not only affect the gas storage and adsorption capacity, but also gas migration (He et al. Reference He, Wang, Yu, Liu, Ge, Yang, Wang and Lu2018).
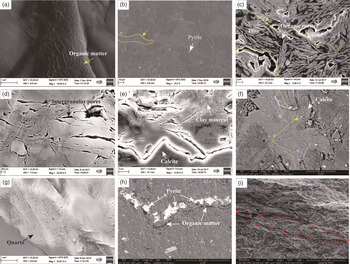
Under the microscope, the DD shale presents the crumpled deformation of the organic-rich layer (Fig. 5a, b) or the mixed crumpled deformation of the organic matter and clay mineral layer (Fig. 5c), resulting in the residual organic matter pores or clay mineral intergranular pores being squeezed and deformed or even collapsed entirely. In addition, in the process of interlayer slip-forming fold structure, sporadic intergranular pores or intercrystalline pores can also be seen (Fig. 5d–g). These pores are in the shape of long strips and fissures that do not extend far, with a certain directional arrangement and connectivity. Similarly, the collaborative fold deformation of calcite veins and organic matter belt can also be observed under the microscope. We observed that organic matter pores are not developed and that some pores remain between pyrite crystals (Fig. 5h); we also observed the phenomenon of calcite extrusion lens (Fig. 5i).
Microscopic pore characteristics in ductile-slip rheological deformed shale. (a) Organic matter bands with strong fold deformation. (b) Collaborative deformation of organic matter and clay mineral layer, in which pyrite is sporadically distributed. (c) The organic matter and illite clay minerals are squeezed and deformed, and the organic matter (OM) pores are flattened or even disappeared. (d) The layered clay minerals have folded deformation and visible intergranular pores. (e) Calcite has kink-fold deformation characteristics, and the clay mineral layer above it has uncoordinated fold deformation. (f) Interlayer slip has occurred between calcite, forming folds. (g) Quartz mineral has kink-fold deformation characteristics and visible intercrystalline pores. (h) Collaborative deformation of organic matter and pyrite crystals, resulting in strong fold deformation. (i) Interlayer slip has occurred between calcite, forming folds; calcite extrusion lens phenomenon can be observed.

However, the shale slip rheological deformation is a continuous process, and different levels of rheological states can appear over different periods and at different tectonic positions, forming rheological deformation structures of varying types and strengths. The two modes of rheological deformation of shale slippage should therefore not be completely separated, especially for a study area that has experienced multiple periods of tectonic influences; such an area may have experienced multiple transitions of brittle-slip rheology or ductile-slip rheological deformation, or it may exist in a transition state between two types of rheological deformation.
4.c. Effect of slip rheological deformation on shale pore structure
Many scholars have employed techniques such as low-pressure nitrogen adsorption, methane isotherm adsorption, carbon dioxide adsorption, nuclear magnetic resonance and high-pressure mercury injection to characterize the pore structure and adsorption capacity of shale in different areas (Yang et al. Reference Yang, He, Hu, Sun, Hu and Yi2017; Yao & Liu, Reference Yao and Liu2018; Zhu et al. Reference Zhu, Ju, Qi, Huang and Zhang2018). However, the influence of differential structural deformation on the pore structure of shale reservoir is seldom discussed.
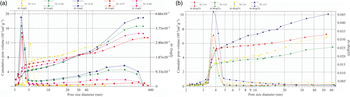
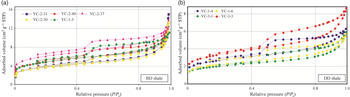
For this study, shale samples with different slip rheological deformation were selected for investigation by low-pressure nitrogen adsorption using ASAP 2460 specific surface area and porosity adsorption apparatus. It can be seen from Figure 6 that the pore size distribution of DD shale is mainly concentrated at 3–5 nm (Fig. 6b). Although there are multiple peaks in the pore size distribution curve of BD shale, the pore size is also mainly concentrated at 3–5 nm (Fig. 6a). According to the classification of adsorption hysteresis loop by the International Union of Pure and Applied Chemistry (IUPAC) (Sing, Reference Sing1985), the adsorption–desorption loop of BD shale samples mainly shows an H3 loop, while only some samples show an H4 loop (Fig. 7a). The connectivity of pores is related to the rising rate of the adsorption line; the faster the rise, the better the connectivity of pores. The regular degree of pore shape is related to the size of the hysteresis loop; the smaller the hysteresis loop, the greater the regularity (Thommes et al. Reference Thommes, Kaneko, Neimark, Olivier, Rodriguez-Reinoso, Rouquerol and Sing2015; Zhang et al. Reference Zhang, Liu, Pang, Lin, Bai and Wang2016). This indicates that the pore structure of the BD shale sample is mainly composed of open pores such as parallel plate-shaped pores and slit-shaped pores that open at both ends, that is, micro-fractures that are connected to each other with a large fracture length.
Pore size diameter distribution of Longmaxi shale: (a) brittle- and (b) ductile-slip rheological deformation, where dv(logd) and dv/dlog(D) represent the pore size distribution for small and large pores, respectively.

N2 adsorption–desorption isotherms of shale samples for (a) brittle- and (b) ductile-slip rheological deformation. STP – standard temperature and pressure. P/P 0 – ratio of absorbate pressure P to saturated vapour pressure P 0.

In contrast, the adsorption–desorption loops of DD shale samples mainly show H2 loops; a small number of samples show H3 loops (Fig. 7b). This shows that during the rheological deformation of ductile slip, the shale pores are deformed by strong crumpling; pores are mainly in the shape of a cone, ink bottle or slit (Zhang et al. Reference Zhang, Li, Wei, Gao, Liang, Wang and Wang2017; Wu et al. Reference Wu, He, He, Zhai, Xia, Yang, Dong and Peng2019). The rate of increase and the hysteresis loop of the BD shale (YC-1-5) and the DD shale (YC-1-4) are both large, indicating that the porosity of the shale is relatively open; however, the pore shape tends to be irregular. The pore connectivity of BD shale is generally better than that of DD shale, and the pore morphology also tends to be more regular.
The pore parameters of the nitrogen adsorption experimental and mineral composition of XRD results are shown in Table 5. In different deformed shale samples, the total pore volume (1.8–2.4 × 10⁻² cm3 g–1) of BD shale samples is higher than that of DD shale samples (0.8–1.6 × 10⁻² cm3 g–1). There is a positive correlation between the total pore volume and quartz content (Fig. 8), that is, with the increase of quartz content, the total pore volume of shale increases gradually. This shows that, on the one hand, the increase of quartz content in the deformed shale samples and resulting relatively hard texture means that the samples keep some intergranular pores in the process of deformation]; on the other hand, the quartz vein or strip and the organic matter or clay mineral layer are easy to slip between layers and form a large number of micro-fractures, which increases the volume of the meso-pores and macro-pores in the shale samples, increasing the total pore volume. This phenomenon indicates that the quartz content in the deformed shale has a strong influence on the development of shale pore types and the size of the pore volume. In addition, the specific surface area (12–18 m2 g–1) of the shale samples with brittle rheological deformation is larger than that of the shale samples with ductile rheological deformation (6–12 m2 g–1). However, for the relationship between the specific surface area of shale pores and the content of clay minerals, there are some differences among differently deformed shale samples. The pore specific surface area of DD shale increases with an increase in clay mineral content; this indicates that the existence of a clay mineral layer enhances the ability of interlayer slip, while interlayer shear fracture makes the particle more fragmented, increasing the pore specific surface area of shale. In the BD shale, the specific surface area of pores shows a weak negative correlation with the increase of clay mineral content. It is possible that the pore volume obtained by low-pressure nitrogen adsorption mainly includes micro-pore and meso-pore volume. Brittle deformation produces more macro-pores (or micro-cracks), but these pores cannot be obtained by low-pressure nitrogen adsorption. Moreover, quartz, feldspar, carbonate and other brittle minerals are often found in the intragranular and intergranular pores, mainly meso-pores and macro-pores. With an increasing quartz content, the specific surface area decreases. This reduction may mean that intergranular pores or dissolution pores may have relatively small surface areas (Ju et al. Reference Ju, Sun, Tan, Bu, Han, Li and Fang2018).
Mineral composition and pore structure characteristics of shale samples

Relationship between (a) total pore volume and quartz content and (b) specific surface area and clay content of deformed shale.

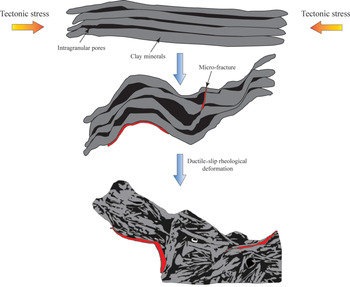
Organic pores are rare in these two types of deformed shales, and sporadically developed organic pores have small pore size, poor connectivity and appear as scattered and isolated flat ellipsoids. This is because of the strong plasticity of organic matter, which is more prone to fold deformation under the action of compressive stress, meaning that the pores are easily compressed until they collapse entirely, that is, more obviously affected by tectonic action. Brittle-slip rheological deformation can produce intergranular meso- and macro-pores among brittle minerals, and ductile-slip rheological deformation can also develop more intragranular meso- and macro-pores among clay minerals during layer slip formation (Fig. 9). Although all the deformed shale samples can be observed to have abundant micro-fractures under SEM, the scale, fracture length and connectivity of the micro-fractures are quite different among the shale samples with different types of rheological deformation. The micro-fractures developed in BD shale have the characteristics of large scale, obvious directionality, far lateral extension and strong connectivity. However, the micro-fractures developed in the ductile-slip rheological deformation shale are mainly due to the formation of folds in the layer slip. The micro-fractures developed in these samples are therefore smaller in scale and shorter in fracture length, but have strong local connectivity.
The process of ductile-slip rheological deformation of clay minerals.

Different slip rheological deformation types have varying degrees of influence on shale pore structure. On the one hand, there are more brittle minerals such as quartz in the shale which has brittle-slip rheological deformation. This kind of hard brittle mineral can play a supporting role in the process of structural extrusion deformation, and protect the intergranular pores developed between particles. On the other hand, in this process of interlayer shear deformation, a large number of micro-fractures with strong directivity, larger length and mutual communication can also be formed, providing shale gas with certain storage space and important seepage channels; brittle-slip rheological deformation therefore has a positive impact on the improvement of shale porosity and seepage capacity. In the ductile rheological deformation shale, a large number of organic pores will be squeezed until entirely collapsed. However, in the process of fold formation of organic matter and clay mineral complex layer, a large number of clay mineral intergranular pores are formed; some organic pores can be retained in the clay mineral interlayer, and some micro-fractures can be formed in the process. In addition, the brittle minerals are relatively developed in the BD shale, and the interlayer shear action forms a micro-fracture with large fracture length and good lateral communication; this results in a high brittleness and the micro-fracture development of the Longmaxi shale, which is conducive to the later fracturing reconstruction.
5. Conclusions
-
(1) The differential structural deformation in the Longmaxi shale in the study area has enhanced the heterogeneity of the shale reservoir. According to the bedding rheological deformation mechanism of shale, it can be divided into brittle-slip rheological deformation and ductile-slip rheological deformation. Within all the deformed shale samples, abundant micro-fractures can be observed under SEM. However, in the shale samples with different types of rheological deformations, there is a large difference in the scale, fracture length and lateral connectivity of the micro-fractures.
-
(2) The micro-fractures in the DD shale are mainly produced in the process of fold formation as a result of layer slip. The micro-fractures in these samples are therefore small in scale and fracture length, but have strong local connectivity; The brittle minerals in the BD shale are relatively developed, and the interlayer shearing action forms micro-fractures with large fracture length and good lateral communication; this results in higher shale brittleness and micro-fracture development, which is conducive to later fracturing.
-
(3) In differently deformed shale samples, the total pore volume (1.8–2.4 × 10⁻² cm3 g–1) of BD shale samples is higher than that of DD shale samples (0.8–1.6 × 10⁻² cm3 g–1), and there is a positive correlation between the total pore volume and quartz content. In addition, the specific surface area (12–18 m2 g–1) of the shale samples with brittle rheological deformation is larger than that of the shale samples with ductile rheological deformation (6–12 m2 g–1). Different deformation mechanisms and shale mineral contents lead to the different types of shale pore structure. Brittle deformation produces more macro-pores and micro-cracks, while ductile deformation produces more micro- and meso-pores.
Acknowledgements
This research was supported by the National Natural Science Foundation of China (project nos 41072098 and 41372139), the National Major Science and Technology Specific Projects of China (nos 2016ZX05034-004-003 and 2016ZX05046-003) and the China Geological Survey Project (grant no. DD20190414).