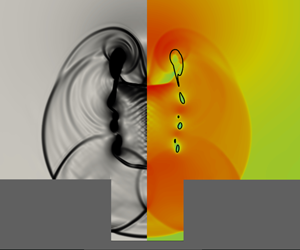
1. Introduction
Cavitation damage can result from the collapse of vapour bubbles formed in low-pressure regions of a flow, typically at gas nuclei that exist in the free stream or in crevices on surfaces. When collapse occurs near a surface, the emitted shock waves (Rayleigh Reference Rayleigh1917; Hickling & Plesset Reference Hickling and Plesset1964) impinge on nearby surfaces (Benjamin, Ellis & Bowden Reference Benjamin, Ellis and Bowden1966; Plesset & Chapman Reference Plesset and Chapman1971) where, depending on the surface geometry and material properties, they can cause erosion or ablation. The importance of surface geometry, in conjunction with the fact that these low-pressure regions occur more frequently at rough surfaces, motivates the investigation of bubble collapse behaviour near solid walls.
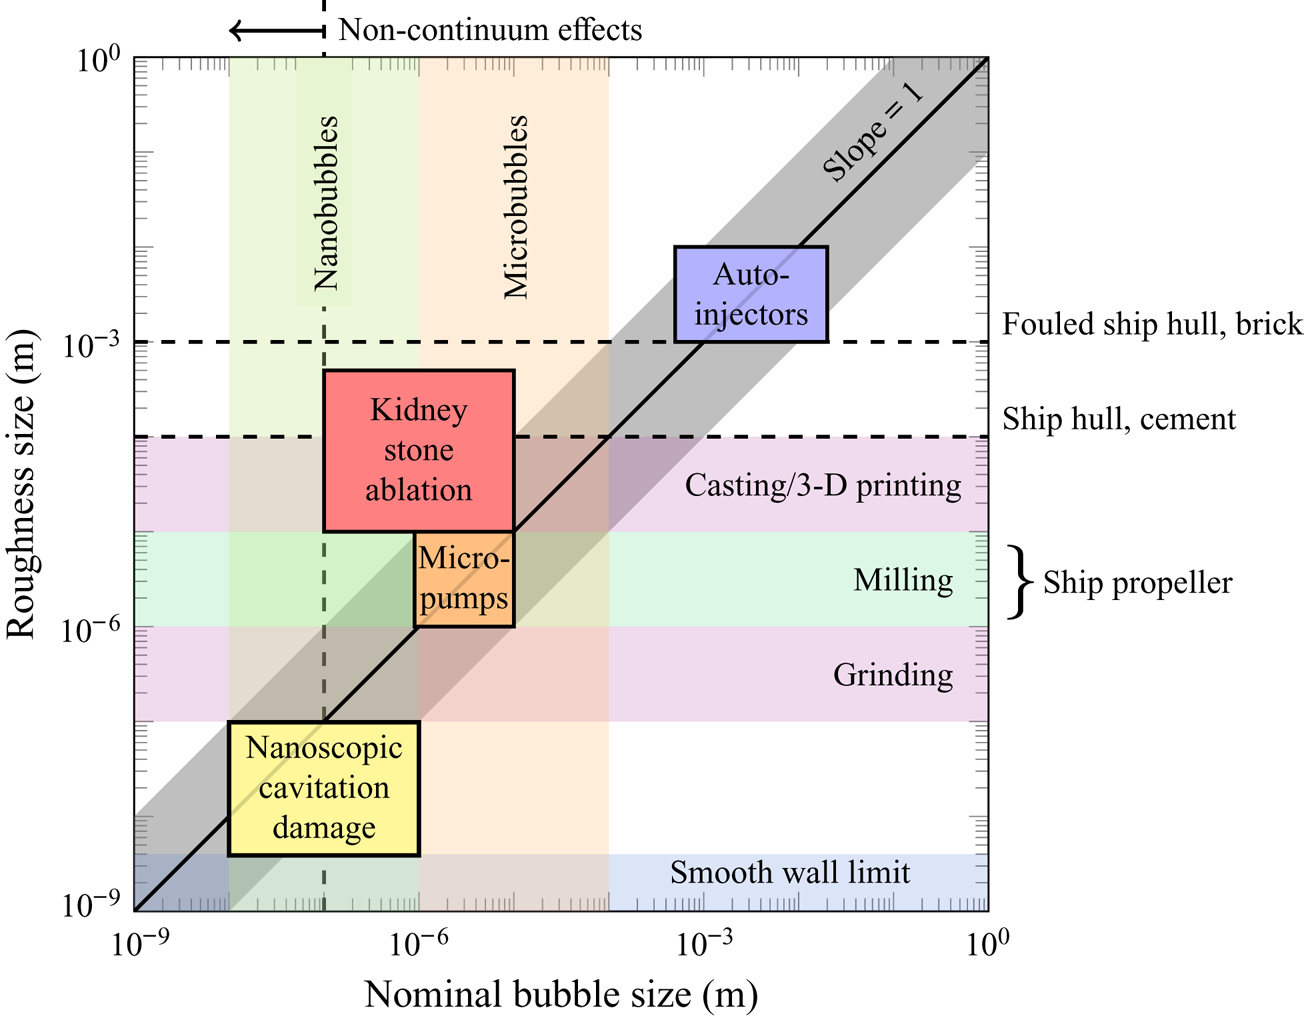
Several studies have analysed bubbles collapsing near smooth walls. Early studies identified an asymmetric behaviour associated with bubble–wall interaction (Benjamin et al. Reference Benjamin, Ellis and Bowden1966; Plesset & Chapman Reference Plesset and Chapman1971) that leads to an impinging jet. Later, experimental studies have analysed the collapse behaviour (Lindau & Lauterborn Reference Lindau and Lauterborn2003), jet formation and velocities (Tomita & Shima Reference Tomita and Shima1986) and wall erosion potential (Philipp & Lauterborn Reference Philipp and Lauterborn1998) in greater detail. Numerical-simulation-based studies have investigated the collapse dynamics of bubbles attached to (Lauer et al. Reference Lauer, Hu, Hickel and Adams2012) and near (Johnsen & Colonius Reference Johnsen and Colonius2009) smooth walls. However, such configurations represent the wall pressure and collapse dynamics only if the length scale of the wall roughness is much smaller than the nominal bubble size. When this condition is not satisfied, the bubble collapse, and thus its effect on near-wall erosion can change qualitatively (Tomita et al. Reference Tomita, Robinson, Tong and Blake2002; Li, Zhang & Han Reference Li, Zhang and Han2018; Zhang et al. Reference Zhang, Li, Zhang, Zhang and Katz2018). In figure 1 physical limits and regions of relevant manufacturing processes and engineering applications are shown for a range of roughness sizes and bubble length scales. The associated broad list of applications, including urinary stone ablation (Pishchalnikov et al. Reference Pishchalnikov, Sapozhnikov, Bailey, Williams, Cleveland, Colonius, Crum, Evan and McAteer2003), surface cleaning (Ohl et al. Reference Ohl, Arora, Dijkink, Janve and Lohse2006; Reuter et al. Reference Reuter, Gonzalez-Avila, Mettin and Ohl2017), cavitation in micro-pumps (Dijkink & Ohl Reference Dijkink and Ohl2008) and pressurized auto-injectors (Veilleux, Maeda & Colonius Reference Veilleux, Maeda, Colonius and Katz2018) and due to nano-bubbles (Borkent et al. Reference Borkent, Gekle, Prosperetti and Lohse2009) motivates the study of bubble collapse dynamics in this regime.
Nominal bubble size and surface roughness of common engineering materials, finishing processes and applications. Roughness sizes are root-mean-square values.

Our goal is to determine how a surface crevice modifies the collapse of a near-wall bubble, and thus to assess the associated modification of wall pressure, jet and shock formation and wave interactions. These phenomena are of principal importance when considering erosion and damage potential (Brennen Reference Brennen1995; Pöhl et al. Reference Pöhl, Mottyll, Skoda and Huth2015). For this purpose, the collapse of a spherical gas bubble near or attached to a wall with a cylindrical notch is analysed. Experimental techniques preclude detailed visualization of such small space- and time-scale dynamics, particularly with respect to the rapid liquid jet formation and the pressure waves emitted after collapse. Therefore, we use numerical simulations to characterize qualitative and quantitative differences of collapse behaviour associated with the surface geometry.
In § 2.2, we describe the physical model and numerical method. The specific configurations considered are presented in § 3, and include variations in notch size and bubble–wall stand-off distance. The variation in notch size serves as a representation of the varying degrees of surface roughness present in engineering applications (see figure 1), whereas the stand-off distance has a significant impact on the collapse dynamics and wall pressure for smooth-wall cases (Tomita & Shima Reference Tomita and Shima1986; Philipp & Lauterborn Reference Philipp and Lauterborn1998; Lauer et al. Reference Lauer, Hu, Hickel and Adams2012). The collapse behaviour of the bubble is analysed for such configurations in § 4, followed by a consideration of the collapse and jet-impact times, velocities and wall pressures. Section 5 concludes the paper.
2. Physical model and numerical methods
2.1. Governing equations
The collapse of a gas bubble in liquid is modelled using a 6-equation multi-component flow model (Saurel, Petitpas & Berry Reference Saurel, Petitpas and Berry2009) that conserves mass, momentum and total energy. For the cases considered herein, the effects of viscosity and surface tension are insignificant when compared to inertial effects, and so they are not included in the model. The governing equations are
 \begin{equation} \left. \begin{array}{c} \dfrac{\partial \alpha_l}{\partial t} + \boldsymbol{u} \boldsymbol{\cdot \nabla} \alpha_l = \mu (p_l - p_g), \\ \dfrac{\partial \alpha_l \rho_l}{\partial t} + \boldsymbol{\nabla \cdot} (\alpha_l \rho_l \boldsymbol{u}) = 0, \\ \dfrac{\partial \alpha_g \rho_g}{\partial t} + \boldsymbol{\nabla \cdot} (\alpha_g \rho_g \boldsymbol{u}) = 0, \\ \dfrac{\partial \rho \boldsymbol{u} }{\partial t} + \boldsymbol{\nabla \cdot} (\rho \boldsymbol{u} \boldsymbol{u} + p \boldsymbol{I}) = \mathbf{0}, \\ \dfrac{\partial \alpha_l \rho_l e_l}{\partial t} + \boldsymbol{\nabla \cdot} (\alpha_l \rho_l e_l \boldsymbol{u}) + \alpha_l p_l \boldsymbol{\nabla \cdot} \boldsymbol{u} = - \mu p_I (p_l - p_g), \\ \dfrac{\partial \alpha_g \rho_g e_g}{\partial t} + \boldsymbol{\nabla \cdot} (\alpha_g \rho_g e_g \boldsymbol{u}) + \alpha_g p_g \boldsymbol{\nabla \cdot} \boldsymbol{u} = \mu p_I (p_l - p_g), \end{array}\right\} \end{equation}
where  $\alpha _k$,
 $\rho _k$,
 $p_k$ and
 $e_k$ are the volume fraction, density, pressure and internal energy of phase
 $k=\{l,g\}$, respectively. The mixture variables for density and pressure are
 \begin{equation} \rho = \sum_k \alpha_k \rho_k \quad \text{and} \quad p = \sum_k \alpha_k p_k \end{equation}
and the mixture velocity is  $\boldsymbol {u} = \boldsymbol {u}_l = \boldsymbol {u}_g$. The pressure-relaxation coefficient is
 $\mu$ and
 $p_I$ is the interfacial pressure (Saurel et al. Reference Saurel, Petitpas and Berry2009).
Due to  $p_l \neq p_g$ in this model, the total energy equation of the mixture is replaced by the internal energy equation for each component. Nevertheless, the conservation of the mixture total energy can be written in the following usual form:
 \begin{equation} \frac{\partial \rho E}{\partial t} + \boldsymbol{\nabla \cdot} \left[ {\left( \rho E + p \right) \boldsymbol{u}} \right] = 0, \end{equation}
where the mixture total energy is
 \begin{equation} E = e + \frac{1}{2} \| \boldsymbol{u} \|^2, \end{equation}
and the mixture internal energy is given by
 \begin{equation} e = \sum_k Y_k e_k \left( \rho_k, p_k \right), \end{equation}
where  $e_k$ is defined via an equation of state and
 $Y_k$ are the mass fractions
 \begin{equation} Y_k = \frac{\alpha_k \rho_k}{\rho}. \end{equation}
Note that (2.3) is redundant when solving internal energy equations for both components. However, it is included to ensure total energy is conserved numerically (Saurel et al. Reference Saurel, Petitpas and Berry2009).
The gas  $g$ is modelled by the ideal-gas equation of state
 \begin{equation} p_g = ( \gamma_g - 1) \rho_g e_g, \end{equation}
and the liquid  $l$ is modelled by the stiffened-gas equation of state
 \begin{equation} p_l = ( \gamma_l - 1) \rho_l e_l - \gamma_l \pi_\infty, \end{equation}
where  $\gamma _g = 1.4$,
 $\gamma _l = 2.35$ and
 $\pi _\infty = 10^9$ Pa are model parameters (Le Métayer, Massoni & Saurel Reference Le Métayer, Massoni and Saurel2005). Note that the bubble dynamics of later sections are generally insensitive to the choice of the stiffened-gas equation of state, although the induced wall pressures depend on these specific model parameters.
2.2. Numerical method
A second-order-accurate monotone upstream-centred scheme for conservation laws (MUSCL) is used to solve (2.1). It is implemented in ECOGEN (Schmidmayer, Petitpas & Daniel Reference Schmidmayer, Petitpas and Daniel2019a; Schmidmayer et al. Reference Schmidmayer, Petitpas, Le Martelot and Daniel2019b), which has been validated for several gas bubble dynamics problems, including free-space (Schmidmayer, Bryngelson & Colonius Reference Schmidmayer, Bryngelson and Colonius2020) and wall-attached (Pishchalnikov et al. Reference Pishchalnikov, Behnke-Parks, Schmidmayer, Maeda, Colonius, Kenny and Laser2019) bubble collapses, and other multi-component problems such as liquid–gas shock tubes (Schmidmayer Reference Schmidmayer2017; Schmidmayer et al. Reference Schmidmayer, Petitpas and Daniel2019a, Reference Schmidmayer, Bryngelson and Colonius2020) and water column and droplet breakup due to high-speed flow (Schmidmayer Reference Schmidmayer2017; Schmidmayer et al. Reference Schmidmayer, Petitpas, Daniel, Favrie and Gavrilyuk2017; Dorschner et al. Reference Dorschner, Biasiori-Poulanges, Schmidmayer, El-Rabii and Colonius2020).
The pressure-non-equilibrium model (2.1) also requires pressure relaxation to recover a unique equilibrium pressure. This is achieved by an infinite-relaxation procedure (Saurel et al. Reference Saurel, Petitpas and Berry2009). At each time step it solves the non-relaxed, hyperbolic equations ( $\mu \to 0$), then relaxes the non-equilibrium pressures for
 $\mu \to +\infty$. The relaxation procedure is combined with a re-initialization procedure at each time-step stage, which ensures a unique pressure and the conservation of total energy, and thus convergence to the 5-equation mechanical-equilibrium model (Kapila et al. Reference Kapila, Menikoff, Bdzil, Son and Stewart2001).
3. Problem set-up
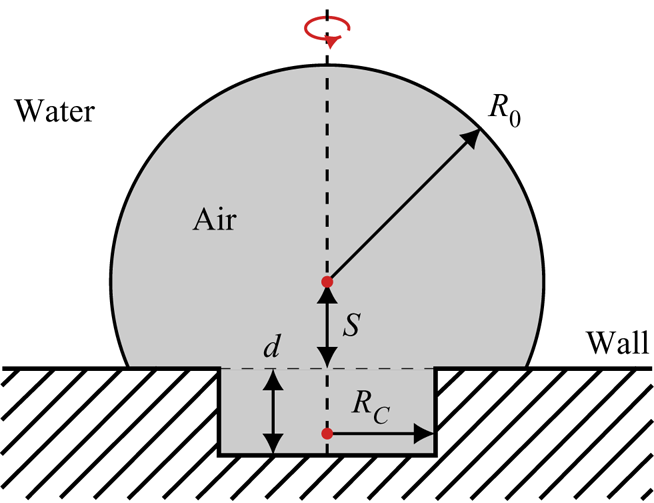
Figure 2 shows the flow configuration considered. The initial bubble is spherical with radius  $R_0$ and stand-off distance
 $S$ above a cylindrical crevice of radius
 $R_C$ and depth
 $d = 0.25 R_0$. The spherical shape is chosen as an approximation of the geometry of an expanded cavitation bubble at its maximum volume. We define the stand-off distance
 $S$ as the distance from the wall to the bubble centre for
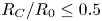 $R_C/R_0 \leq 0.5$ and as the distance from the crevice bottom to bubble centre for
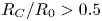 $R_C/R_0 > 0.5$. This definition ensures consistency for both limiting cases
 $R_C/R_0 \to 0$ and
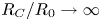 $R_C/R_0 \to \infty$.
Schematic of the problem set-up.

We consider a  $R_0 = 400~{\rm \mu}$m bubble filled with non-condensable gas of initial pressure
 $p_B = 3000$ Pa and density
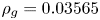 $\rho _g = 0.03565$ kg m
 $^{-3}$. Bubbles commonly used in relevant applications predominately consist of non-condensable gas. Furthermore, the collapse dynamics are also only weakly sensitive to the internal bubble pressure when the driving pressure differences are large (Pishchalnikov et al. Reference Pishchalnikov, Behnke-Parks, Schmidmayer, Maeda, Colonius, Kenny and Laser2019).
The bubble is surrounded by water with a density of  $\rho _l = 1002.7$ kg m
 $^{-3}$ and varying pressure
 \begin{equation} p(\hat{r},t=0) = p_{\infty} + \frac{R_0}{\hat{r}} \left( p_B - p_\infty \right) \quad \text{for} \quad \hat{r} > R_{0}, \end{equation}
where  $\hat {r}$ is the radial coordinate with origin at the bubble centre. This initialization matches the pressure distribution predicted by the Rayleigh equation for the Besant problem (Besant Reference Besant1859; Brennen Reference Brennen1995). For the configurations considered, it provides a valid approximation of the realistically evolving pressure field and suppresses the formation of spurious pressure waves due to pressure jumps (Tiwari, Freund & Pantano Reference Tiwari, Freund and Pantano2013; Tiwari, Pantano & Freund Reference Tiwari, Pantano and Freund2015). Further, it has been established that this approximation evolves towards an exact solution of the Besant problem within a very short time (Rasthofer et al. Reference Rasthofer, Wermelinger, Karnakov, Šukys and Koumoutsakos2019). We use
 $p_\infty = 10^7$ Pa, which matches that of previous studies (Lauer et al. Reference Lauer, Hu, Hickel and Adams2012; Beig, Aboulhasanzadeh & Johnsen Reference Beig, Aboulhasanzadeh and Johnsen2018) and serves as a representation of actual applications involving liquid cavitation, such as high-pressure pumps (Bohner, Fischer & Gscheidle Reference Bohner, Fischer and Gscheidle2001).
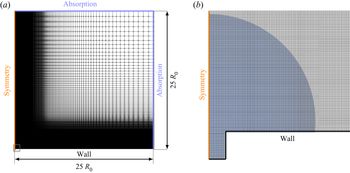
Figure 3 shows the computational grid. The bubble collapse process is assumed to be axisymmetric with radial coordinate  $r$, and thus a two-dimensional axisymmetric domain of radius and length
 $25 R_0$ is used, matching that of previous studies of smooth-wall collapse (Lauer et al. Reference Lauer, Hu, Hickel and Adams2012). The grid is equally spaced with 400 finite volumes per
 $R_0$ near the bubble (until
 $\hat {r} = 1.5 R_{0}$) and is progressively stretched farther from the bubble with a stretching factor of
 $1.01$ in each direction. This resolution has been shown to be sufficient for the conditions considered here (Lauer et al. Reference Lauer, Hu, Hickel and Adams2012; Pöhl et al. Reference Pöhl, Mottyll, Skoda and Huth2015; Beig et al. Reference Beig, Aboulhasanzadeh and Johnsen2018). Non-reflecting boundary conditions are used at the outer boundaries to suppress reflecting pressure waves at these locations (Toro Reference Toro1997). This involves solving a Riemann problem at an outer boundary by assuming identical primitive variables on both sides of the boundaries. A constant Courant–Friedrichs–Levy (CFL) number of
 $0.4$ is used, which corresponds to a time step of
 ${\rm \Delta} t \approx 0.15$ ns. The total simulation time is 6
 $\mu$s, or about
 $1.5 t^{\ast }$, where
 \begin{equation} t^{\ast} = R_0 \sqrt{\frac{\rho_l }{ {\rm \Delta} p}} \end{equation}
is an estimate of the collapse time of a bubble collapse near a solid wall (Plesset & Chapman Reference Plesset and Chapman1971) with the driving pressure difference  ${\rm \Delta} p \equiv p_\infty - p_B$. The wall has a retarding effect on the collapse and thus
 $t^{\ast }$ is longer than the Rayleigh collapse time for spherical collapses (
 $t_{\textit{Rayleigh}}=0.915\,t^{\ast }$). Velocity and pressure are normalized as
 \begin{equation} u^{\ast} = \sqrt{\frac{{\rm \Delta} p}{\rho_l}} \quad \text{and} \quad p^{\ast} = c_l \sqrt{\rho_l {\rm \Delta} p}, \end{equation}
where  $c_l$ is the liquid speed of sound.
(a) Two-dimensional axisymmetric grid configuration and boundary conditions for an example case of a small crevice ( $R_C/R_0 = 0.15$) and a stand-off distance of
 $S/R_0=0.35$. (b) Magnification of the near-bubble region with the bubble shaded. Only every fourth grid line is shown in each coordinate direction.

4. Results
4.1. Considered configurations
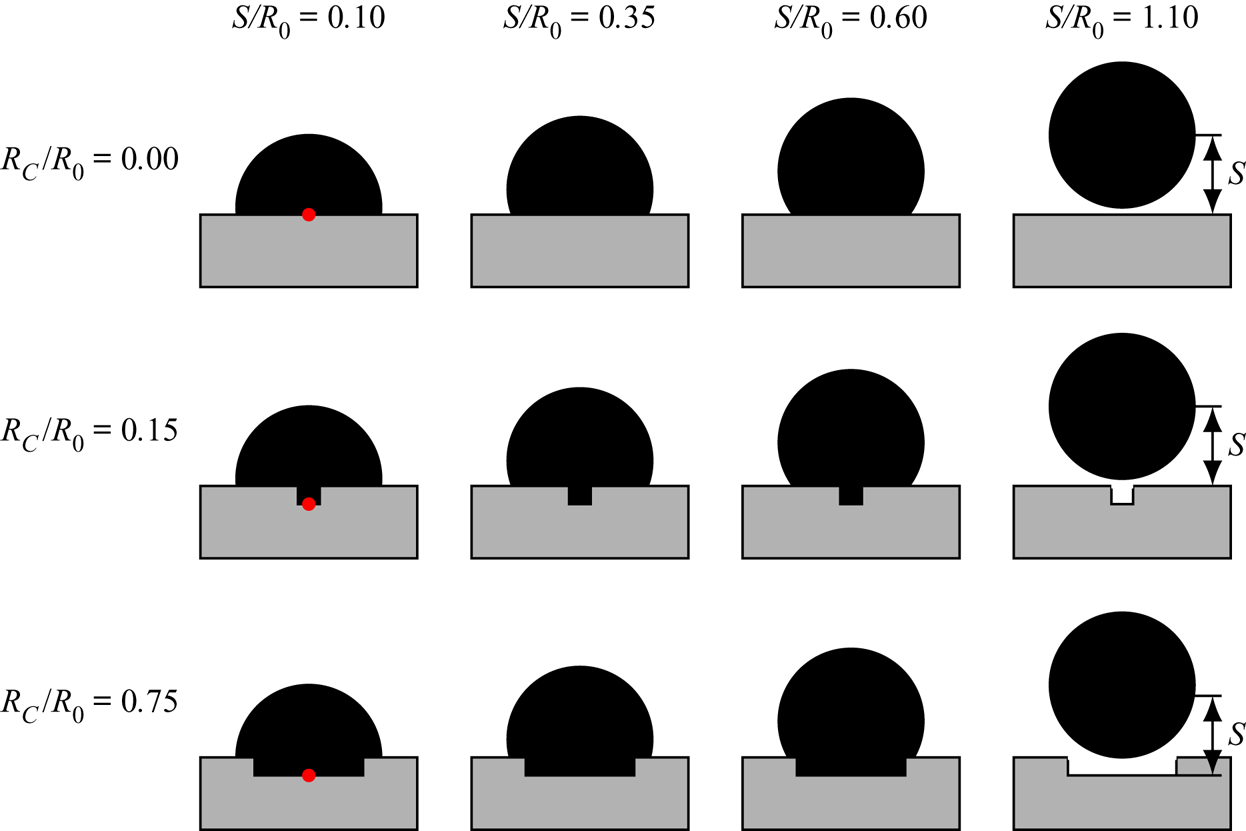
We use stand-off distances of  $S/R_{0} = 0.1$,
 $0.35$,
 $0.6$ and
 $1.1$ (wall-detached). For each stand-off distance we consider a smooth wall (
 $R_C= 0$), a small crevice (
 $R_C/R_0= 0.15$) and a large crevice (
 $R_C/R_0= 0.75$), as shown in figure 4.
Overview of the investigated configurations. The red circle shows the  $r = 0$ wall-centred position used to observe the pressure impact. Rows correspond to constant crevice size
 $R_C/R_0$ and columns correspond to constant stand-off distance
 $S/R_0$. The stand-off distance
 $S$ is also shown; its definition is modified to be measured from the bottom of the crevice for the
 $R_C/R_0 = 0.75$ cases.

We first analyse the collapse behaviour of wall-attached bubbles by increasing the crevice size (smooth wall in § 4.2, small crevice in § 4.3 and large crevice in § 4.4), and then consider detached bubbles in § 4.5. In § 4.6, we compare the pressure impact on the wall for all configurations and assess the cavitation erosion potential.
4.2. Smooth-wall-attached-bubble collapse  $R_C=0$

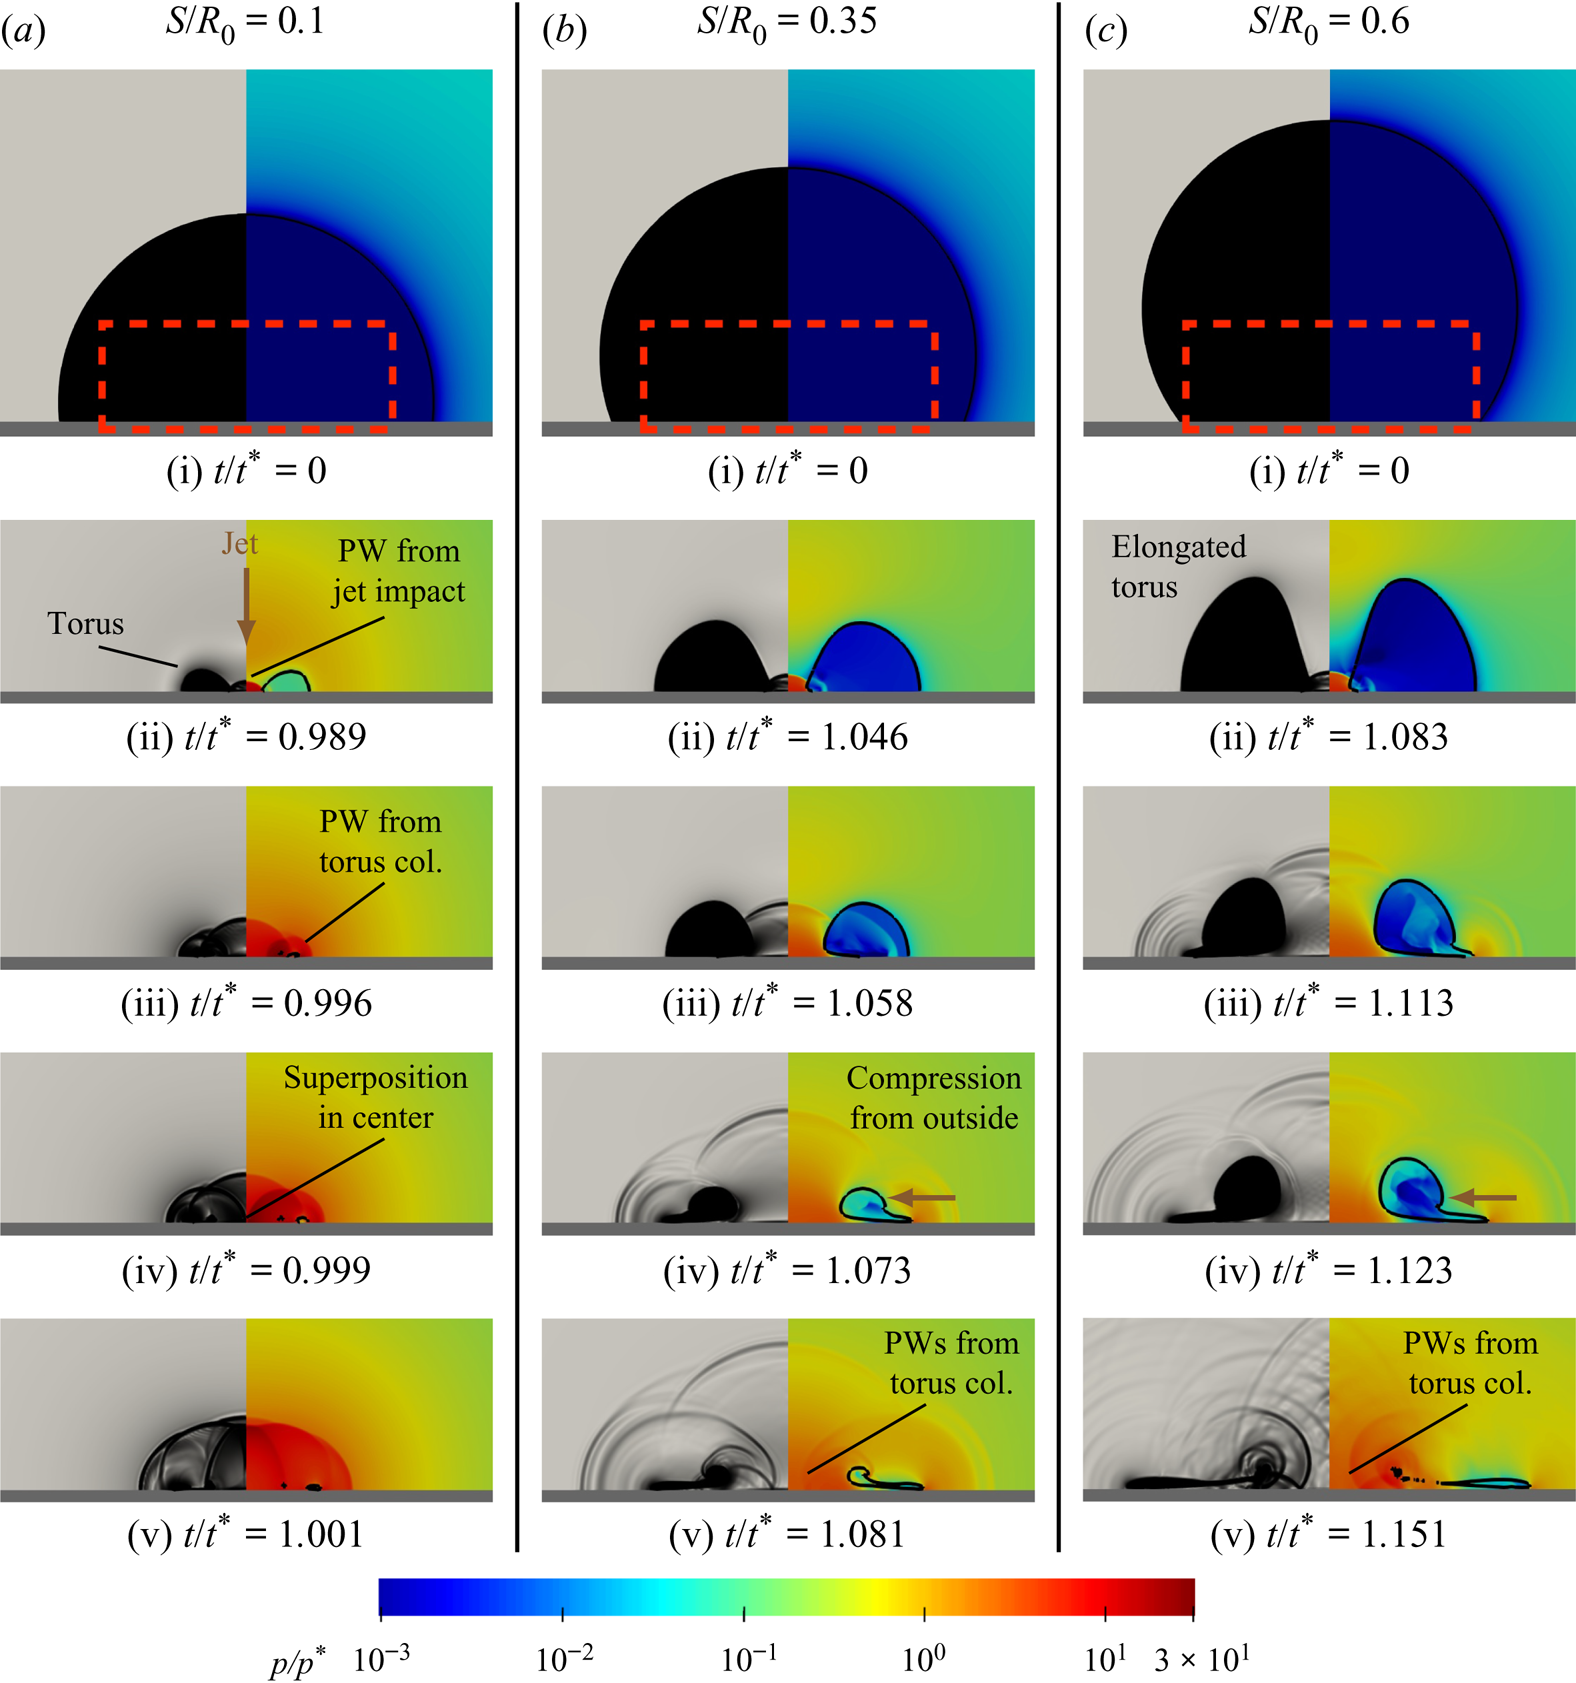
Figure 5 visualizes the flow of a collapsing wall-attached bubble using the pressure field  $p$ and numerical schlieren
 $\Phi$ (Quirk & Karni Reference Quirk and Karni1996) as
 \begin{equation} \Phi = \exp\left(- \frac{ k |\boldsymbol{\nabla} \rho |}{\max |\boldsymbol{\nabla} \rho|} \right), \end{equation}
where  $k = 400$ is used to ensure waves in the liquid are visible (Johnsen Reference Johnsen2007; Meng & Colonius Reference Meng and Colonius2018). The corresponding pressures at the centre of the wall are shown in figure 6.
Numerical schlieren (left of each panel) and log-scale pressure fields (right of each panel) of an air bubble collapsing onto a smooth wall of varying stand-off distances  $S/R_{0}$ (a–c) at selected times (i–v). Gas volume fraction
 $\alpha _g$ is shown as a shaded area of decreasing opacity with decreasing
 $\alpha _g$ (left of each panel), while the
 $\alpha _g = 0.5$ isoline is shown as a solid curve (right of each panel) representing a pseudo-phase interface. Panels (ii–v) are magnifications of the red-dashed rectangular regions in (i). Selected pressure waves (PW) and collapse dynamics (col.) are also identified. See also supplementary movies 1–3, available at https://doi.org/10.1017/jfm.2020.432.

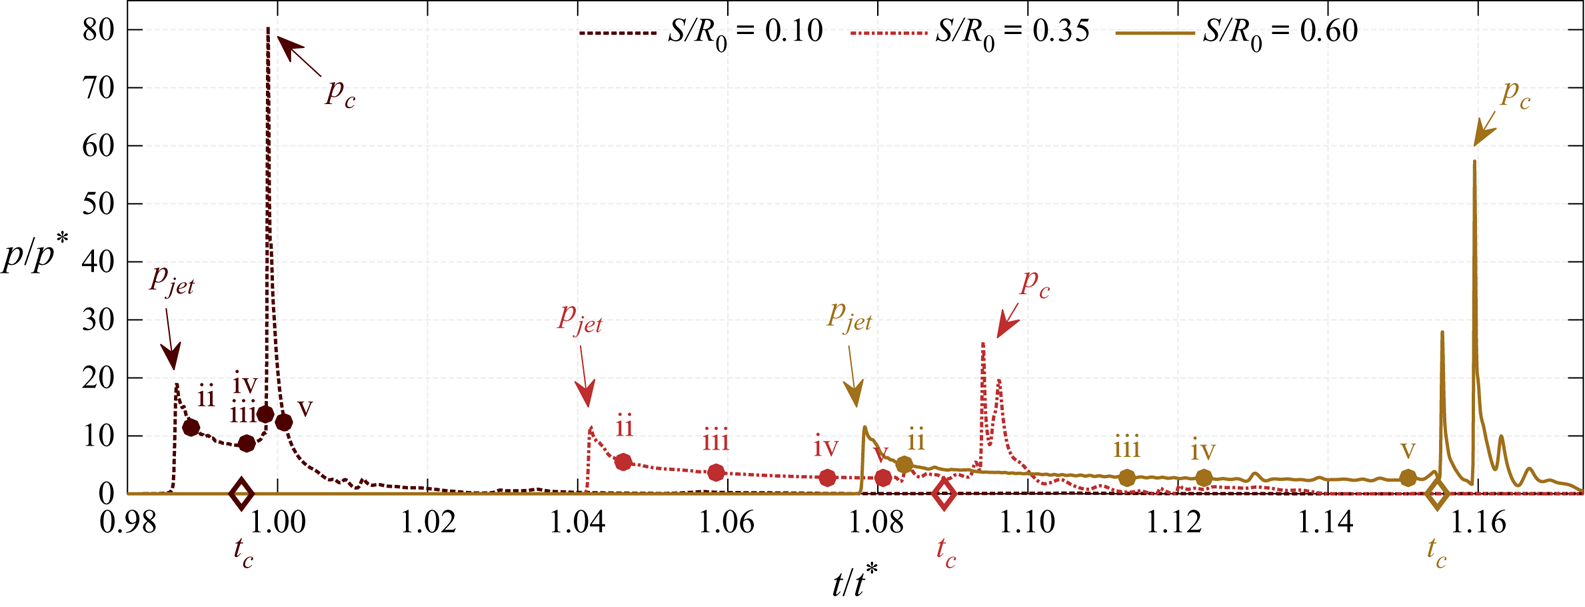
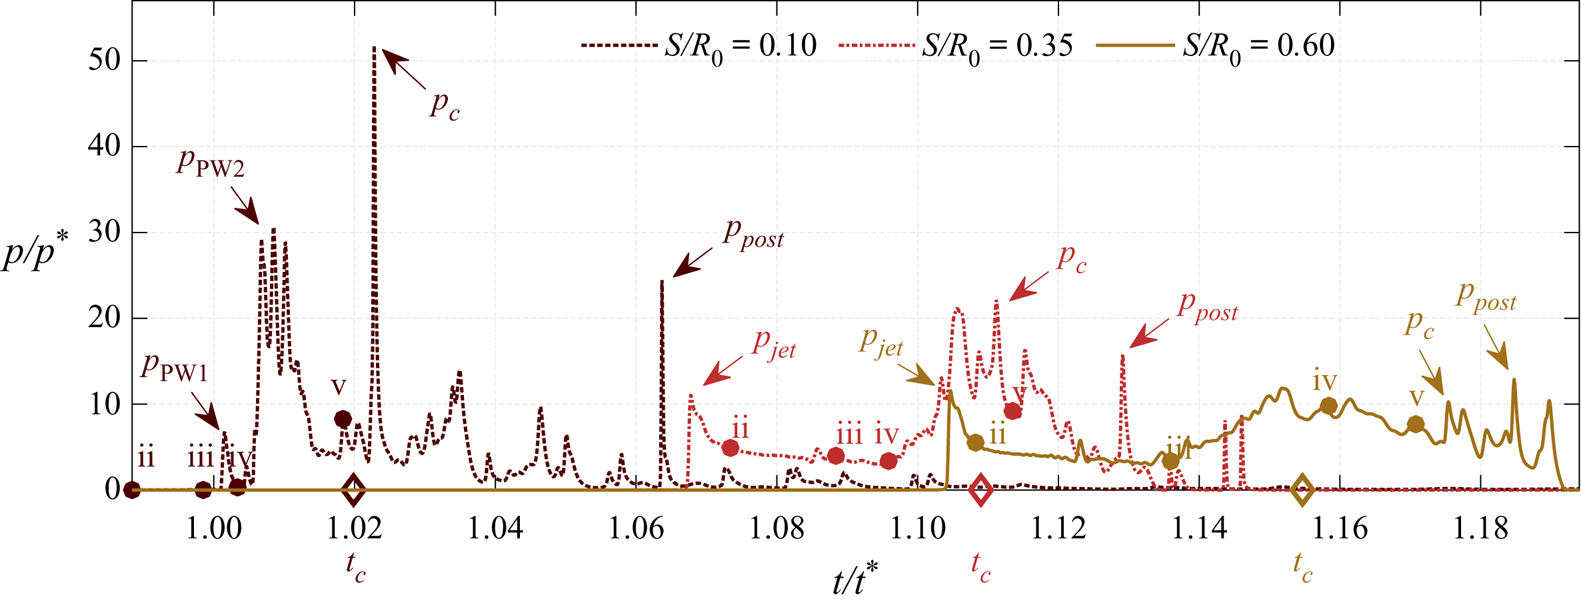
Evolution of the wall-centred pressure for the smooth-wall case at varying stand-off distances  $S/R_0$. The time instances shown in figure 5 are highlighted and labelled with the corresponding row (ii–v). The pressure peaks induced by the jet impact
 $p_{\textit{jet}}$ and the collapse
 $p_c$ are indicated as such. The collapse time
 $t_c$ is plotted as a diamond on the
 $x$-axis.

For all cases a wall-directed jet is formed during the initial collapse phase. The jet impinges on the wall (row ii) leading to a pressure wave. At subsequent times the remaining toroidal bubble continues to collapse, emitting a pulse that travels radially inward and collides at  $r = 0$.
The collapse of the torus becomes increasingly non-uniform, with a portion near the wall being pinched away from the main torus, which is in agreement with experimental observations (Lindau & Lauterborn Reference Lindau and Lauterborn2003). Pressure waves emitted near the pinching location are evident, starting in figures 5(b,iv) and 5(c,iii) respectively. In addition, a compression of the torus from the outside pushes its upper part towards the centre (b,iv), (c,iv). During the final collapse phase, two pressure waves propagate inward, focus and result in two distinct pressure pulses at the wall centre, as visible in figure 6.
The impact of a liquid jet onto the wall generates a water hammer pressure proportional to the jet velocity  $p_{\textit{jet}}\propto \rho _l c_l u_{\textit{jet}}$. The jet-induced pressure peak
 $p_{\textit{jet}}$ is clearly visible from the wall-centred pressure signals of figure 6. For
 $S/R_0 =0.1$, the peak is approximately twice as high as for the others. The high jet velocity at this small stand-off distance is a result of the bubble shape being almost hemispherical. A hemispherical bubble attached to an inviscid wall collapses like a spherical bubble with a uniform and high acceleration of the interface. For
 $S/R_0 =0.1$ the initial stages of the collapse resemble those of a collapsing spherical bubble, with the formation of the liquid jet immediately preceding the total collapse and the jet reaching a high velocity. Similar observations were made by Philipp & Lauterborn (Reference Philipp and Lauterborn1998), who also experimentally recorded the highest jet-induced pressures at small stand-off distances.
In the configurations considered, the total collapse is the collapse of the gas torus. We determine the collapse time  $t_c$ by the minimum gas volume. The pressure waves emitted at total collapse result in collapse-induced pressure peaks
 $p_c$ (see figure 6). Thus, the jet impact on the wall as well as the shock waves emitted during total collapse cause high pressure peaks and potentially material damage. For the rough-wall cases, we also observe pressure peaks induced by the post-collapse wave dynamics. In § 4.6, we compare these three pressure peaks for all configurations. For the smooth-wall cases,
 $p_c$ is significantly higher than
 $p_{\textit{jet}}$, which agrees with the findings of Lauer et al. (Reference Lauer, Hu, Hickel and Adams2012).
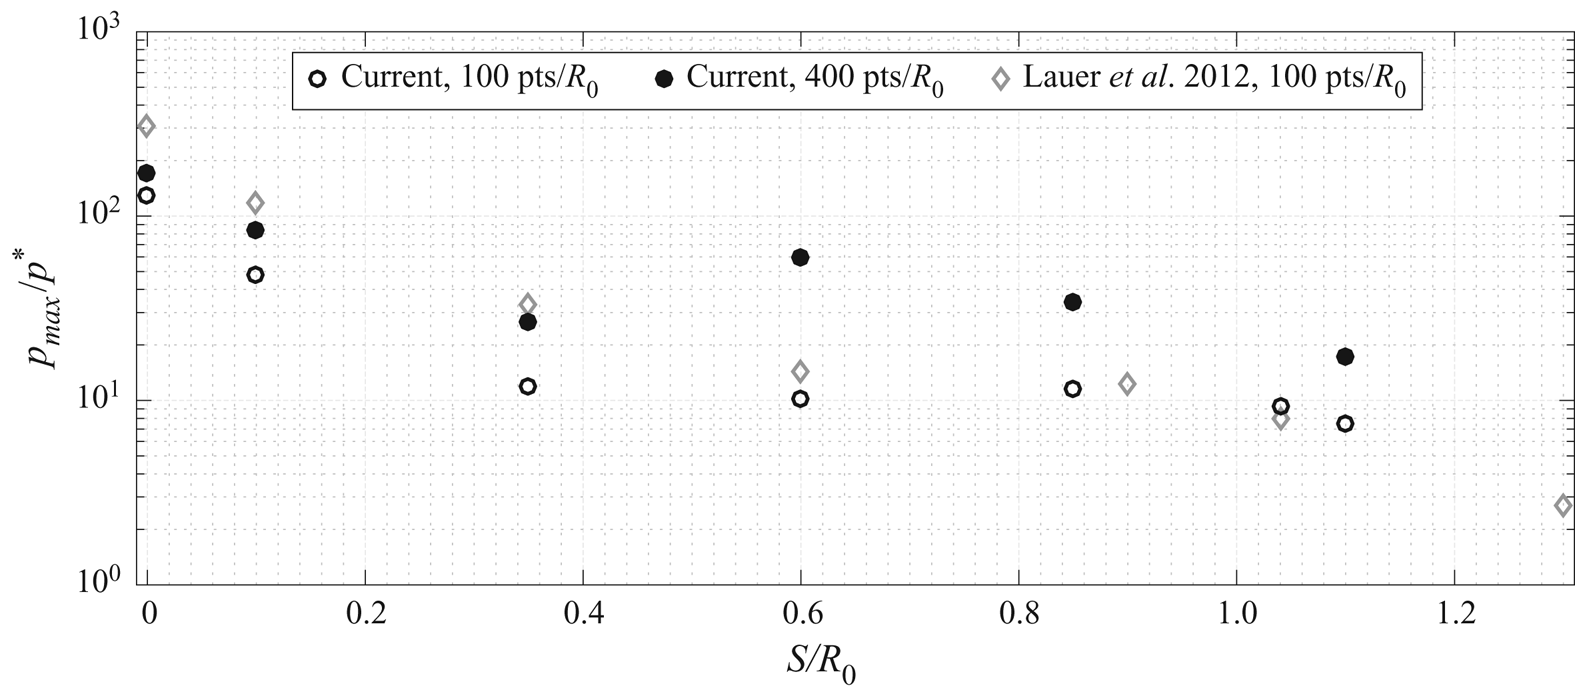
In figure 7 the maximum wall pressure  $p_{\textit{max}}$ is compared with that of Lauer et al. (Reference Lauer, Hu, Hickel and Adams2012) for the present resolution (
 $400\ \text {pts}/R_0$) and
 $100\ \text {pts}/R_0$, which matches their study. The current results follow the same trends, although with lower pressures for the attached-bubble cases (
 $S < R_0$). The maximum pressure is known to be sensitive to resolution, although a discrepancy also exists for identical grid resolutions (
 $100\ \text {pts}/R_0$). Lauer et al. (Reference Lauer, Hu, Hickel and Adams2012) consider condensation, while we model the bubble content as non-condensable gas. The damping of the maximum pressure observed is consistent with previous analyses of bubbles containing non-condensable gas (Trummler et al. Reference Trummler, Freytag, Schmidt, Adams and Katz2018; Pishchalnikov et al. Reference Pishchalnikov, Behnke-Parks, Schmidmayer, Maeda, Colonius, Kenny and Laser2019). Further, the observed decrease of the maximum wall pressure with increasing stand-off distance matches experimental observations for wall-attached bubbles at atmospheric conditions (Shima et al. Reference Shima, Takayama, Tomita and Ohsawa1983; Shima, Tomita & Takahashi Reference Shima, Tomita and Takahashi1984; Tomita & Shima Reference Tomita and Shima1986) and is consistent with measured cavitation damage depths (Philipp & Lauterborn Reference Philipp and Lauterborn1998).
Maximum wall pressure for a smooth-wall-attached bubble of varying stand-off distance  $S/R_0$ and grid resolution as labelled. Results from Lauer et al. (Reference Lauer, Hu, Hickel and Adams2012) are also shown for comparison.

4.3. Small crevice $R_C/R_0 = 0.15$

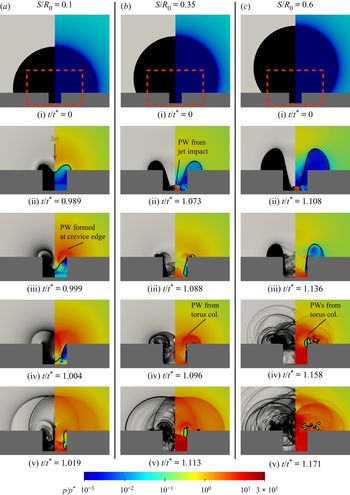
Visualizations of a bubble collapsing onto a  $R_C/R_0 = 0.15$ creviced-wall at varying stand-off distances
 $S/R_0$ are shown in figure 8 and the corresponding wall pressures are shown in figure 9.
Numerical schlieren (left of each panel) and pressure fields (right of each panel) of an air bubble collapsing onto a wall with a small crevice  $R_C/R_{0}=0.15$ at varying stand-off distances
 $S/R_{0}$ (a–c) at selected times (i–v). Panels (ii–v) are magnifications of the red-dashed rectangular regions in (i). Selected pressure waves (PW) and collapse dynamics (col.) are also identified. See also supplementary movies 5–7.

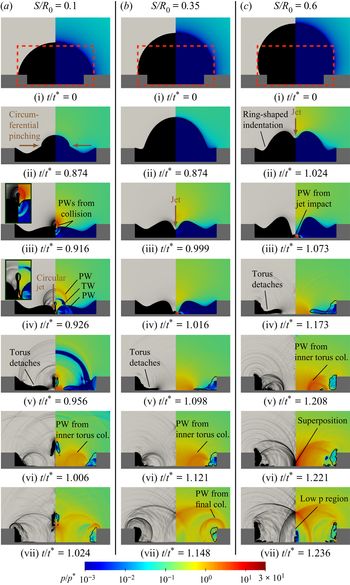
Evolution of the wall pressure at  $r = 0$ for the case
 $R_C/R_0 = 0.15$ at varying stand-off distances
 $S/R_0$. The time instances shown in figure 8 are highlighted and labelled with the corresponding row (ii–v). The pressure peaks induced by the jet impact
 $p_{\textit{jet}}$, the pressure wave
 $p_{{\rm PW}}$, the collapse
 $p_c$ and post-collapse wave dynamics
 $p_{\textit{post}}$ are indicated as such. The collapse time
 $t_c$ is plotted as a diamond on the
 $x$-axis.

For the smallest stand-off distance case ( $S/R_0 = 0.1$), the initial stages of the collapse match those of the smooth-wall cases, with a jet piercing the bubble and generating a toroidal structure. However, in this case, the gas torus is ultimately fully contained in the crevice. As shown in figure 8(a,iii), a pressure wave is emitted when the liquid has reached the sharp edge of the crevice and is suddenly stopped there. This wave propagates radially outwards (a,iv) and collides in the centre, inducing a small pressure peak at the wall centre, see
 $p_{{\rm PW1}}$ in figure 9. The pressure wave continues to travel towards the other crevice side, pushing the gas away from the crevice bottom and pressing it against the opposite sidewall (a,v). Between (a,iv) and (a,v) the pressure wave and its reflections induce high pressure fluctuations at the wall centre (
 $p_{\textrm {PW2}}$). The last time step depicted (a,v) is close to the final collapse, which causes the highest pressure peak.
For the larger stand-off distances  $S/R_0 = 0.35$ and
 $0.6$, the jet penetrates the entire bubble and hits the crevice bottom. A gas torus remains on the upper wall and a gas layer covers the sidewalls. As in the smooth-wall cases, the gas torus outside of the crevice collapses ((b,iv), (c,iv)), emitting intense pressure waves. These waves propagate radially outward, interfere with each other and are reflected within the crevice. The time steps (b,v) and (c,v) both visualize the complex wave pattern after the total collapse.
Figure 9 shows that the wall-centred pressures associated with the  $S/R_0 = 0.35$ and
 $0.6$ cases are qualitatively similar. Both have a pressure peak due to the jet impact, followed by a time-delayed accumulation of pressure peaks during and after the final collapse phase. For
 $S/R_0 = 0.6$ these pressure peaks are smaller since the intense pressure waves are more concentrated in the area above the crevice (see (c,iv,v)) and thus decay until they reach the crevice bottom.
At all stand-off distances, significant pressure peaks are induced by the post-collapse wave dynamics (see  $p_{\textit{post}}$ in figure 9).
4.4. Large crevice $R_C/R_0 = 0.75$

We next consider the large-crevice  $R_C/R_0 = 0.75$ cases. Recall that
 $S$ is now measured from the bottom of the crevice wall to the bubble centre, instead of from the top of the crevice wall. Figure 10 visualizes the collapses and the corresponding wall-centred pressures are shown in figure 11.
Numerical schlieren (left of each panel) and pressure fields (right of each panel) of an air bubble collapsing onto a wall with crevice size  $R_C/R_{0}=0.75$ at varying stand-off distances
 $S/R_{0}$ (a–c) at selected times (i–vii). In (a,iii) and (a,iv) the relevant areas are additionally magnified in the upper left corner. Panels (ii–vii) are magnifications of the red-dashed rectangular regions in (i). Selected pressure waves (PW), tension waves (TW) and collapse dynamics (col.) are also identified. See also supplementary movies 9–11.

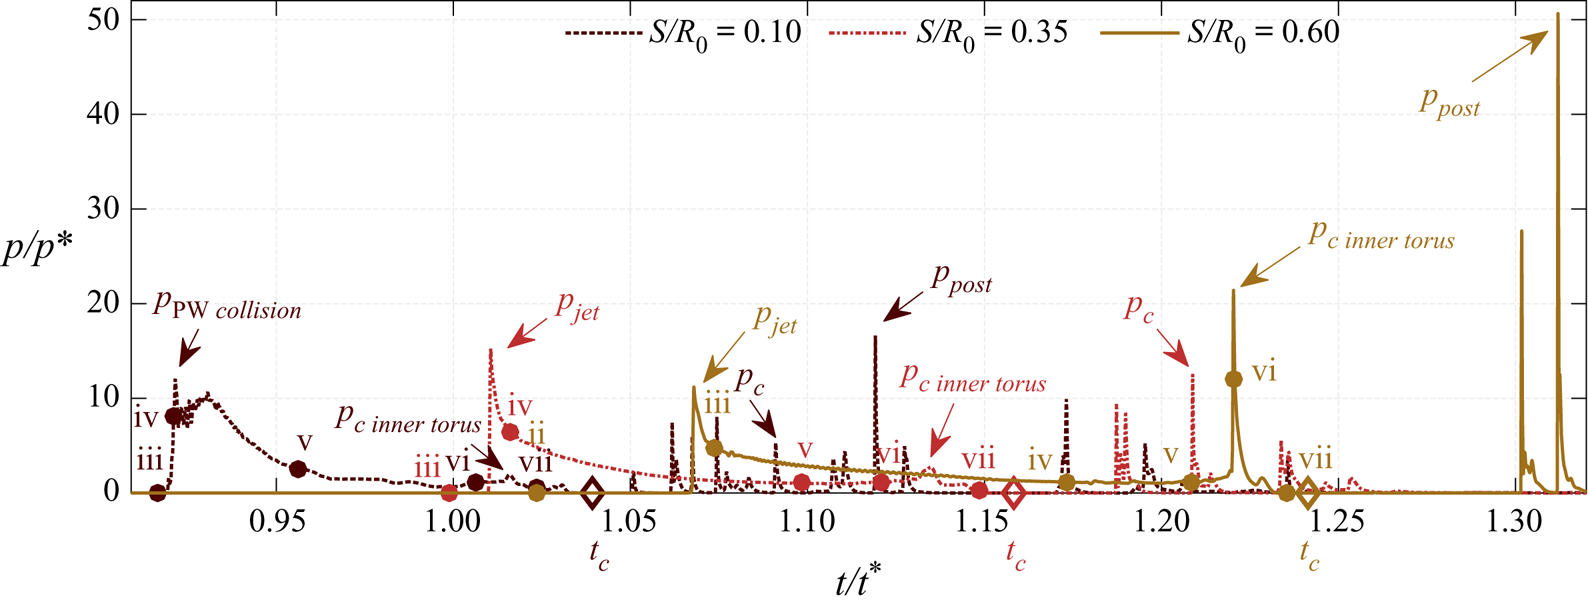
Evolution of the wall pressure at  $r = 0$ for the case
 $R_C/R_0 = 0.75$ at varying stand-off distances
 $S/R_0$. The time instances shown in figure 10 are highlighted and labelled with the corresponding row (ii–vii). The pressure peaks induced by the jet impact
 $p_{\textit{jet}}$, the collision of the pressure wave
 $p_{{\rm PW}\, \textit{collision}}$, the collapse of the inner torus
 $p_{c\,{\textit{inner}\,{\textit{torus}}}}$, the total collapse
 $p_c$ and post-collapse wave dynamics
 $p_{\textit{post}}$ are indicated as such. The collapse time
 $t_c$ is plotted as a diamond on the
 $x$-axis.

For the  $S/R_0 = 0.1$ case (figure 10 column a), the fraction of the bubble surface initially exposed to the high-pressure liquid is comparable to that of a bubble with a small negative stand-off distance (
 $S/R_0 - d/R_0 = 0.1 - 0.25 = - 0.15$). Consequently, the initial collapse phase resembles that of such a configuration. Lauer et al. (Reference Lauer, Hu, Hickel and Adams2012) and Shima & Nakajima (Reference Shima and Nakajima1977) report a collapse behaviour similar to that of a spherical collapse with an additional circumferential pinching at the position of maximum extension, resulting in a mushroom shape. Here, (a,ii) shows the compressed upper part of the bubble and also a circumferential pinching. Additionally, a ring-shaped indentation of the bubble can be observed.
The circumferential pinching meets at the  $r = 0$ axis of symmetry, generating a pressure wave (a,iii), which propagates radially outward in the liquid and the gas. When the pressure wave in the gas reaches the bottom wall, it induces a pressure peak there (see figure 11,
 $p_{{\rm PW}\,\textit{collision}}$). The pressure wave in the liquid is partially reflected at the gas–liquid interface, and generates a tension wave following the initial pressure wave (a,iv,v). Furthermore, the collision of the circumferential pinching results in the formation of a wall-normal circular jet, see (a,iii,iv). The subsequent circular jet impacts on the bottom wall and pushes away the gas in the crevice centre. A secondary bubble pinches off and moves upwards (a,v). From the remaining flattened gas torus, an inner gas torus detaches at the position of the ring-shaped indentation, collapses (a,vi) and emits a pressure wave propagating in the direction of
 $r = 0$ (a,vii). At the same time, the remaining gas is pressed towards the crevice sidewalls and pressure waves are formed at the sharp edges of the crevice (a,vii).
For the  $S/R_0 = 0.35$ and
 $0.6$ cases (figure 10b,c), a ring-shaped indentation forms close to the crevice edge during the initial collapse phase, similar to that of the
 $S/R_0 = 0.1$ case. In addition, the jet indents the bubble from the top, as observed for the small crevice and the smooth-wall configurations. Panels (b,iv) and (c,iii) show that the larger stand-off distance results in a more curved bubble interface when the jet impacts the wall. Similar to the
 $S/R_0 = 0.1$ case, an inner torus detaches from the main torus at the position of the ring-shaped indentation (b,v and c,iv), and collapses, emitting a pressure wave (b,vi and c,v). The pressure wave propagates to the centre, collides there inducing a pressure peak (c,vi) (
 $p_{c\, {\textit{inner}\, \textit{torus}}}$) and then continues, resulting in a low-pressure area (c,vii). This pressure decrease can cause a vapour bubble rebound when phase-change processes are taken into account. The final collapse occurs when the remaining gas torus in the corner of the crevice is compressed to its minimum size (b,vii).
The pressure signals in figure 11 show the jet-induced pressure peak  $p_{\textit{jet}}$ for
 $S/R_0=0.35$ and
 $S/R_0=0.6$. For
 $S/R_0=0.35 p_{\textit{jet}}$ is higher because the initially liquid-exposed part of the bubble interface is almost a hemisphere and is thus strongly accelerated, see also § 4.2. For
 $S/R_0=0.1$, there is no jet-induced pressure peak in the centre due to the circular jet. However, a pressure peak of approximately the same intensity is induced by the pressure wave emitted when the circumferential pinching collides (
 $p_{{\rm PW}\,\textit{collision}}$).
This first peak is followed by a peak  $p_{c\,{\textit{inner}\,\textit{torus}}}$ caused by the collapse of the inner detached torus. As
 $S/R_0$ increases, this pressure peak increases since the volume of the detached inner torus increases, resulting in a stronger pressure wave. Due to the preceding collapse of the inner torus, a smaller gas volume is associated with the final collapse phase. Furthermore, the collapse occurs at the crevice corner, and thus the induced pressure waves are less intense at the wall centre. As a result, the collapse-induced pressure peak in the centre
 $p_c$ is comparatively small and is exceeded by
 $p_{\textit{jet}}$ (or respectively by
 $p_{{\rm PW}\,\textit{collision}}$). Indeed, for
 $S/R_0=0.6$, the total collapse does not generate a pressure peak at the wall centre.
After the final collapse, intense wave dynamics occur, which can lead to high pressure peaks. For  $S/R_0 = 0.1$ and
 $0.6$, these post-collapse pressure peaks
 $p_{\textit{post}}$ are the maximum pressure observed.
4.5. Collapse of a wall-detached bubble ($S/R_0 = 1.1$)

The collapse of wall-detached bubbles ( $S/R_0 = 1.1$) are visualized in figure 12 for varying crevice sizes. The corresponding wall-centred pressure evolution is shown in figure 13. As observed for previous cases, the aspherical pressure distribution leads to an indentation of the top of the bubble and the formation of a jet penetrating the bubble. The monitored jet velocities are approximately
 $u_{\textit{jet}}/u^{\ast } \approx 10$, which is in good agreement with previous studies for smooth walls (Lauer et al. Reference Lauer, Hu, Hickel and Adams2012; Supponen et al. Reference Supponen, Obreschkow, Tinguely, Kobel, Dorsaz and Farhat2016).
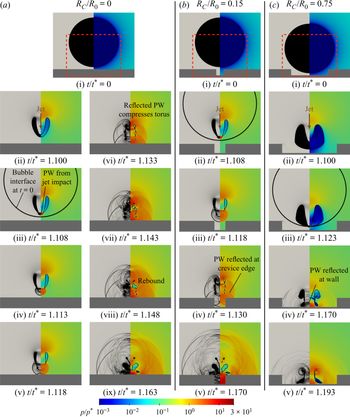
Numerical schlieren (left) and pressure fields (right) of a wall-detached air bubble ( $S/R_0 = 1.1$) collapsing onto a wall of varying crevice size
 $R_C/R_{0}$ (a–c) at selected times as labelled. Panels (ii–ix) are magnifications of the red-dashed rectangular regions in (i). The solid curve in (a,iii), (b,ii) and (c,iii) indicates the initial position of the bubble interface. Selected pressure waves (PW) are also identified. See also supplementary movies 4, 8 and 12.

Evolution of the wall pressure at  $r = 0$ for the
 $S/R_0 = 1.1$ case and varying crevice sizes
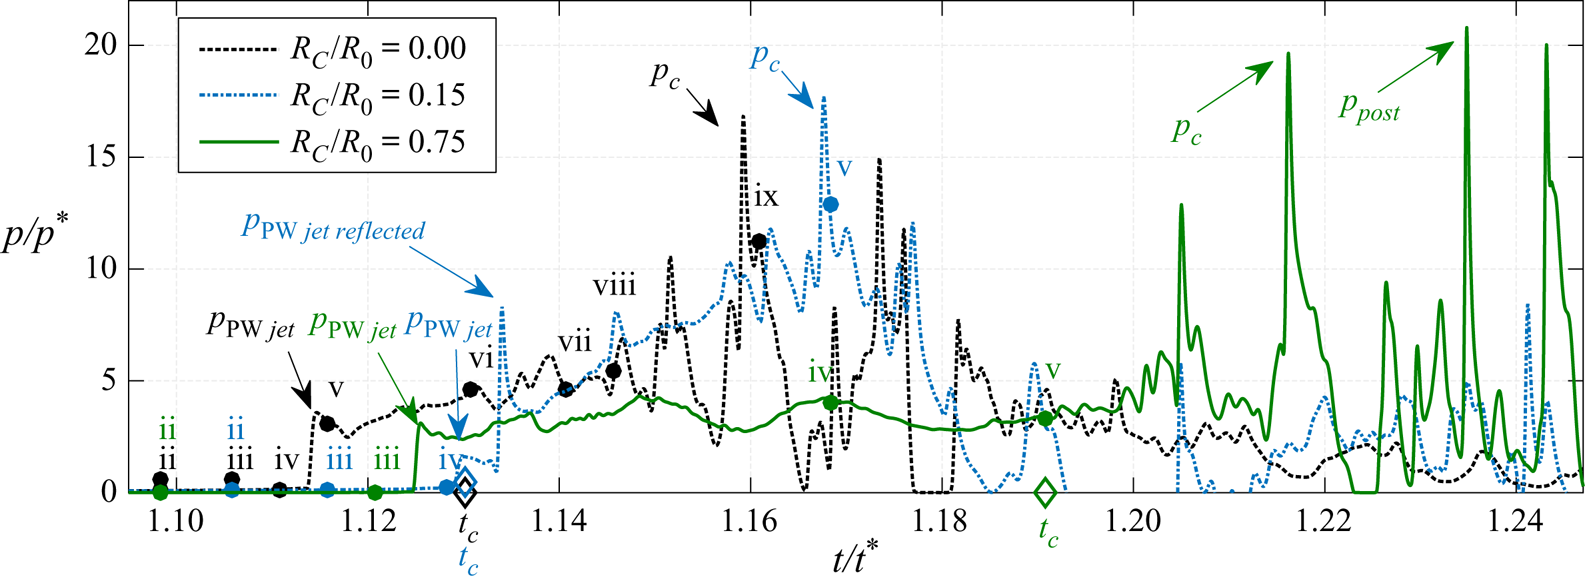
 $R_C/R_0$. The time instances shown in figure 12 are highlighted and labelled with the corresponding row (ii–v). The pressure peaks induced the pressure-wave
 $p_{{\rm PW}\, \textit{jet}}$, the collapse
 $p_c$ and post-collapse wave dynamics
 $p_{{\textit{post}}}$ are indicated as such. The collapse time
 $t_c$ is plotted as a diamond on the
 $x$-axis.

For the smooth-wall case (figure 12a) the jet impacts the far-side bubble interface at  $t = 1.1t^{\ast }$ and a pressure wave is emitted (a,iii). The impact time of the jet at the bubble wall and the bubble position with respect to the initial configuration are in good agreement with previous observations (Supponen et al. Reference Supponen, Obreschkow, Tinguely, Kobel, Dorsaz and Farhat2016). The jet impact results in an upward and a downward moving wave front (see (a,iv)), with the latter being curved. The numerical schlieren shows an additional downward moving density jump corresponding to a contact wave. When the downward moving pressure wave impacts the wall, a pressure peak is induced (see also figure 13,
 $p_{{\rm PW}\,\textit{jet}}$). The pressure wave is then reflected at the wall (a,v), compressing the remaining bubble torus from bottom to top (a,vi) leading to the total collapse. After the collapse (a,vii–ix), a gas torus rebounds and moves towards the wall. The pressure waves due to the jet impact and toroidal collapse compare well with the visualized wave patterns of Supponen et al. (Reference Supponen, Kobel, Obreschkow and Farhat2015).
Figure 12(b) shows that the small crevice does not significantly change the collapse and rebound behaviour compared to the smooth wall. The main difference is the reflection of the pressure wave emitted at jet–bubble impact at the crevice edge (b,iii–iv) and the resulting different wave patterns.
For  $R_C/R_0 = 0.75$ (figure 12c), the crevice initially suppresses the compression of the lower part of the bubble, resulting in a different shape during jet penetration, at jet impact and also after compression by the reflected wave (c,ii–v). Furthermore, this increases the collapse time by approximately 5 % when compared to the smooth-wall case.
The pressure signals (figure 13) show that the pressure wave due to the jet–bubble impact results in a pressure peak  $p_{{\rm PW}\,\textit{jet}}$ for all configurations. For the small crevice, the pressure wave has to pass a longer distance and thus the peak is smaller. However, the reflection and superposition of the wave at the edge of the crevice results in a more intense peak following (
 $p_{{\rm PW}\,\textit{jet}\,\textit{reflected}}$).
After the collapse, all three pressure signals exhibit pressure fluctuations with significant peaks that exceed  $p_{{\rm PW}\,\textit{jet}}$. For the large crevice, these peaks are modestly higher than those of the other cases, since the collapse, the rebound and the associated wave dynamics take place closer to the wall. In addition, there are pressure peaks induced by the post-collapse wave dynamics for the large crevice.
4.6. Assessment of cavitation erosion potential
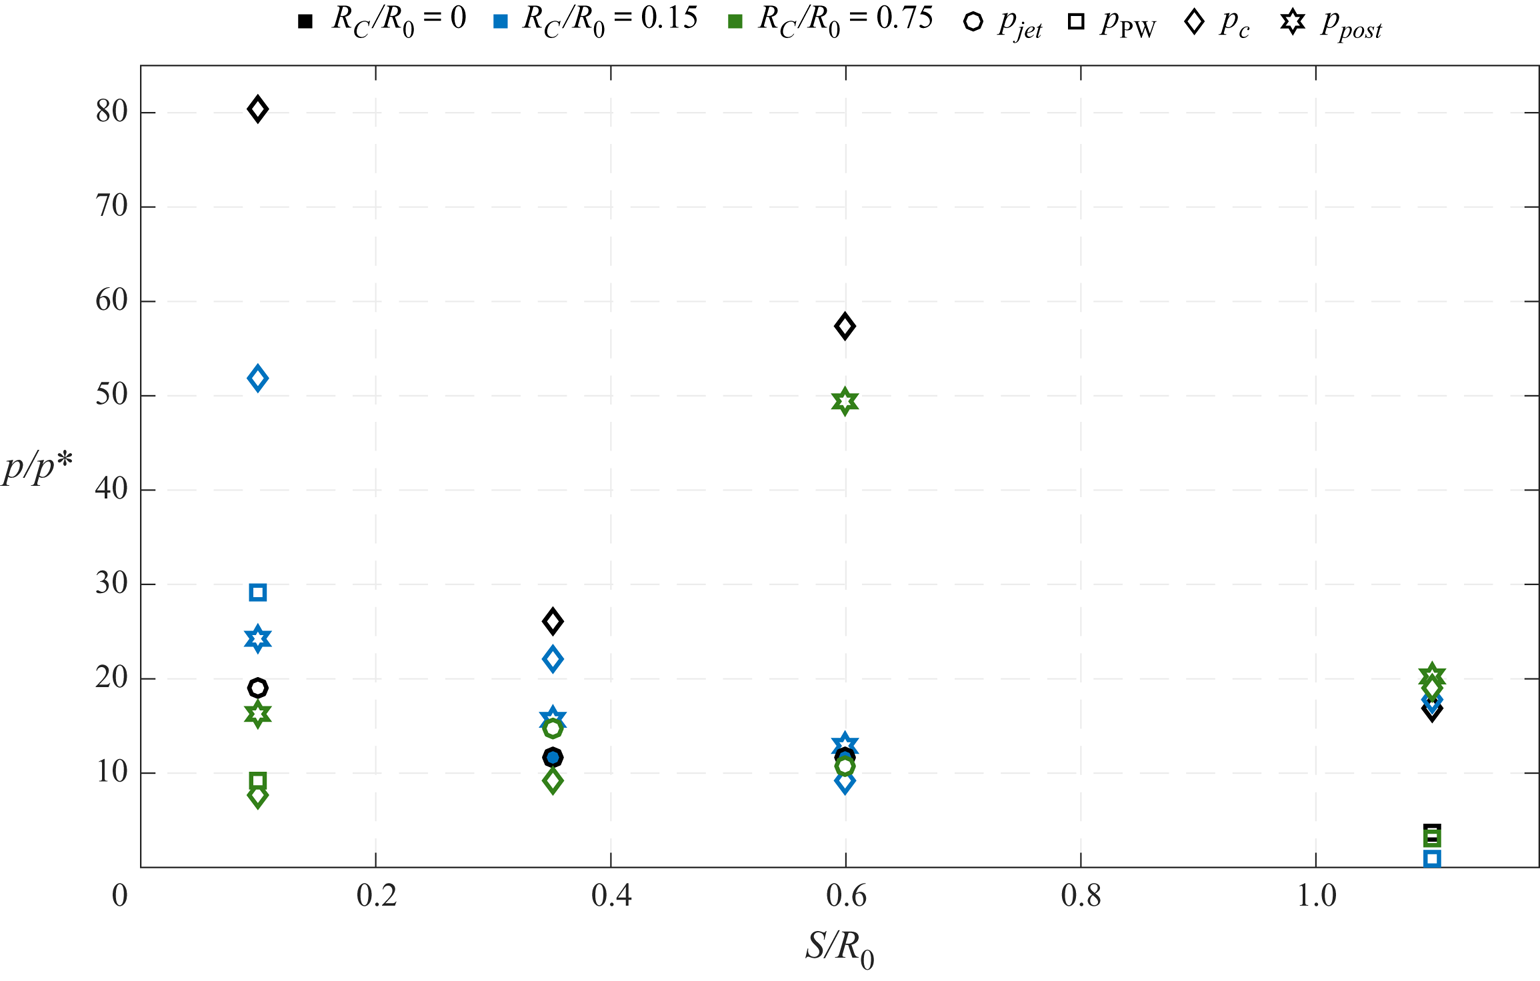
The previous sections showed that jet impact, collapse and, in certain configurations, post-collapse wave dynamics induce high pressure peaks in the crevice centre. Peak pressures are in the range of  $15\text {--}80 p^\ast$, which corresponds to approximately 2–12 GPa. These values are in good agreement with the estimated peak pressures for aspherical near-wall collapses (several GPa) (Philipp & Lauterborn Reference Philipp and Lauterborn1998) and spherical bubble collapses (approximately 12 GPa) (Supponen et al. Reference Supponen, Obreschkow, Kobel, Tinguely, Dorsaz and Farhat2017). Such high peak pressures significantly exceed the strengths of many common engineering materials, such as the 0.55 GPa ultimate tensile strength of stainless steel. Thus, there is potential for significant material erosion. To investigate this, we compare the pressures associated with the various collapse mechanisms, evaluate the induced pressure impulse and analyse the spatial distribution of maximum wall pressures.
Figure 14 compares the wall-centred pressures associated with the various processes. The jet-induced pressure peaks  $p_{\textit{jet}}$ do not vary significantly for the three wall configurations, with nearly identical values for
 $R_C = 0$ and
 $R_C/R_0 = 0.15$. At
 $S/R_0 = 0.1$,
 $R_C=0$ and at
 $S/R_0 = 0.35$,
 $R_C/R_0=0.75$, high interface accelerations and jet velocities occur, resulting in an increased
 $p_{\textit{jet}}$, as discussed in §§ 4.2 and 4.3. For
 $S/R_0 = 0.1$ with
 $R_C>0$ and for
 $S/R_0=1.1$, there are no jet-induced pressure peaks.
Pressure peaks observed at the wall centre ( $r = 0$) over the stand-off distance
 $S/R_0$ for varying crevice sizes
 $R_C/R_0$, indicated by different colours. The jet-induced pressure
 $p_{\textit{jet}}$, collapse-induced pressure
 $p_c$ and pressure from the subsequent wave dynamics
 $p_ {\textit{post}}$ are shown. For cases with no
 $p_{\textit{jet}}$, the pressure peak induced by initial pressure waves
 $p_{\textrm {PW}}$ is shown instead. Note that no
 $p_ {\textit{post}}$ is observed for smooth-wall configurations.

The collapse-induced pressure  $p_c$ is higher for the smooth wall than for the creviced configurations. At the smooth wall, the final collapse position is closer to the wall centre (
 $r=0$) and a larger gas volume is associated with the final collapse phase. For the large crevice,
 $p_c$ is significantly smaller than that of the other configurations. In these cases, a smaller gas volume is associated with the final collapse due to a preceding collapse of an inner detached torus, see § 4.4. Furthermore, the final collapse is in the crevice corner and thus the intensity of the pressure waves decreases until they reach
 $r=0$.
For the creviced configurations, high pressure peaks can be caused by the wave dynamics present after collapse. These peaks can be close to the maximum pressure induced in the smooth-wall configuration (see  $S/R_0 = 0.6$), indicating erosion potential. For the detached configuration all pressure impacts are of comparable intensity.
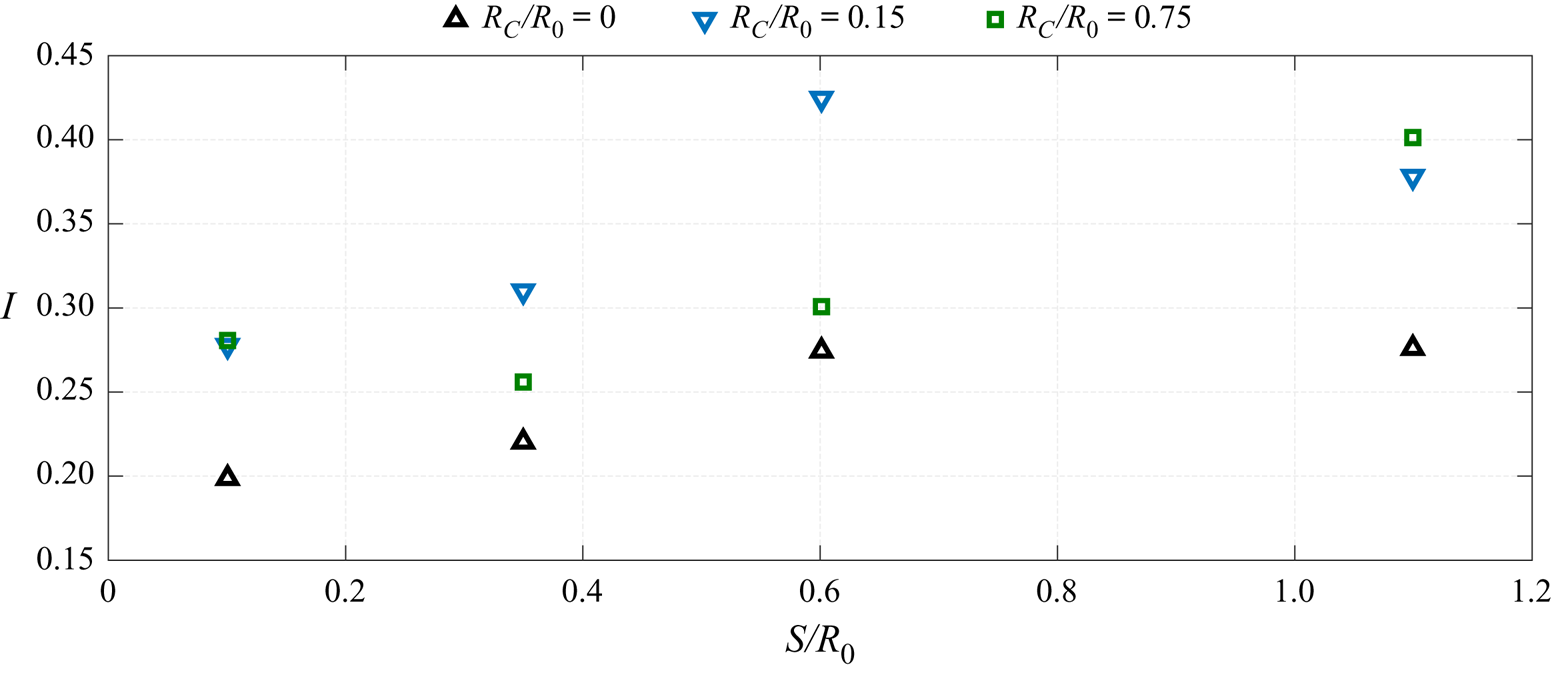
Figure 15 shows the pressure impulse at the crevice centre,
 \begin{gather} I = \frac{1}{1.5 t^{\ast} p^{\ast}}\int_{0}^{1.5 t^{\ast}}\bigl(p(t)-p(t=0)\bigr) \,\mathrm{d} t, \end{gather}
which takes into account whether an increased pressure is present over a longer period of time. In contrast to the maximum wall pressure, the impulse is not biased by single instantaneous peak values. Despite the smaller maximum  $p$ for the creviced cases, the impulse for these configurations is larger than that for the smooth-wall cases. For the small crevice,
 $I$ is approximately 50 % larger than at the smooth wall at all stand-off distances.
Pressure impulse  $I$ at the wall centre (
 $r = 0$) over the stand-off distance
 $S/R_0$ for varying crevice sizes
 $R_C/R_0$, indicated by different colours and symbols.

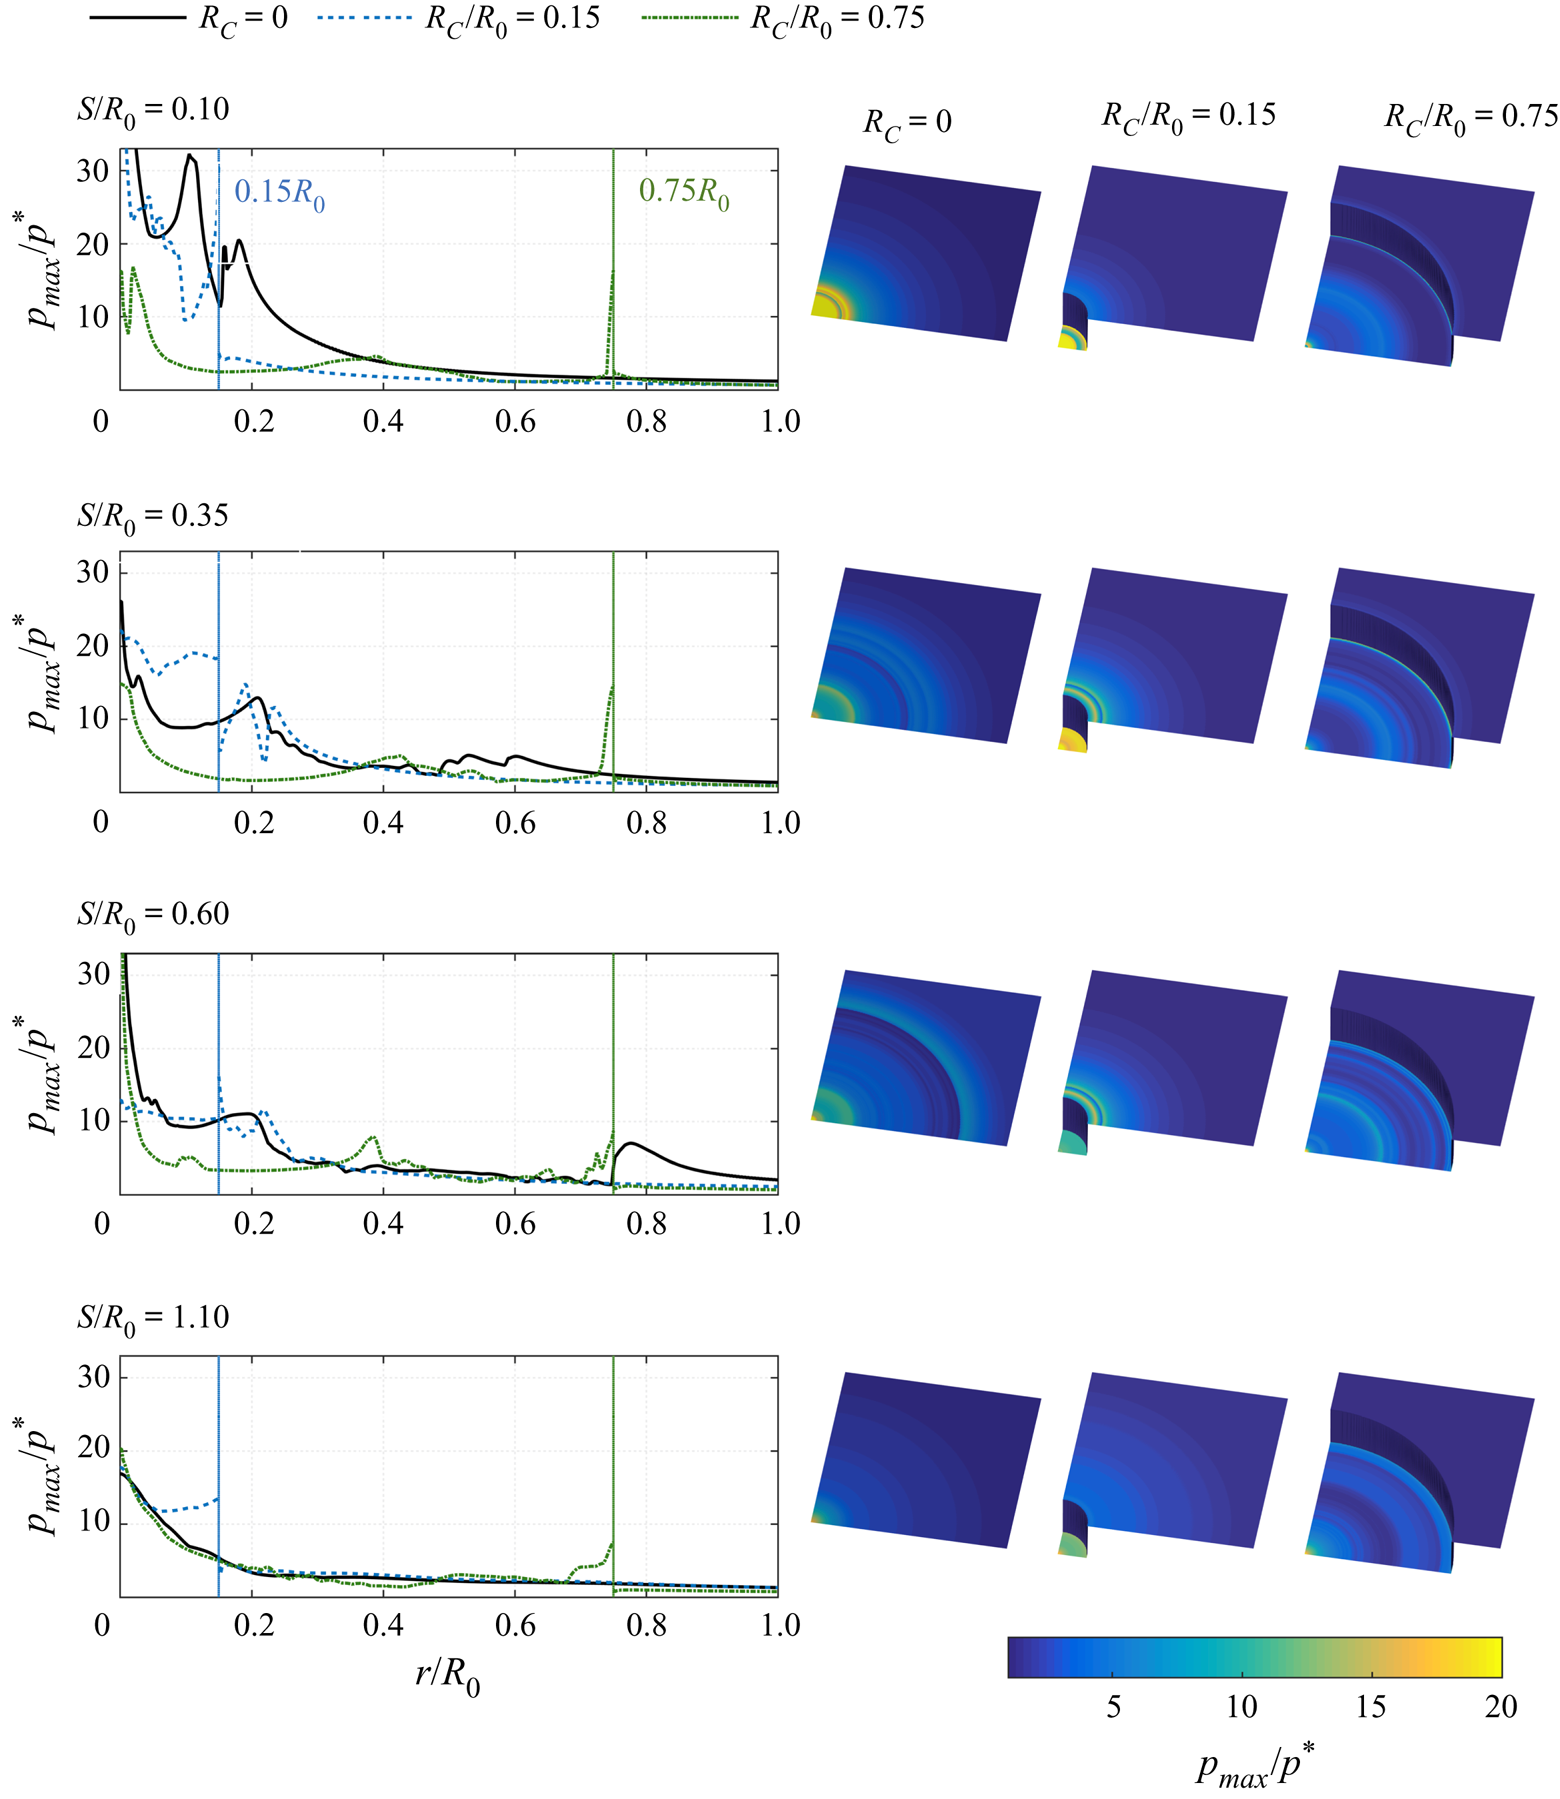
Figure 16 shows the maximum wall pressure  $p_{\textit{max }}$ at varying radial locations and a visualization of the
 $p_{\textit{max }}$ distribution. First the attached configurations are discussed by crevice size and then the detached ones.
Maximum wall pressure  $p_{\textit{max }}$ of the entire bubble collapse process for varying radial locations
 $r$ with rows corresponding to the stand-off distances
 $S/R_0$. First column:
 $p_{\textit{max }}$ over
 $r$, where the pressure axes are truncated to promote visibility; the maximum values over all
 $r$ are shown in figure 14. Second to fourth column: three-dimensional visualization of the maximum wall pressure for each crevice size.

For the smooth-wall configurations, there is a collapse-induced peak in  $p_{\textit{max }}$ at the centre with a significant radial decay. In addition, modest pressure peaks are observed at approximately
 $r\approx 0.2 R_0$, where the torus collapses. This pressure distribution is in agreement with predicted damage patterns by Philipp & Lauterborn (Reference Philipp and Lauterborn1998), who found ring-shaped damage (
 $r\approx 0.3 R_0$) and a smooth indentation at the wall centre.
For the small crevice, significant pressure peaks are induced over the entire crevice bottom. They are especially high at  $S/R_0 = 0.35$, where they exceed those of the smooth wall. On the upper wall there are peaks at approximately
 $r \approx 0.2 R_0$ which are related to the torus collapsing at this position (see figure 8). For the small stand-off distance
 $S/R_0 = 0.1$ no increased maximum pressures are observed at the upper wall, because the collapse takes place within the crevice.
For the large crevice, the collapse of the detached gas torus results in a modest pressure peak at  $r \approx 0.4 R_0$, as described in § 4.4. This gas torus is largest for the
 $S/R_0 = 0.6$ case, and thus leads to the highest pressures at this position. The total collapse is in the crevice corner (
 $r = R_C$) and induces large pressures at this location. Furthermore, at
 $S/R_0 = 0.1$, two pressure peaks are observed near
 $r = 0$. The impact of the circular jet results in the off-centre peak, while the shock wave after the collapse results in the
 $r = 0$ maximum pressure.
For all detached-bubble cases, the maximum  $p_{\textit{max }}$ occurs at
 $r = 0$, and decays with increasing
 $r$, apart from a modest increase at
 $r = R_C$. For the small crevice, there is again a high pressure impact over the entire
 $r< R_C$ area. Nevertheless, overall, the effect of
 $R_C$ on
 $p_{\textit{max }}$ appears to decrease with increasing
 $S$.
Three distinct processes can cause high pressures at the crevice walls and, thus, potential damage: the jet impact, the primary collapse and post-collapse wave interactions. For smooth-wall cases, the pressure peaks are most significant at the wall centre and cavitation erosion can be expected at this location. For the small-crevice cases, a high pressure occurs across the entire crevice bottom, leading to a broader area of possible cavitation erosion. For the large-crevice cases, the pressure peaks seen at the crevice corners are also significant, and cavitation erosion is possible at these locations as well.
5. Conclusion
The collapse of a single gas bubble attached or near to a smooth or creviced surface was investigated using high-resolution simulations. Variations of the stand-off distance of the bubble centre from the wall and the crevice size were considered. Changing these parameters significantly alters the behaviour of the bubble collapse and its associated impact on the wall.
For smooth-wall configurations the final collapse of the bubble results in the maximum wall pressure, rather than the liquid jet that impinges it. This is in agreement with experimental studies. A similar behaviour is observed for smaller crevice sizes, while for larger crevices the jet-induced pressures are more significant than the collapse pressures. The presence of the crevice results in a complex collapse process and wave dynamics due to reflection and wave superposition can induce significant post-collapse pressures.
The part of the bubble interface initially in contact with the high-pressure liquid plays an important role in the collapse behaviour. The bubble collapse behaviour was qualitatively similar for the smooth-wall and small-crevice cases, since the pressure distribution at the interface was comparable. However, large crevices led to a significantly different bubble–liquid interface area, and thus qualitatively different dynamics. The effect of the wall geometry on the collapse behaviour and wall pressure was smaller for wall-detached cases.
Lastly, we considered the potential for cavitation erosion. Pressures were recorded over a larger part of the wall. The presence of the small crevice leads to a significant pressure over the entire crevice bottom, as opposed to the smooth-wall cases, where the largest pressures occurred at the wall centre. For all rough-wall configurations, high pressures also occur at the crevice edges, where they induce stresses that can result in material damage. The pressure impulse also increased by approximately 50 % from the smooth-wall to the small-crevice case, indicating an increased potential for material damage.
While assessing the effects of the surface topology on the hydrodynamics is a necessary step towards understanding this complex process, prediction of actual cavitation erosion also requires investigations of exposed materials. Coupled fluid–material simulations that incorporate suitable material models, and thus also represent elastic and plastic deformation, are one way to accomplish such investigations.
Acknowledgments
The research stay of T.T. at Caltech was supported by the Deutscher Akademischer Austauschdienst (DAAD), the TUM Graduate School, and the ERC Advanced Grant NANOSHOCK (2015). S.H.B., K.S., and T.C. acknowledge support from the US Office of Naval Research under grant numbers N0014-18-1-2625 and N0014-17-1-2676.
Declaration of interests
The authors report no conflict of interest.
Supplementary movies
Supplementary movies are available at https://doi.org/10.1017/jfm.2020.432.