





The transition from late childhood into early adolescence is one of rapid physical, mental, and emotional development. As youth begin puberty, some may begin to experience mental health concerns, including internalizing (e.g., anxious and depressive symptoms) and/or externalizing (e.g., rule-breaking and aggression) behaviors (Nivard et al., Reference Nivard, Lubke, Dolan, Evans, St. Pourcain, Munafò and Middeldorp2017). Internalizing behaviors increase, on average, during adolescence (Smárason et al., Reference Smárason, Skarphedinsson and Storch2024). Externalizing behaviors, which tend to decrease, on average, in childhood also start to show increases beginning in early adolescence (Murray & Farrington, Reference Murray and Farrington2010). This is concerning given extensive evidence that greater internalizing and externalizing behaviors in adolescence are associated with poorer outcomes in adulthood, such as lower academic achievement, poor financial health, increased substance use, and other mental health concerns (Gremmen et al., Reference Gremmen, Berger, Ryan, Steglich, Veenstra and Dijkstra2019; Hale et al., Reference Hale, Bevilacqua and Viner2015; Iacono et al., Reference Iacono, Carlson, Taylor, Elkins and McGue1999; McLaughlin & King, Reference McLaughlin and King2015). Mental health concerns are potentially amplified in LGBTQ+ (lesbian, gay, bisexual, transgender, queer, and beyond) youth, who experience unique physical and social stressors (Brooks, Reference Brooks1981; Frost & Meyer, Reference Frost and Meyer2023; Meyer, Reference Meyer2003). In order to better understand the mental health needs of LGBTQ+ youth as they enter adolescence, we examined developmental trajectories of internalizing and externalizing behaviors among LGBTQ+ youth, relative to their heterosexual and cisgender (hereafter non-LGBTQ+) peers, during late childhood into early adolescence.
Mental health disparities
Research on the development of sexual and gender minority individuals has rapidly expanded in the past fifty years. One of the most prominent domains of research with this population is mental health. A growing body of literature demonstrates that LGBTQ+ youth experience significant disparities in both internalizing and externalizing behaviors.
Internalizing
The majority of research on mental health among LGBTQ+ youth has been conducted with sexual minority youth, including among different sexual identity-types. Research has consistently indicated that sexual minority youth show elevated levels of depression, anxiety, and suicidal ideation and behaviors compared to heterosexual youth (Bista et al., Reference Bista, Werner-Seidler, Maston, Lin, Perry, Davies, Graham, Christensen, Marino and Skinner2025b; Gower et al., Reference Gower, Rider, Brown and Eisenberg2022; Irish et al., Reference Irish, Solmi, Mars, King, Lewis, Pearson, Pitman, Rowe, Srinivasan and Lewis2019; Jones et al., Reference Jones, Robinson, Oginni, Rahman and Rimes2017; Kerr et al., Reference Kerr, Santurri and Peters2013; Lucassen et al., Reference Lucassen, Stasiak, Samra, Frampton and Merry2017; Mahon et al., Reference Mahon, Lombard-Vance, Kiernan, Pachankis and Gallagher2022; Marshal et al., Reference Marshal, Dietz, Friedman, Stall, Smith, McGinley, Thoma, Murray, D’Augelli and Brent2011; Ross et al., Reference Ross, Salway, Tarasoff, MacKay, Hawkins and Fehr2018; Taliaferro et al., Reference Taliaferro, Gloppen, Muehlenkamp and Eisenberg2018; Wittlin et al., Reference Wittlin, Kuper and Olson2023). For example, a recent second-order systematic review and meta-analysis found that the prevalence rate of depression in sexual minority youth is around 26%, with a higher degree of severity compared to heterosexual youth (Hedges g = 0.38) (O’Shea et al., Reference O’Shea, Jenkins, Nicholls, Downs and Hudson2025). This is in comparison to another meta-analysis in the broader youth population, which found comparatively lower rates of depression overall, with a pooled prevalence of mild-to-severe, moderate-to-severe, and major depression of 21.3%, 18.9%, and 3.7%, respectively (Lu et al., Reference Lu, Lin and Su2024). Critically, recent data indicates that between 39% and 41% of sexual minority youth experience suicidal ideation (Nath et al., Reference Nath, Matthews, DeChants, Hobaica, Clark, Taylor and Muñoz2024). There is also evidence of variation in risk across sexual minority identities, including between monosexual (e.g., lesbian/gay) and plurisexual (e.g., bisexual, pansexual) youth, as well as among asexual youth, with the largest body of evidence concentrated on bisexual youth (Chai, Reference Chai2024; Gnan et al., Reference Gnan, Rahman, Ussher, Baker, West and Rimes2019; Ross et al., Reference Ross, Salway, Tarasoff, MacKay, Hawkins and Fehr2018; Shearer et al., Reference Shearer, Herres, Kodish, Squitieri, James, Russon, Atte and Diamond2016).
There is less research on transgender-specific mental health, but the available data suggests that transgender youth are at an even greater risk for maladaptive outcomes (Fish, Reference Fish2020). Transgender youth have some of the highest observed disparities in suicide, depression, and substance use compared to both cisgender/heterosexual youth and sexual minority youth (Bista et al., Reference Bista, Werner-Seidler, Maston, Lin, Perry, Davies, Graham, Christensen, Marino and Skinner2025b; Green et al., Reference Green, DeChants, Price and Davis2022). Alarmingly, 46% of transgender youth experience suicidal ideation (Nath et al., Reference Nath, Matthews, DeChants, Hobaica, Clark, Taylor and Muñoz2024). Nath et al. (Reference Nath, Matthews, DeChants, Hobaica, Clark, Taylor and Muñoz2024) also found that the suicide attempt rate for transgender adolescents was 14%, but, as transgender youth transition into adulthood that rate climbs to 40% by some estimates (James et al., Reference James, Herman, Rankin, Keisling, Mottet and Anafi2016; Kidd et al., Reference Kidd, Tettamanti, Kaczmarkiewicz, Corbeil, Dworkin, Jackman, Hughes, Bockting and Meyer2023). By comparison, the U.S. Centers for Disease Control and Prevention (CDC) estimates that the past-year suicide attempt rate for cisgender heterosexual high school youth is around 6% (CDC, 2024).
Externalizing
Externalizing behavior includes both disinhibited behaviors, such as substance use and risky behavior, and antagonistic behaviors, such as rule-breaking and aggression. There are well-established disparities in substance use patterns between LGBTQ+ youth and non-LGBTQ+ youth (Fish et al., Reference Fish, Bishop and Russell2021; Gerke et al., Reference Gerke, Atteberry-Ash, Call and Hostetter2024; Marshal et al., Reference Marshal, Friedman, Stall, King, Miles, Gold, Bukstein and Morse2008; Mereish et al., Reference Mereish, Lee, Goldbach, Hathaway and Hennessy2025; Pellicane et al., Reference Pellicane, Quinn and Ciesla2025), as well as evidence of increased sexual risk taking (Dellucci et al., Reference Dellucci, O’Reilly, Pederson, Gillenwater, Hulvershorn, Aalsma and Adams2026; Diana & Esposito, Reference Diana and Esposito2024; Travers et al., Reference Travers, Murray and Kull2022). However, there is considerably less research that has examined the developmental trajectories of the more antagonistic forms of externalizing in LGBTQ+ youth. The small body of existing literature is predominantly cross-sectional and provides some evidence that LGBTQ+ youth exhibit increased rule-breaking and aggressive behaviors (Fix et al., Reference Fix, Nava and Rodriguez2022; Lowry et al., Reference Lowry, Kennedy, Johns, Harper and Wilkins2022; Ocasio et al., Reference Ocasio, Tapia, Lozano, Carrico and Prado2022; Rocheleau et al., Reference Rocheleau, Rocheleau, Piatak and Thompson2024).
Minority stress theory
It is critical to note that observed disparities in internalizing and externalizing behaviors between LGBTQ+ and non-LGBTQ+ youth are not due to having a minoritized identity alone. Instead, these observations can be viewed through the lens of minority stress theory (Brooks, Reference Brooks1981; Frost & Meyer, Reference Frost and Meyer2023; Meyer, Reference Meyer2003). Originally conceptualized by Brooks (Reference Brooks1981) to describe the unique stressors faced by minoritized populations such as sexual and gender minority individuals, this theory was later formalized by Meyer in 2003 and has been expanded upon over the years (Frost & Meyer, Reference Frost and Meyer2023; Hatzenbuehler, Reference Hatzenbuehler2009; Meyer, Reference Meyer2003; Rivas-Koehl et al., Reference Rivas-Koehl, Rivas-Koehl and McNeil Smith2023). Critically, research indicates that experiencing distal minority stressors, such as victimization and homophobic discrimination, as well as proximal minority stressors, such as rumination and identity concealment, are associated with increased levels of both internalizing and externalizing in both sexual minority youth and gender minority youth (Dennis & Davis, Reference Dennis and Davis2026; Jardas et al., Reference Jardas, Ladd, Maheux, Choukas-Bradley, Salk and Thoma2023; Morgan et al., Reference Morgan, Martin-Storey, Lapalme, Déry and Temcheff2025; Sarno et al., Reference Sarno, Newcomb and Mustanski2020; Swann et al., Reference Swann, Forscher, Bettin, Newcomb and Mustanski2019).
A central question raised by this body of work is via what mechanisms minority stress is associated with psychopathology. Hatzenbuehler (Reference Hatzenbuehler2009) proposes that minority stress confers risk for mental health difficulties in part through general psychological processes that are not unique to LGBTQ+ populations but that they are disproportionately burdened by. Among these processes, emotion regulation has been identified as a key transdiagnostic mechanism linking adversity to distress (Hatzenbuehler, Reference Hatzenbuehler2009; Sloan et al., Reference Sloan, Hall, Moulding, Bryce, Mildred and Staiger2017). A recent systematic review and meta-analysis (Camp et al., Reference Camp, Blundell, Smith and Rimes2025) provides direct empirical support for this account: gender and sexual minority groups reported greater difficulties than cisgender-heterosexual individuals across global emotion regulation and most specific domains, including emotion clarity, nonacceptance of emotions, access to regulation strategies, goal-directed behavior, and impulse control. This positions emotion regulation as a plausible shared mechanism capable of accounting for elevations in both internalizing and externalizing domains simultaneously.
Complementing this focus on mechanisms, other research examines how internalizing and, to a lesser extent, externalizing behaviors, develop over time. Although longitudinal work on antagonistic externalizing specifically remains limited, as noted above, a broader body of longitudinal research grounded in minority stress theory has tracked internalizing – and in some cases externalizing – development in LGBTQ+ youth from adolescence into adulthood. Birkett et al. (Reference Birkett, Newcomb and Mustanski2015), for example, followed a sample of LGBTQ youth across six waves from ages 16 to 24 and found that psychological distress declined into early adulthood, closely mapping to a co-occurring decline in victimization; prior victimization predicted later distress even after accounting for earlier distress, whereas social support did not. In addition, Martin-Storey et al. (Reference Martin-Storey, Lemelin, Temcheff and Dery2020) found that sexual minority youth exhibited higher levels of youth-reported internalizing and externalizing behavior problems one year later than their propensity-score-matched heterosexual peers. Importantly, this disparity was conditioned by childhood temperament measured years earlier: among youth higher in surgency/extraversion, the gap in both internalizing and externalizing problems was more pronounced. The authors interpreted this as consistent with a visibility-based account of risk: more outgoing, socially engaged youth may be more likely to be perceived or identified by peers as sexual minorities, increasing their exposure to the stigma and victimization that drive these disparities. Findings such as these situate minority stress within a developmental framework and identify victimization and discrimination as a mechanism driving change in psychopathology over time. Notably, however, the existing longitudinal evidence has been concentrated in mid-to-late adolescence and the transition to adulthood, leaving the earlier transition from late childhood into early adolescence, when internalizing and externalizing behaviors may first emerge and intensify, comparatively unexamined.
The present study
We aimed to extend the existing longitudinal evidence on the developmental trajectories of internalizing and externalizing, specifically antagonistic externalizing, behaviors in LGBTQ+ youth during the transition from late childhood to early adolescence. Most national datasets of youth in the United States, such as the Youth Risk Behavior Survey (YRBS; CDC, 2024), can provide some estimates of prevalence of behavior, but are limited by their cross-sectional nature. The Adolescent Brain Cognitive Development (ABCD) Study is a longitudinal, nationally representative investigation that provides researchers with the opportunity to examine mental health trends across a sample of sexual and gender minority youth over time. One recent study that used the ABCD dataset found that sexual minority youth reported higher rates of stigmatic experiences and overall increased psychopathology compared to heterosexual youth (Gordon et al., Reference Gordon, Tran, Visoki, Argabright, DiDomenico, Saiegh, Hoffman, Erez and Barzilay2024), but this study did not examine gender minority youth or parse apart psychopathology dimensions. A better understanding of externalizing behaviors, in addition to internalizing behaviors, among LGBTQ+ youth is needed to provide the best supports.
In the present, preregistered study, we examined the developmental trajectories of internalizing and externalizing behaviors from late childhood into early adolescence among youth participating in the ABCD Study. We hypothesized that youth who identified as LGBTQ+ would have higher levels of both internalizing and externalizing behaviors in late childhood relative to their non-LGBTQ+ peers, and that internalizing and externalizing behaviors would show more rapid increases as LGBTQ+ youth transitioned into early adolescence.
Method
Participants and procedures
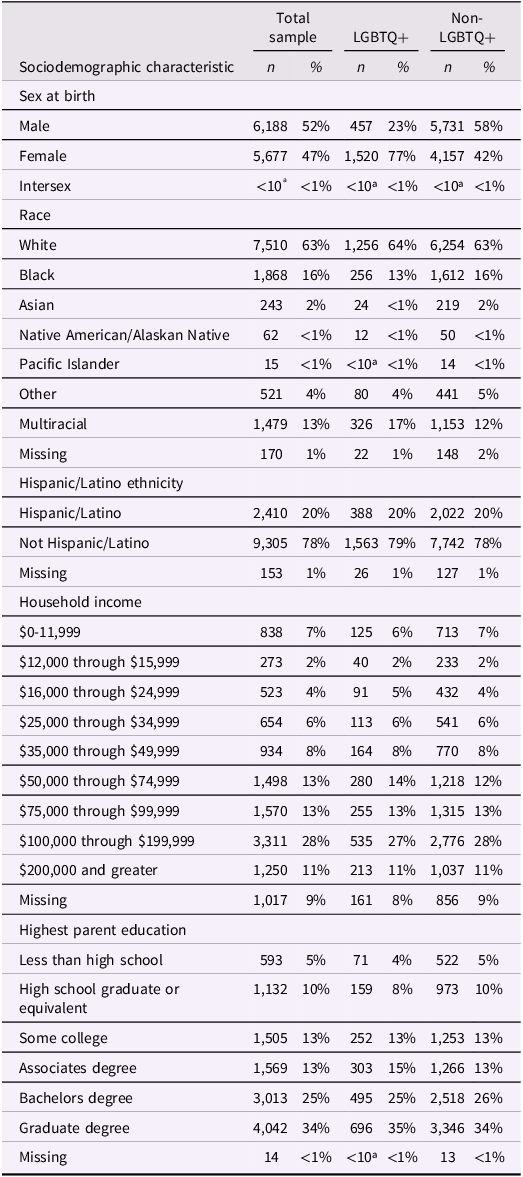
The ABCD Study examines the biological and behavioral development of 11,878 youth and their parents/caregivers (hereafter parents) who participated at 21 research sites in the United States. The sample is broadly representative of the United States youth in socioeconomic indicators, urbanity/rurality, and race/ethnicity (Table 1) (Garavan et al., Reference Garavan, Bartsch, Conway, Decastro, Goldstein, Heeringa, Jernigan, Potter, Thompson and Zahs2018). Study enrollment began in 2016, and youth were first assessed when they were age 9/10 years, with regular follow-up assessments every 6 months to 1 year planned until age 19/20. The present study used data from the 5.1 data release in 2024 for all 11,878 participating youth at age 9/10 (baseline), 11,220 (94.5%) at age 10/11 (follow-up one), 10,973 (92.4%) at age 11/12 (follow-up two), and 10,336 (87.0%) at age 12/13 (follow-up three). Due to small amounts of attrition and missed assessments (LGBTQ+ youth: n = 163 [8.2%]; non-LGBTQ+ youth: n = 864 [8.7%]), the final analytical sample included n = 10,842 youth.
Sociodemographic characteristics of participants at 9/10 (baseline)
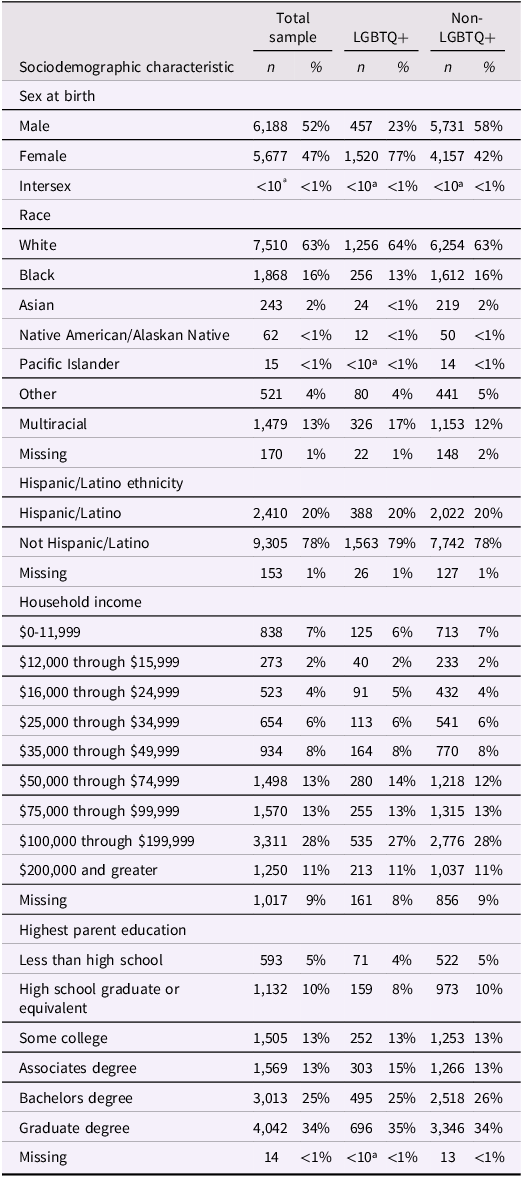
Table 1. Long description
The table presents sociodemographic characteristics of participants at age 9/10, categorized by total sample, LGBTQ+, and non-LGBTQ+ groups. It includes data on sex at birth, race, Hispanic/Latino ethnicity, household income, and highest parent education. The table has 18 rows and 6 columns. Column headers are Total sample, LGBTQ+, and Non-LGBTQ+, each with sub-columns for count (n) and percentage (%). Row labels include categories like Male, Female, Intersex for sex at birth; White, Black, Asian, etc., for race; Hispanic/Latino, Not Hispanic/Latino for ethnicity; various income ranges for household income; and different education levels for highest parent education. Each row provides the count and percentage of participants in each category for the total sample, LGBTQ+, and non-LGBTQ+ groups.
Note. Group membership reflects endorsement of a sexual and/or gender minority identity at any of the four assessment waves. Percentages are column percentages within each group. Missing data reflect refusal to answer or missing responses.
aFollowing ABCD reporting guidelines, cells with n < 10 are suppressed. Hispanic/Latino ethnicity is reported separately from race. Race and ethnicity are presented here to contextualize the sample but were not included as covariates in the models. Group differences were assessed with Pearson’s Chi-square tests (missing values excluded): sex, χ2 (2) = 802.35, p <.001; race, χ2 (4) = 51.06, p <.001 (Native American/Alaskan Native and Pacific Islander collapsed with Other); Hispanic/Latino ethnicity, χ2 (1) = 0.62, p =.430; household income, χ2 (8) = 8.86, p =.354; highest parent education, χ2 (5) = 23.92, p <.001.
Measures
Sociodemographic characteristics
Parents reported on youth age, sex assigned at birth, race/ethnicity, household income, and primary/secondary (if applicable) parent education at youth age 9/10. A socioeconomic status (SES) composite score was created by averaging the standardized z-scores of household income and the highest reported parental education level.
LGBTQ+ identification
Youth completed the Kiddie Schedule for Affective Disorders and Schizophrenia (K-SADS) (Kaufman & Schweder, Reference Kaufman, Schweder, Hilsenroth and Segal2004) at baseline (age 9/10), 1-year follow-up (10/11), 2-year follow-up (11/12), and 3-year follow-up (12/13). The K-SADS background module includes the items “Are you gay or bisexual?” and “Are you transgender?” Responses were coded categorically (e.g., “yes,” “maybe,” “no,” or “I don’t understand the question”). We coded youth as a sexual or gender minority in multiple combinations to allow for an overall comparison of LGBTQ+ youth versus cisgender/heterosexual youth. First, we created an LGBTQ+ omnibus variable to compare overall trajectories of internalizing and externalizing between LGBTQ+ youth broadly and youth who are heterosexual and cisgender. Next, we created a series of variables that separated out varying response patterns of sexual and gender minority identities.
To compare trajectories of mental health among sexual minority youth or youth questioning their sexual orientation to trajectories of mental health among heterosexual youth, three additional variables were created. First, we isolated cisgender youth who answered “yes” to having a sexual minoritized identity (e.g., gay, bisexual) to compare to cisgender heterosexual youth. Then, we created a variable to compare cisgender questioning (i.e., responded “maybe”) youth to cisgender heterosexual youth. Last, consistent with prior studies using the LGBTQ+ subsample of youth in the ABCD Study, we created a combined variable of cisgender sexual minority youth (combining across youth who answered “yes” and “maybe”) to compare to cisgender heterosexual youth (Gordon et al., Reference Gordon, Tran, Visoki, Argabright, DiDomenico, Saiegh, Hoffman, Erez and Barzilay2024; Potter et al., Reference Potter, Dube, Barrios, Bookheimer, Espinoza, Feldstein Ewing, Freedman, Hoffman, Ivanova, Jefferys, McGlade, Tapert and Johns2022).
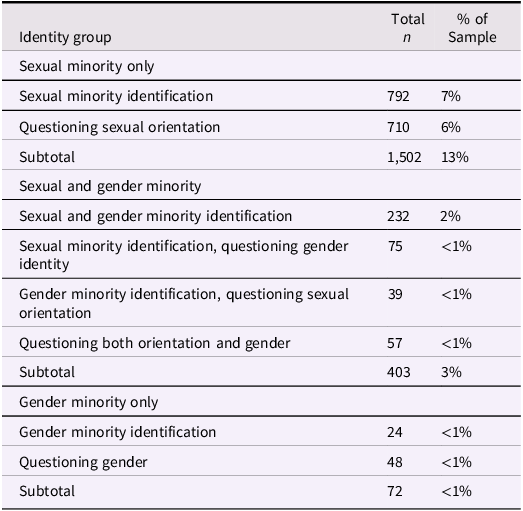
To compare trajectories of mental health among gender minority youth or youth questioning their gender identity to trajectories of mental health among cisgender youth, a similar variable creation strategy was used. Most gender minority youth also identified as a sexual minority. Thus, we first created a variable that identified youth who answered “yes” to being transgender while also having a sexual minority identity compared to cisgender, heterosexual youth. Next, we created a variable that identified youth who responded “maybe” to the transgender item while allowing for sexual minority status compared to cisgender heterosexual youth. Then, we created two final variables of heterosexual youth who responded “yes” or “maybe” to having a gender minority identity compared to heterosexual cisgender youth. All variable ns are located in Table 2.
Sexual and gender minority identity classification (Endorsement at any wave)
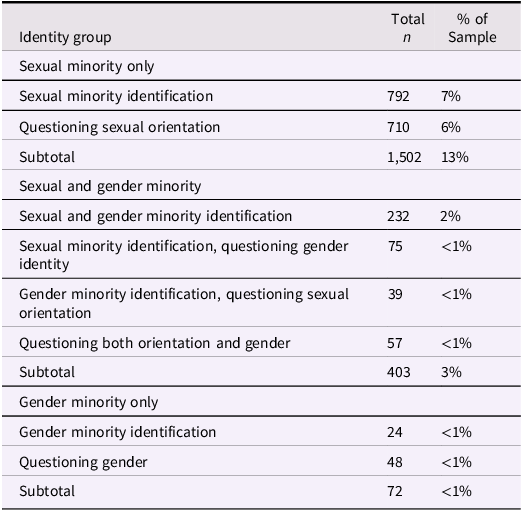
Table 2. Long description
The table categorizes identity groups and their percentages within a sample. It has 11 rows and 3 columns. The columns are labeled Identity group, Total n, and % of Sample. The table is divided into three main sections: Sexual minority only, Sexual and gender minority, and Gender minority only. Each section lists specific identity groups and their corresponding total numbers and percentages. For example, Sexual minority identification has a total of 792 and represents 7 percent of the sample. The table provides detailed breakdowns of various identity groups and their representation within the sample.
Note. N = 11,868. Groups are mutually exclusive and reflect endorsement at any of the four assessment waves. “Identification” denotes ever endorsing the defining identity (“yes”) on the relevant item; “questioning” denotes endorsing only the “maybe” response on that item and never “yes.” Within the sexual and gender minority group, rows cross-classify certainty on the sexual-orientation and gender-identity items. The remaining 9,891 youth (83%) were cisgender heterosexual (reference group).
Youth mental health
Parents completed the Child Behavior Checklist (CBCL; Achenbach & Rescorla, Reference Achenbach and Rescorla2001) at baseline (age 9/10), 1-year follow-up (10/11), 2-year follow-up (11/12), and 3-year follow-up (12/13). The CBCL consists of 113 items ranging from 0 (not true) to 2 (very true or often true) that are summed for scores on youth internalizing (withdrawn/depressed, anxious/depressed, somatic complaints subscales) and externalizing (rule-breaking behavior, aggression subscales) problems. Raw internalizing and externalizing problems scores were used in analyses. Across all time points, both the internalizing and externalizing scales demonstrated high internal consistency in the full sample of youth (age 9/10: internalizing α = 0.87, externalizing α = 0.90; age 10/11: internalizing α = 0.87, externalizing α = 0.90; age 11/12: internalizing α = 0.88, externalizing α = 0.90; age 12/13: internalizing α = 0.89, externalizing α = 0.90) and comparably for both LGBTQ+ and non-LGBTQ+ youth (all αs > 0.85).
Analytic plan
We first conducted preliminary analyses, including descriptive statistics for sociodemographic variables and internalizing and externalizing behaviors for the full sample and separately for LGBTQ+ and non-LGBTQ+ youth.
We then conducted a series of linear mixed-effects models that accounted for the repeated measures and nested data (youth within families within study sites) to examine the developmental trajectories of internalizing and externalizing behaviors (in separate models) from late childhood into early adolescence in LGBTQ+ and non-LGBTQ+ youth. In all models, developmental time was operationalized by age in years, centered at age 9/10 so that model intercepts reflect mean levels of internalizing and externalizing behaviors at age 9/10 and model slopes represent change from age 9/10 to age 12/13. A series of eight models were fit for both internalizing and externalizing. First, we compared cisgender youth who explicitly responded “yes” to the sexual minority item to cisgender, heterosexual youth. Then, we compared cisgender youth who responded “maybe” to the sexual minority item to cisgender heterosexual youth. Next, and mirroring previous ABCD publications, we combined cisgender youth who responded “yes” or “maybe” to the sexual minority item, encompassing the broader classification of “LGBQ+” (lesbian/gay, bisexual, and questioning) (Gordon et al., Reference Gordon, Tran, Visoki, Argabright, DiDomenico, Saiegh, Hoffman, Erez and Barzilay2024; Potter et al., Reference Potter, Dube, Barrios, Bookheimer, Espinoza, Feldstein Ewing, Freedman, Hoffman, Ivanova, Jefferys, McGlade, Tapert and Johns2022).
Because gender minority youth have distinct experiences from both cisgender/heterosexual youth and cisgender sexual minority youth, we conducted separate analyses to assess differences in trajectories of mental health in gender minority youth compared to cisgender and heterosexual youth (Heshmatnia et al., Reference Heshmatnia, Jafari, Karimi, Giri and Thapa2026; Hollinsaid et al., Reference Hollinsaid, Weisz, Chorpita, Skov and Price2020; Johns et al., Reference Johns, Beltran, Armstrong, Jayne and Barrios2018). First, we compared all youth who explicitly responded “yes” to the transgender item, intentionally retaining individuals with co-occurring sexual minority identities to cisgender heterosexual youth. Then, we compared youth responding “maybe” to the transgender item, similarly allowing for dual sexual minority status compared to cisgender heterosexual youth. Lastly, we accounted for heterosexual gender minority youth in two final models using the pattern described above, compared to cisgender heterosexual youth.
We report both unstandardized (B) coefficients in raw CBCL score units for their practical interpretability and standardized (β) coefficients with confidence intervals to allow for the comparison of the magnitude of effect sizes. All models included an SES composite and sex assigned at birth as covariates, included random intercepts for family and study site, and used full information maximum likelihood (FIML) to handle missing data. All analyses were conducted using R software and the “lme4” package v.1.1–37 (Bates et al., Reference Bates, Mächler, Bolker and Walker2015; R Core Team, 2026) and “psych” package v.2.5.6 (Revelle, Reference Revelle2007).
Transparency and openness
This study was preregistered prior to the authors accessing the specific variables used in this study or conducting analyses. The ABCD Study dataset is available to the scientific community and can be accessed using the NIH Brain Development Cohort data hub (Haist & Jernigan, Reference Haist and Jernigan2023). The preregistration, code, and output are located on the Open Science Framework (OSF) website (Santos et al., Reference Santos, Roisman and Wilson2024). We followed the preregistered plan for the omnibus comparisons of LGBTQ+ versus non-LGBTQ+ youth on trajectories of internalizing and externalizing behaviors and, at the suggestion of the editor and an anonymous reviewer, also included additional comparisons that were not preregistered that disaggregated the larger LGBTQ+ group into eight subgroup models distinguishing sexual minority from gender minority identification and explicit (“yes”) from questioning (“maybe”) identity status. This study involved analysis of existing data and was considered exempt from institutional ethics board review.
Results
Descriptive analyses
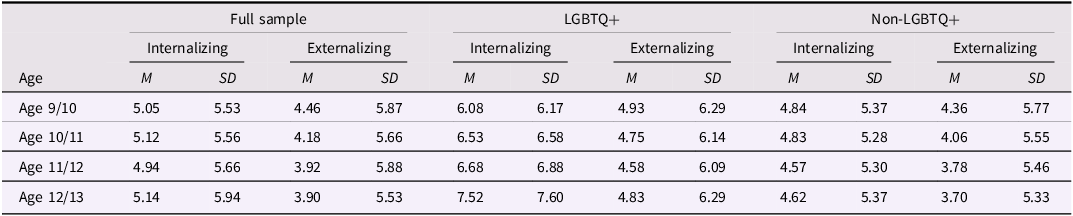
Descriptive statistics for sociodemographic characteristics in the full sample and for LGBTQ+ and non-LGBTQ+ youth are presented in Table 1. Comparisons across LGBTQ+ and non-LGBTQ+ youth indicated that there were significant differences in race (X 2[4] = 51.06, p < .001), and parent education (X 2[5] = 23.92, p < .001), but not in household income (X 2[8] = 8.86, p = .354) and Hispanic/Latino ethnicity (X 2[1] = 0.62, p = .430). Post-hoc analyses indicated that LGBTQ+ youth were significantly more likely to be multi-racial and less likely to be Black or Asian compared to their non-LGBTQ+ peers, and LGBTQ+ youth were more likely to come from families with higher levels of parental education. Descriptive information for the number of participants identifying as a sexual and/or gender minority are presented in Table 2. Descriptive statistics for internalizing and externalizing behaviors in the full sample and for LGBTQ+ and non-LGBTQ+ youth are presented in Table 3.
Descriptive statistics for internalizing and externalizing symptoms from ages 9/10 to 12/13
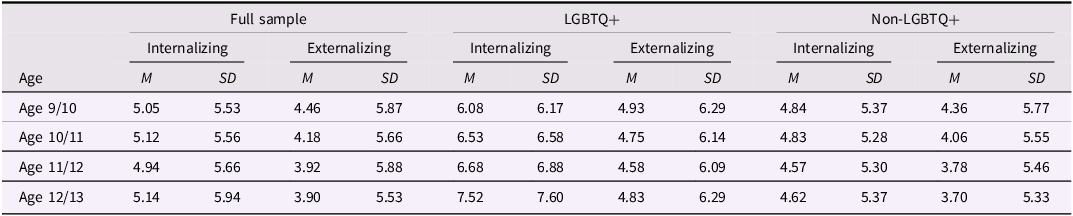
Table 3. Long description
A table comparing internalizing and externalizing symptoms across different age groups and demographics. The table has 4 rows and 12 columns. The columns are labeled as follows: Age, Full sample Internalizing M, Full sample Internalizing SD, Full sample Externalizing M, Full sample Externalizing SD, LGBTQ+ Internalizing M, LGBTQ+ Internalizing SD, LGBTQ+ Externalizing M, LGBTQ+ Externalizing SD, Non-LGBTQ+ Internalizing M, Non-LGBTQ+ Internalizing SD, Non-LGBTQ+ Externalizing M, Non-LGBTQ+ Externalizing SD. The rows are labeled with age groups: Age 9/10, Age 10/11, Age 11/12, Age 12/13. Each cell contains mean (M) and standard deviation (SD) values for internalizing and externalizing symptoms. Notable trends include variations in symptoms across different age groups and between LGBTQ+ and non-LGBTQ+ demographics.
Note. The score range for the CBCL internalizing raw score is 0–51. The score range for the CBCL externalizing raw score is 0–50.
Internalizing behaviors
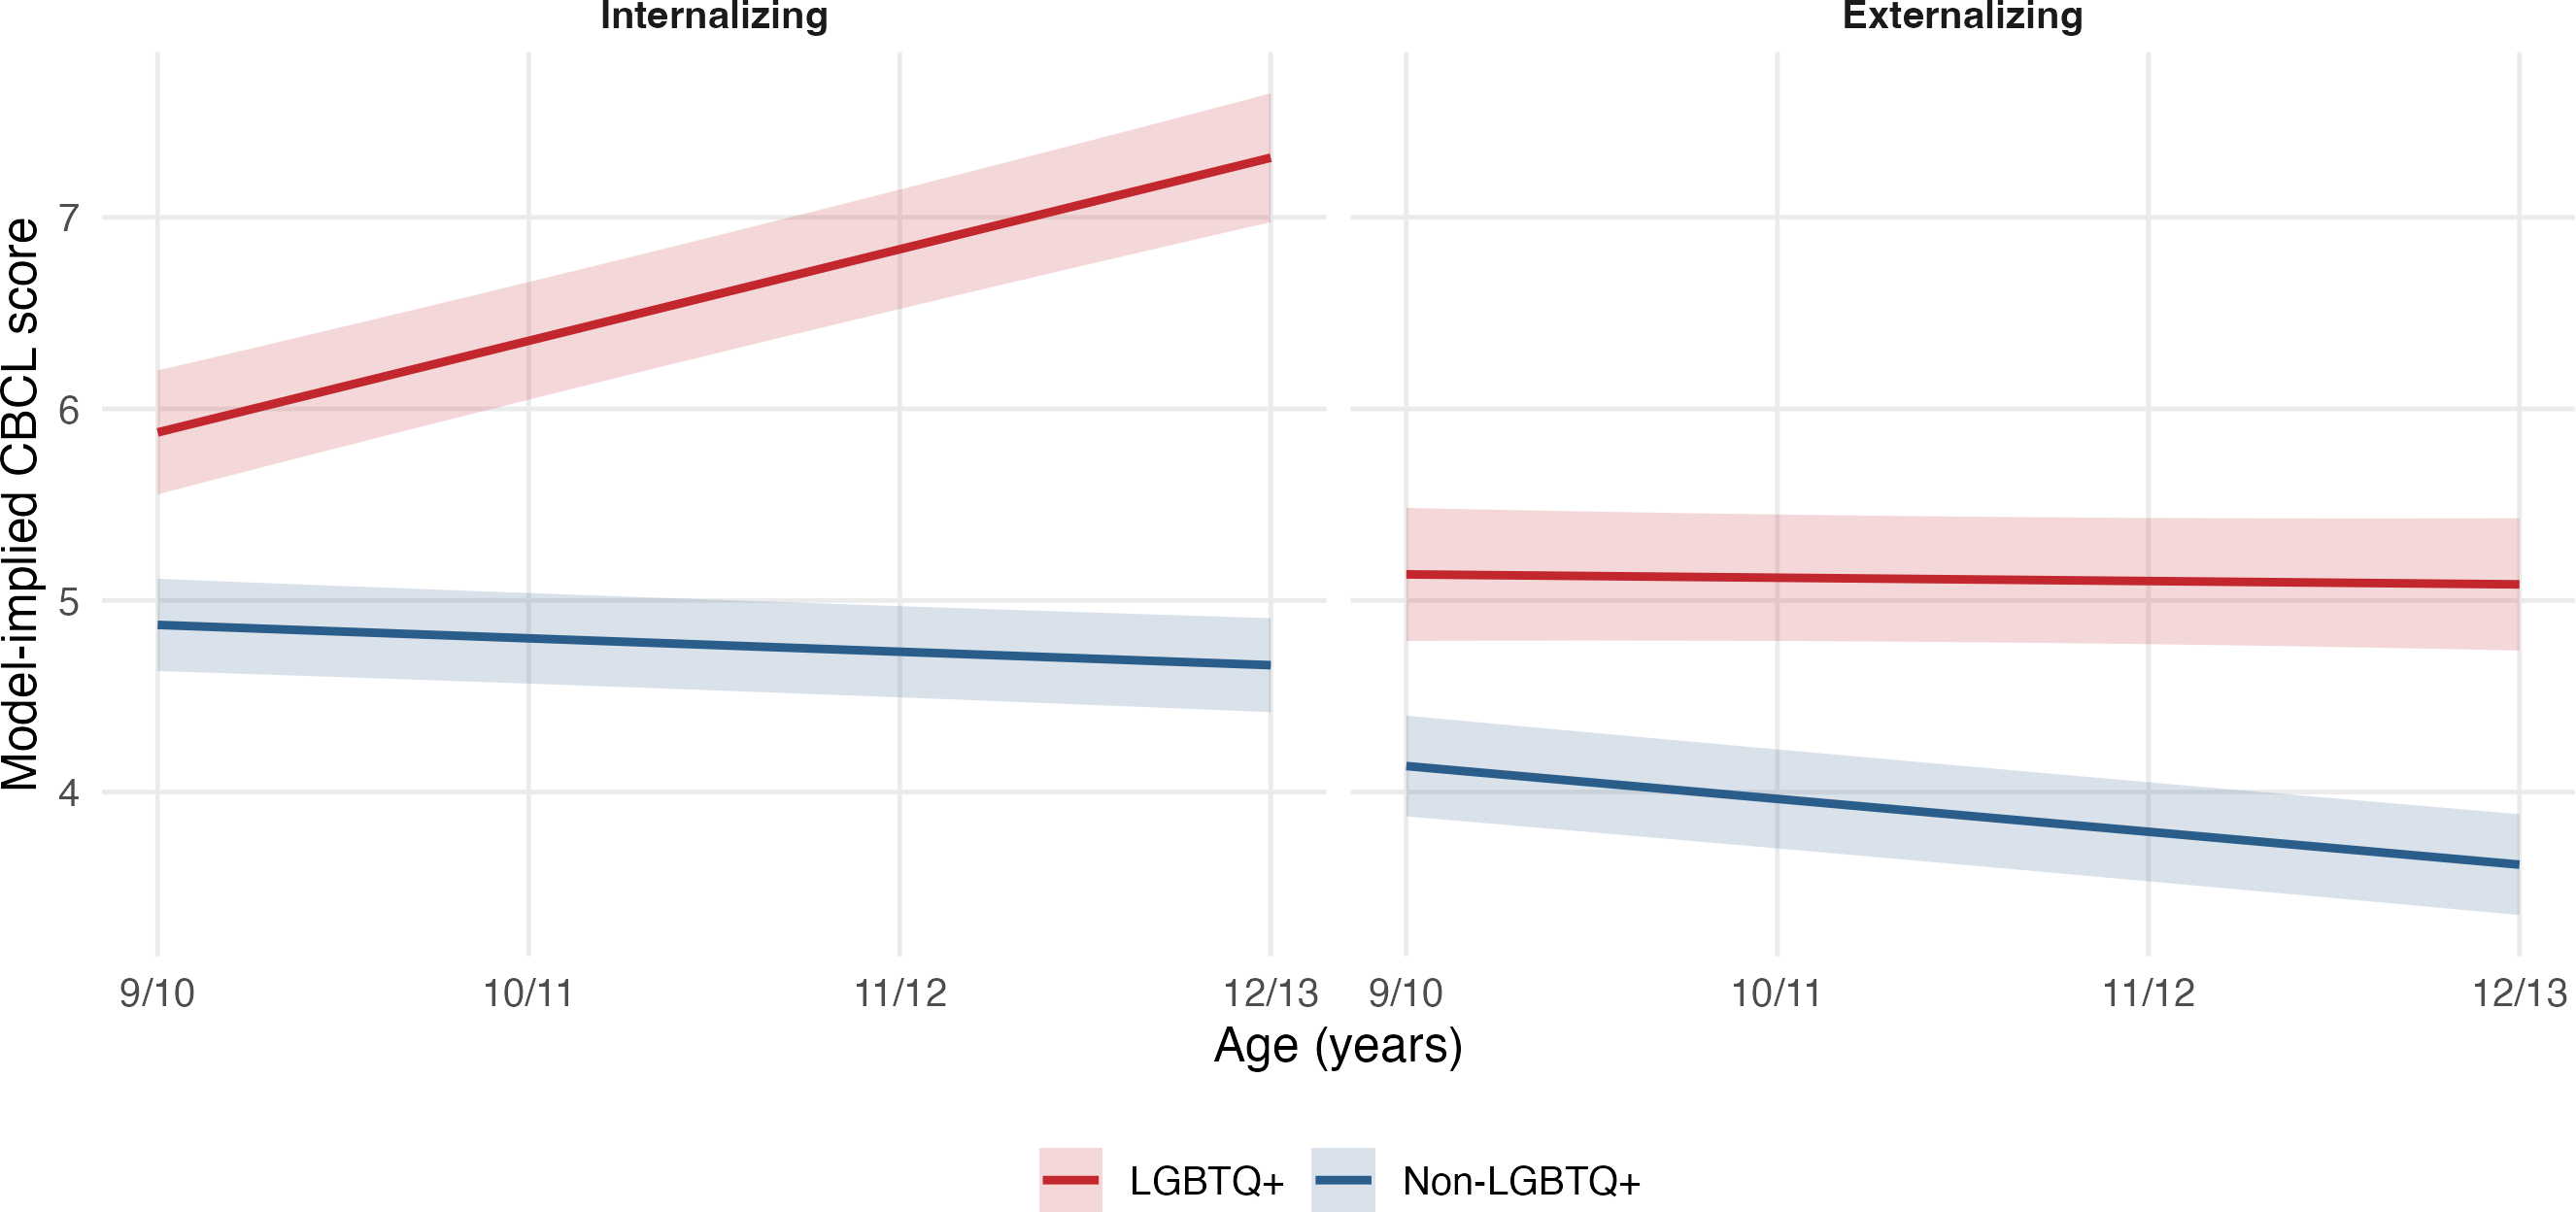
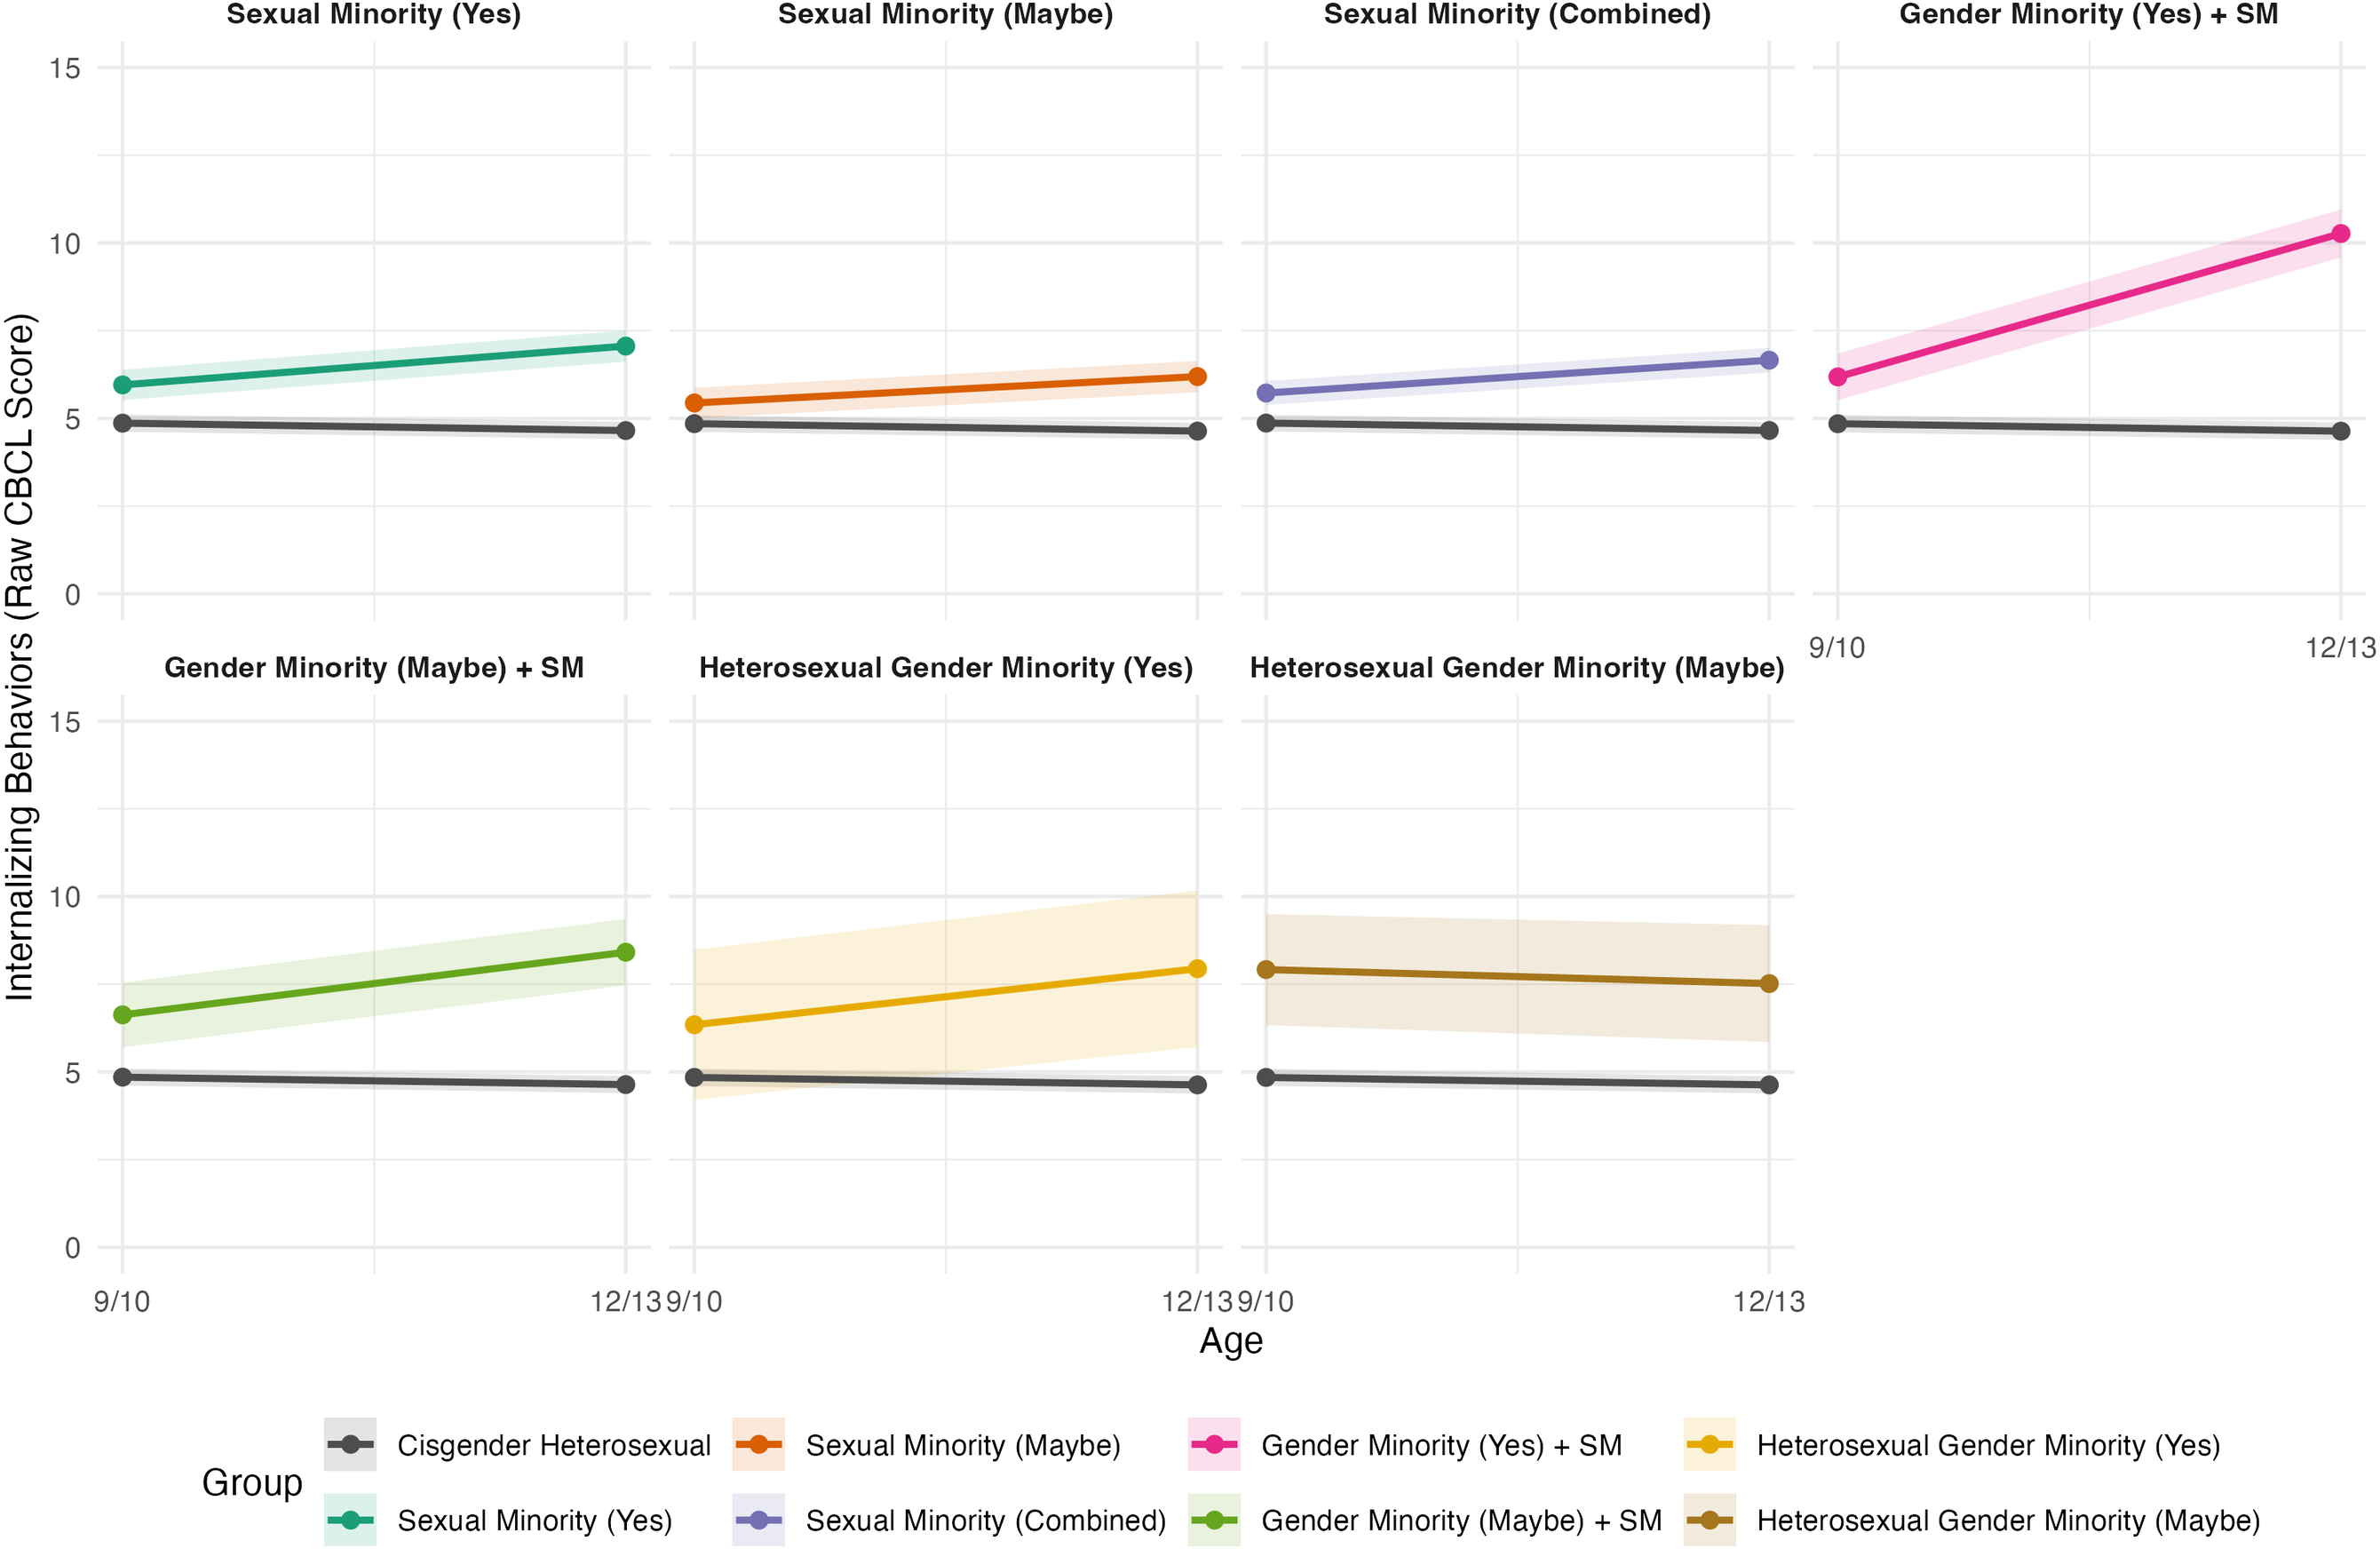
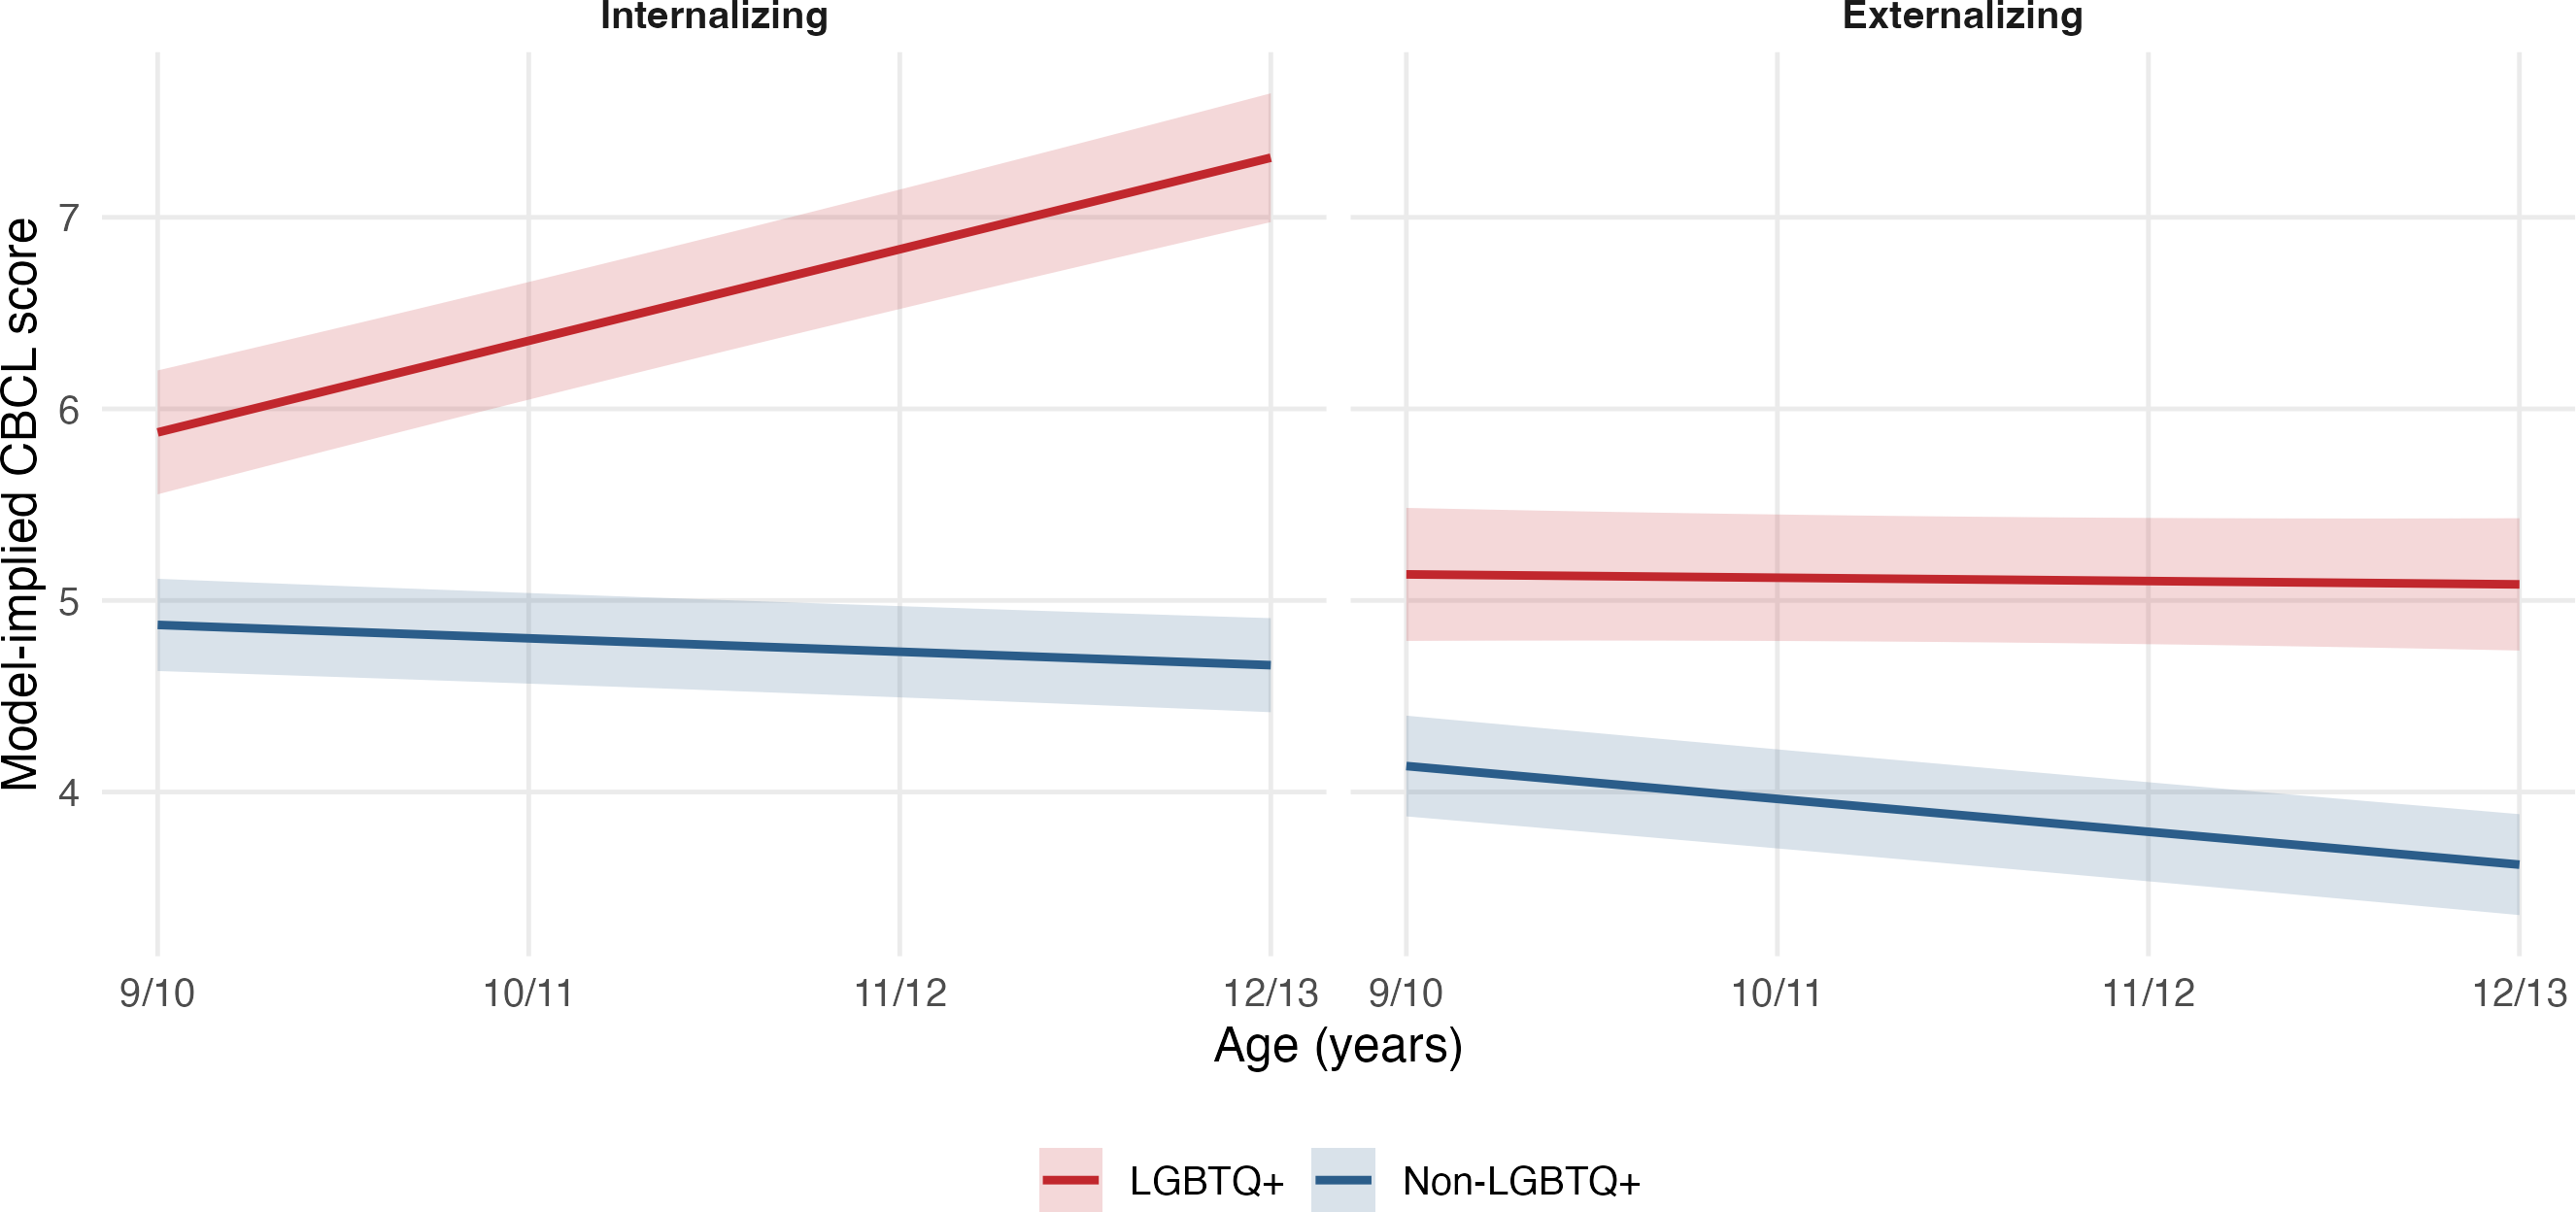
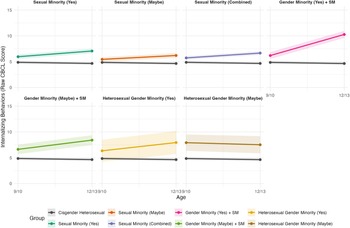
Tabulated linear mixed effects model results for internalizing behaviors are presented in Tables 4 and 5. Visual representations of internalizing trajectories are presented in Figures 1 and 2.
Lines are model-implied Child Behavior Checklist (CBCL) internalizing (left panel) and externalizing (right panel) scores from linear mixed-effects models, plotted separately for LGBTQ+ youth (red; top line on both graphs) and non-LGBTQ+ youth (blue; bottom line on both graphs) across four annual assessments in the Adolescent Brain Cognitive Development (ABCD) Study. Shaded bands are 95% confidence intervals.
Each panel displays model-implied trajectories of internalizing behaviors (raw CBCL score) from age 9/10 to age 12/13 for one sexual or gender minority subgroup (colored line; top line in all graphs) relative to the cisgender heterosexual reference group (gray line; bottom line in all graphs), with shaded bands representing 95% confidence intervals. Fitted values are derived from separate linear mixed-effects models for each subgroup, holding sex and SES composite at their sample means. Sexual Minority (Yes) is shown in teal; Sexual Minority (Maybe) in orange; Sexual Minority (Combined, Yes + Maybe) in purple; Gender Minority (Yes) with a co-occurring sexual minority identity in magenta; Gender Minority (Maybe) with a co-occurring sexual minority identity in green; Heterosexual Gender Minority (Yes) in gold; and Heterosexual Gender Minority (Maybe) in brown. The score range for the CBCL internalizing raw score is 0–51.
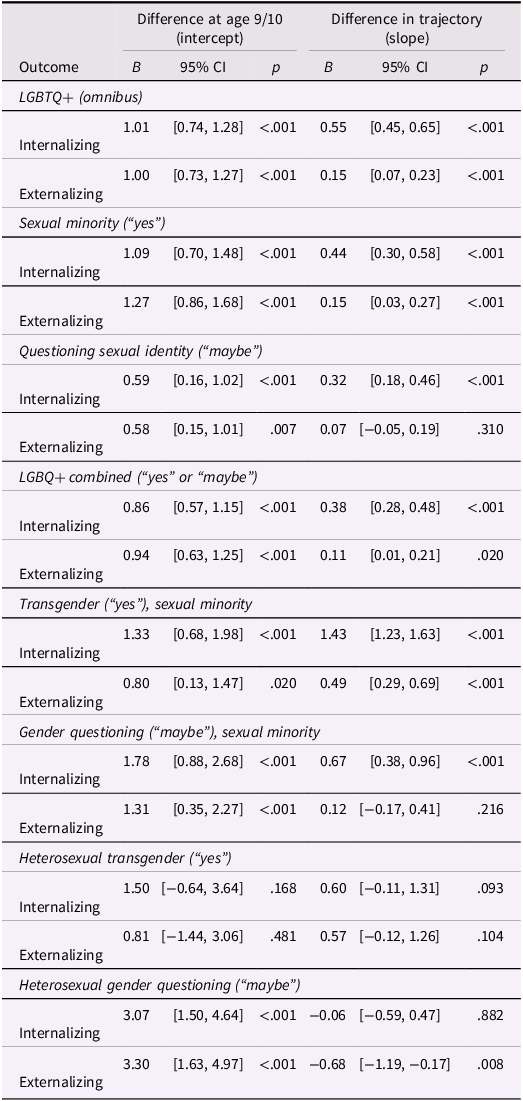
Unstandardized fixed effects from separate linear mixed-effects models of internalizing and externalizing trajectories by sexual and gender minority group
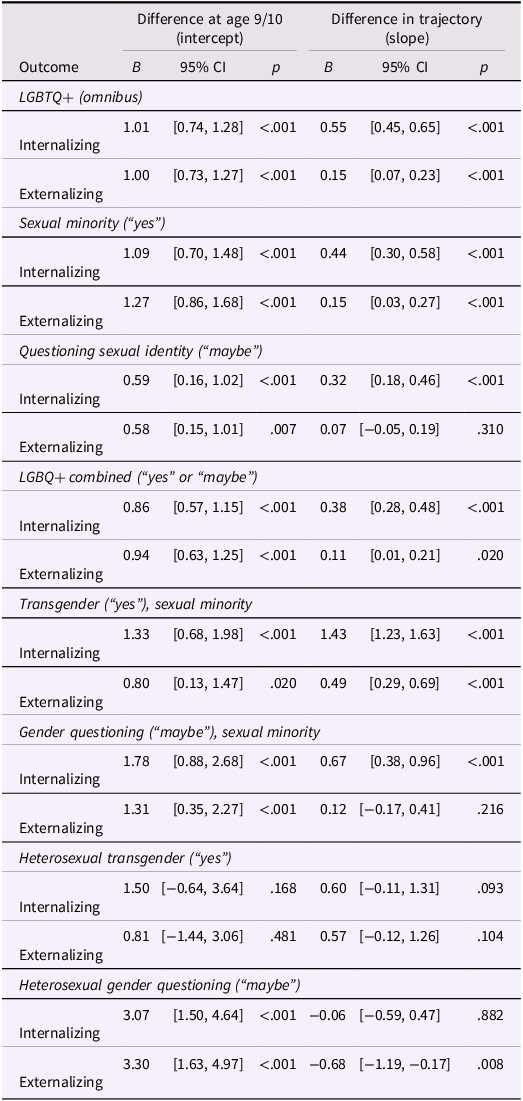
Table 4. Long description
The table presents unstandardized fixed effects from separate linear mixed-effects models of internalizing and externalizing trajectories by sexual and gender minority group. It has 10 rows and 8 columns. The columns are labeled Outcome, Difference at age 9/10 (intercept) B, Difference at age 9/10 (intercept) 95% CI, Difference at age 9/10 (intercept) p, Difference in trajectory (slope) B, Difference in trajectory (slope) 95% CI, and Difference in trajectory (slope) p. The rows are labeled with different groups such as LGBTQ+ (omnibus), Sexual minority (yes), Questioning sexual identity (maybe), LGBQ+ combined (yes or maybe), Transgender (yes), sexual minority, Gender questioning (maybe), sexual minority, Heterosexual transgender (yes), and Heterosexual gender questioning (maybe). Each row provides values for internalizing and externalizing behaviors.
Note. Each block reports the focal fixed effects from separate linear mixed-effects models in which the identified group was contrasted with cisgender heterosexual youth (the reference group). The eight models were estimated separately, not simultaneously, and the groups are not mutually exclusive (e.g., the omnibus LGBTQ+ group subsumes the sexual minority and transgender subgroups). Intercept terms reflect group differences in symptom levels at age 9/10; slope terms (group × age interactions) reflect group differences in rates of change from age 9/10 to age 12/13. All models included age (centered at baseline), sex assigned at birth, and the SES composite as covariates, with random intercepts for family and study site and participant-level random slopes. CI = confidence interval; LGBTQ+ = lesbian, gay, bisexual, transgender, queer, and beyond; LGBQ+ = lesbian, gay, bisexual, and questioning. B = unstandardized coefficient in raw Child Behavior Checklist score units.
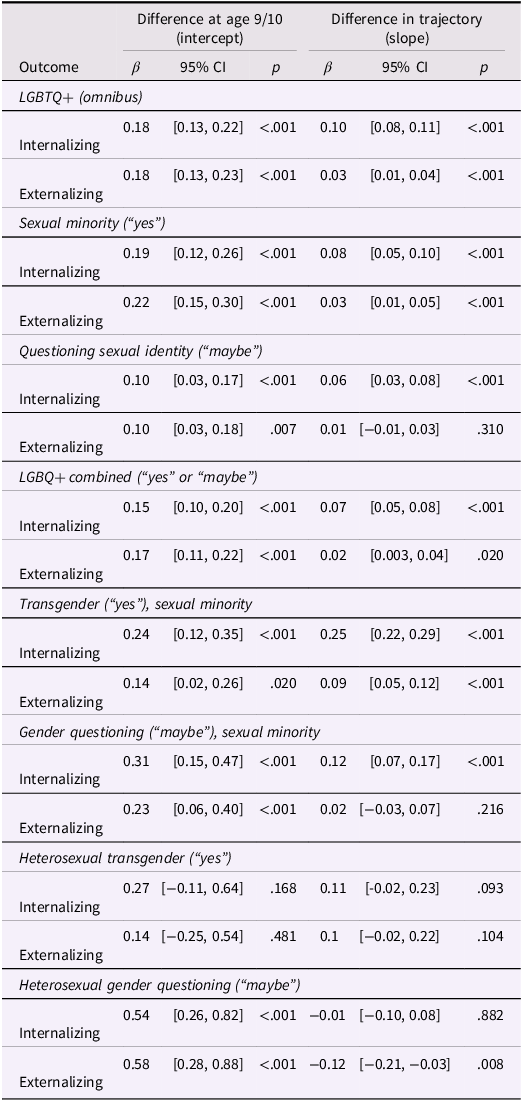
Standardized fixed effects from separate linear mixed-effects models of internalizing and externalizing trajectories by sexual and gender minority group
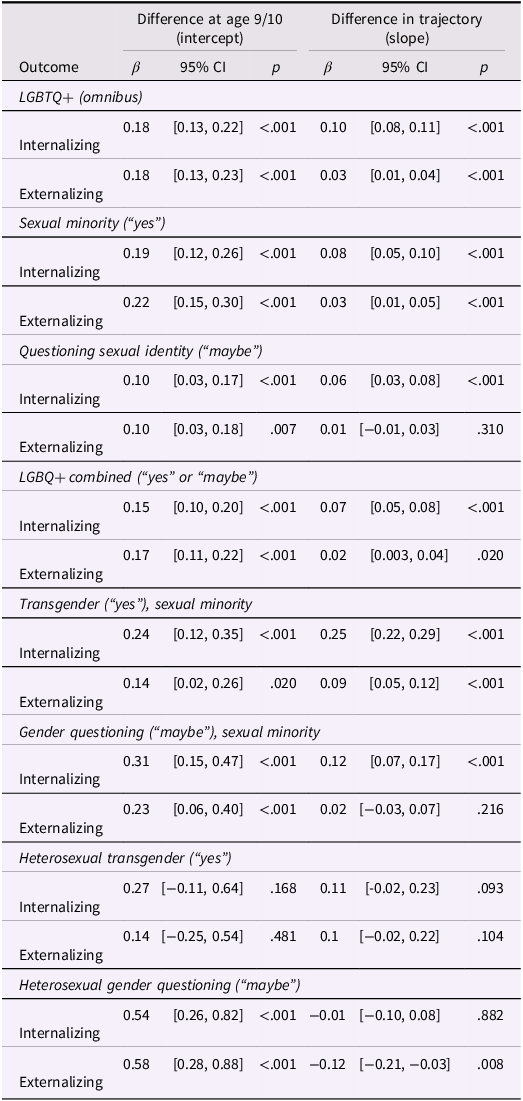
Table 5. Long description
The table presents standardized fixed effects from linear mixed-effects models of internalizing and externalizing trajectories by sexual and gender minority group. It has 10 rows and 8 columns. The columns are labeled Outcome, Difference at age 9/10 (intercept) β, Difference at age 9/10 (intercept) 95% CI, Difference at age 9/10 (intercept) p, Difference in trajectory (slope) β, Difference in trajectory (slope) 95% CI, and Difference in trajectory (slope) p. The rows are grouped by different minority categories such as LGBTQ+, Sexual minority, Questioning sexual identity, LGBQ+ combined, Transgender, Gender questioning, Heterosexual transgender, and Heterosexual gender questioning. Each row provides specific values for the intercept and slope differences along with their confidence intervals and p-values.
Note. Each block reports the focal fixed effects from separate linear mixed-effects models in which the identified group was contrasted with cisgender heterosexual youth (the reference group). The eight models were estimated separately, not simultaneously, and the groups are not mutually exclusive (e.g., the omnibus LGBTQ+ group subsumes the sexual minority and transgender subgroups). Intercept terms reflect group differences in symptom levels at age 9/10; slope terms (group × age interactions) reflect group differences in rates of change from age 9/10 to age 12/13. All models included age (centered at baseline), sex assigned at birth, and the SES composite as covariates, with random intercepts for family and study site and participant-level random slopes. CI = confidence interval; LGBTQ+ = lesbian, gay, bisexual, transgender, queer, and beyond; LGBQ+ = lesbian, gay, bisexual, and questioning. B = unstandardized coefficient in raw Child Behavior Checklist score units. β = standardized coefficient.
Overall LGBTQ+ trajectories
In the omnibus model comparing all LGBTQ+ youth to their cisgender, heterosexual peers, LGBTQ+ youth exhibited significantly higher internalizing behaviors at age 9/10 relative to their non-LGBTQ+ peers (B = 1.01, SE = 0.14, β = 0.18, 95% CI [0.13, 0.22], p < .001). Furthermore, the rate of change in internalizing behaviors from age 9/10 to 12/13 differed significantly between LGBTQ+ and non-LGBTQ+ youth, such that LGBTQ+ youth showed a significantly more rapid increase in internalizing behaviors over time (B = 0.55, SE = 0.05, β = 0.10, CI [0.08, 0.11], p < .001).
Sexual minority youth
Among cisgender youth who explicitly identified as a sexual minority (i.e., responded “yes” to the sexual minority item), sexual minority youth exhibited significantly higher internalizing behaviors at age 9/10 compared to cisgender heterosexual youth (B = 1.09, SE = 0.20, β = 0.19, CI [0.12, 0.26], p < .001), and showed a significantly more rapid increase in internalizing behaviors over time (B = 0.44, SE = 0.07, β = 0.08, CI [0.05, 0.10], p < .001).
Among cisgender youth who responded “maybe” to the sexual minority item (i.e., those questioning their sexual orientation), questioning youth exhibited significantly higher internalizing behaviors at age 9/10 relative to cisgender heterosexual peers (B = 0.59, SE = 0.22, β = 0.10, CI [0.03, 0.17], p < .001), and also showed a significantly more rapid increase in internalizing behaviors over time (B = 0.32, SE = 0.07, β = 0.06, CI [0.03, 0.08], p < .001), though effects were smaller in magnitude than those observed for youth who explicitly identified as a sexual minority. In the combined LGBQ+ model (encompassing youth who responded “yes” or “maybe” to the sexual minority item, consistent with prior ABCD publications), combined LGBQ+ youth showed significantly elevated internalizing behaviors at age 9/10 (B = 0.86, SE = 0.15, β = 0.15, CI [0.10, 0.20], p < .001) and a significantly more rapid increase in internalizing behaviors over time (B = 0.38, SE = 0.05, β = 0.07, CI [0.05, 0.08], p < .001).
Gender minority youth with a co-occurring sexual minority identity
Youth who identified as transgender (i.e., responded “yes” to the transgender item) who also identified as a sexual minority exhibited significantly higher internalizing behaviors at age 9/10 compared to cisgender heterosexual peers (B = 1.33, SE = 0.33, β = 0.24, CI [0.12, 0.35], p < .001). Notably, sexual minority transgender youth also showed the most rapid trajectory divergence of any group examined, with a significantly more rapid increase in internalizing behaviors over time (B = 1.43, SE = 0.10, β = 0.25, CI [0.22, 0.29], p < .001).
Sexual minority youth who responded “maybe” to the transgender item (i.e., those questioning their gender identity) exhibited significantly higher internalizing behaviors at age 9/10 (B = 1.78, SE = 0.46, β = 0.31, CI [0.15, 0.47], p < .001), the largest baseline elevation observed across all sexual minority comparisons, and showed a significantly more rapid increase in internalizing behaviors over time (B = 0.67, SE = 0.15, β = 0.12, CI [0.07, 0.17], p < .001).
Heterosexual gender minority youth
In models restricted to heterosexual gender minority youth (i.e., youth who identified as transgender or questioning their gender identity but did not identify as a sexual minority), a notably different pattern emerged. Among heterosexual youth who explicitly identified as transgender (i.e., answered “yes”), neither the baseline difference in internalizing behaviors (B = 1.50, SE = 1.09, β = 0.27, CI [−0.11, 0.64], p = .168) nor the difference in trajectory (B = 0.60, SE = 0.36, β = 0.11, CI [−0.02, 0.23], p = .093) reached statistical significance compared to cisgender heterosexual peers. Among heterosexual youth questioning their gender identity (i.e., answered “maybe”), internalizing behaviors at age 9/10 were significantly elevated relative to cisgender heterosexual peers (B = 3.07, SE = 0.80, β = 0.54, CI [0.26, 0.82], p < .001), the largest baseline difference of any group. Yet, the difference in trajectory was not significant (B = −0.06, SE = 0.27, β = −0.01, CI [−0.10, 0.08], p = .882), suggesting that while these youth already showed markedly elevated internalizing behaviors in late childhood, their rate of change across the follow-up period did not significantly differ from that of cisgender heterosexual peers. This may be due in part to a very small subsample size.
Externalizing behaviors
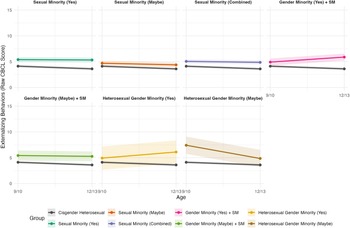
Tabulated linear mixed effects model results for externalizing behaviors are presented in Tables 4 and 5. Visual representations of externalizing trajectories are presented in Figures 1 and 3.
Each panel displays model-implied trajectories of externalizing behaviors (raw CBCL score) from age 9/10 to age 12/13 for one sexual or gender minority subgroup (colored line; top line in all graphs) relative to the cisgender heterosexual reference group (gray line; bottom line in all graphs), with shaded bands representing 95% confidence intervals. Fitted values are derived from separate linear mixed-effects models for each subgroup, holding sex and SES composite at their sample means. Sexual Minority (Yes) is shown in teal; Sexual Minority (Maybe) in orange; Sexual Minority (Combined, Yes + Maybe) in purple; Gender Minority (Yes) with a co-occurring sexual minority identity in magenta; Gender Minority (Maybe) with a co-occurring sexual minority identity in green; Heterosexual Gender Minority (Yes) in gold; and Heterosexual Gender Minority (Maybe) in brown. The score range for the CBCL externalizing raw score is 0–50.
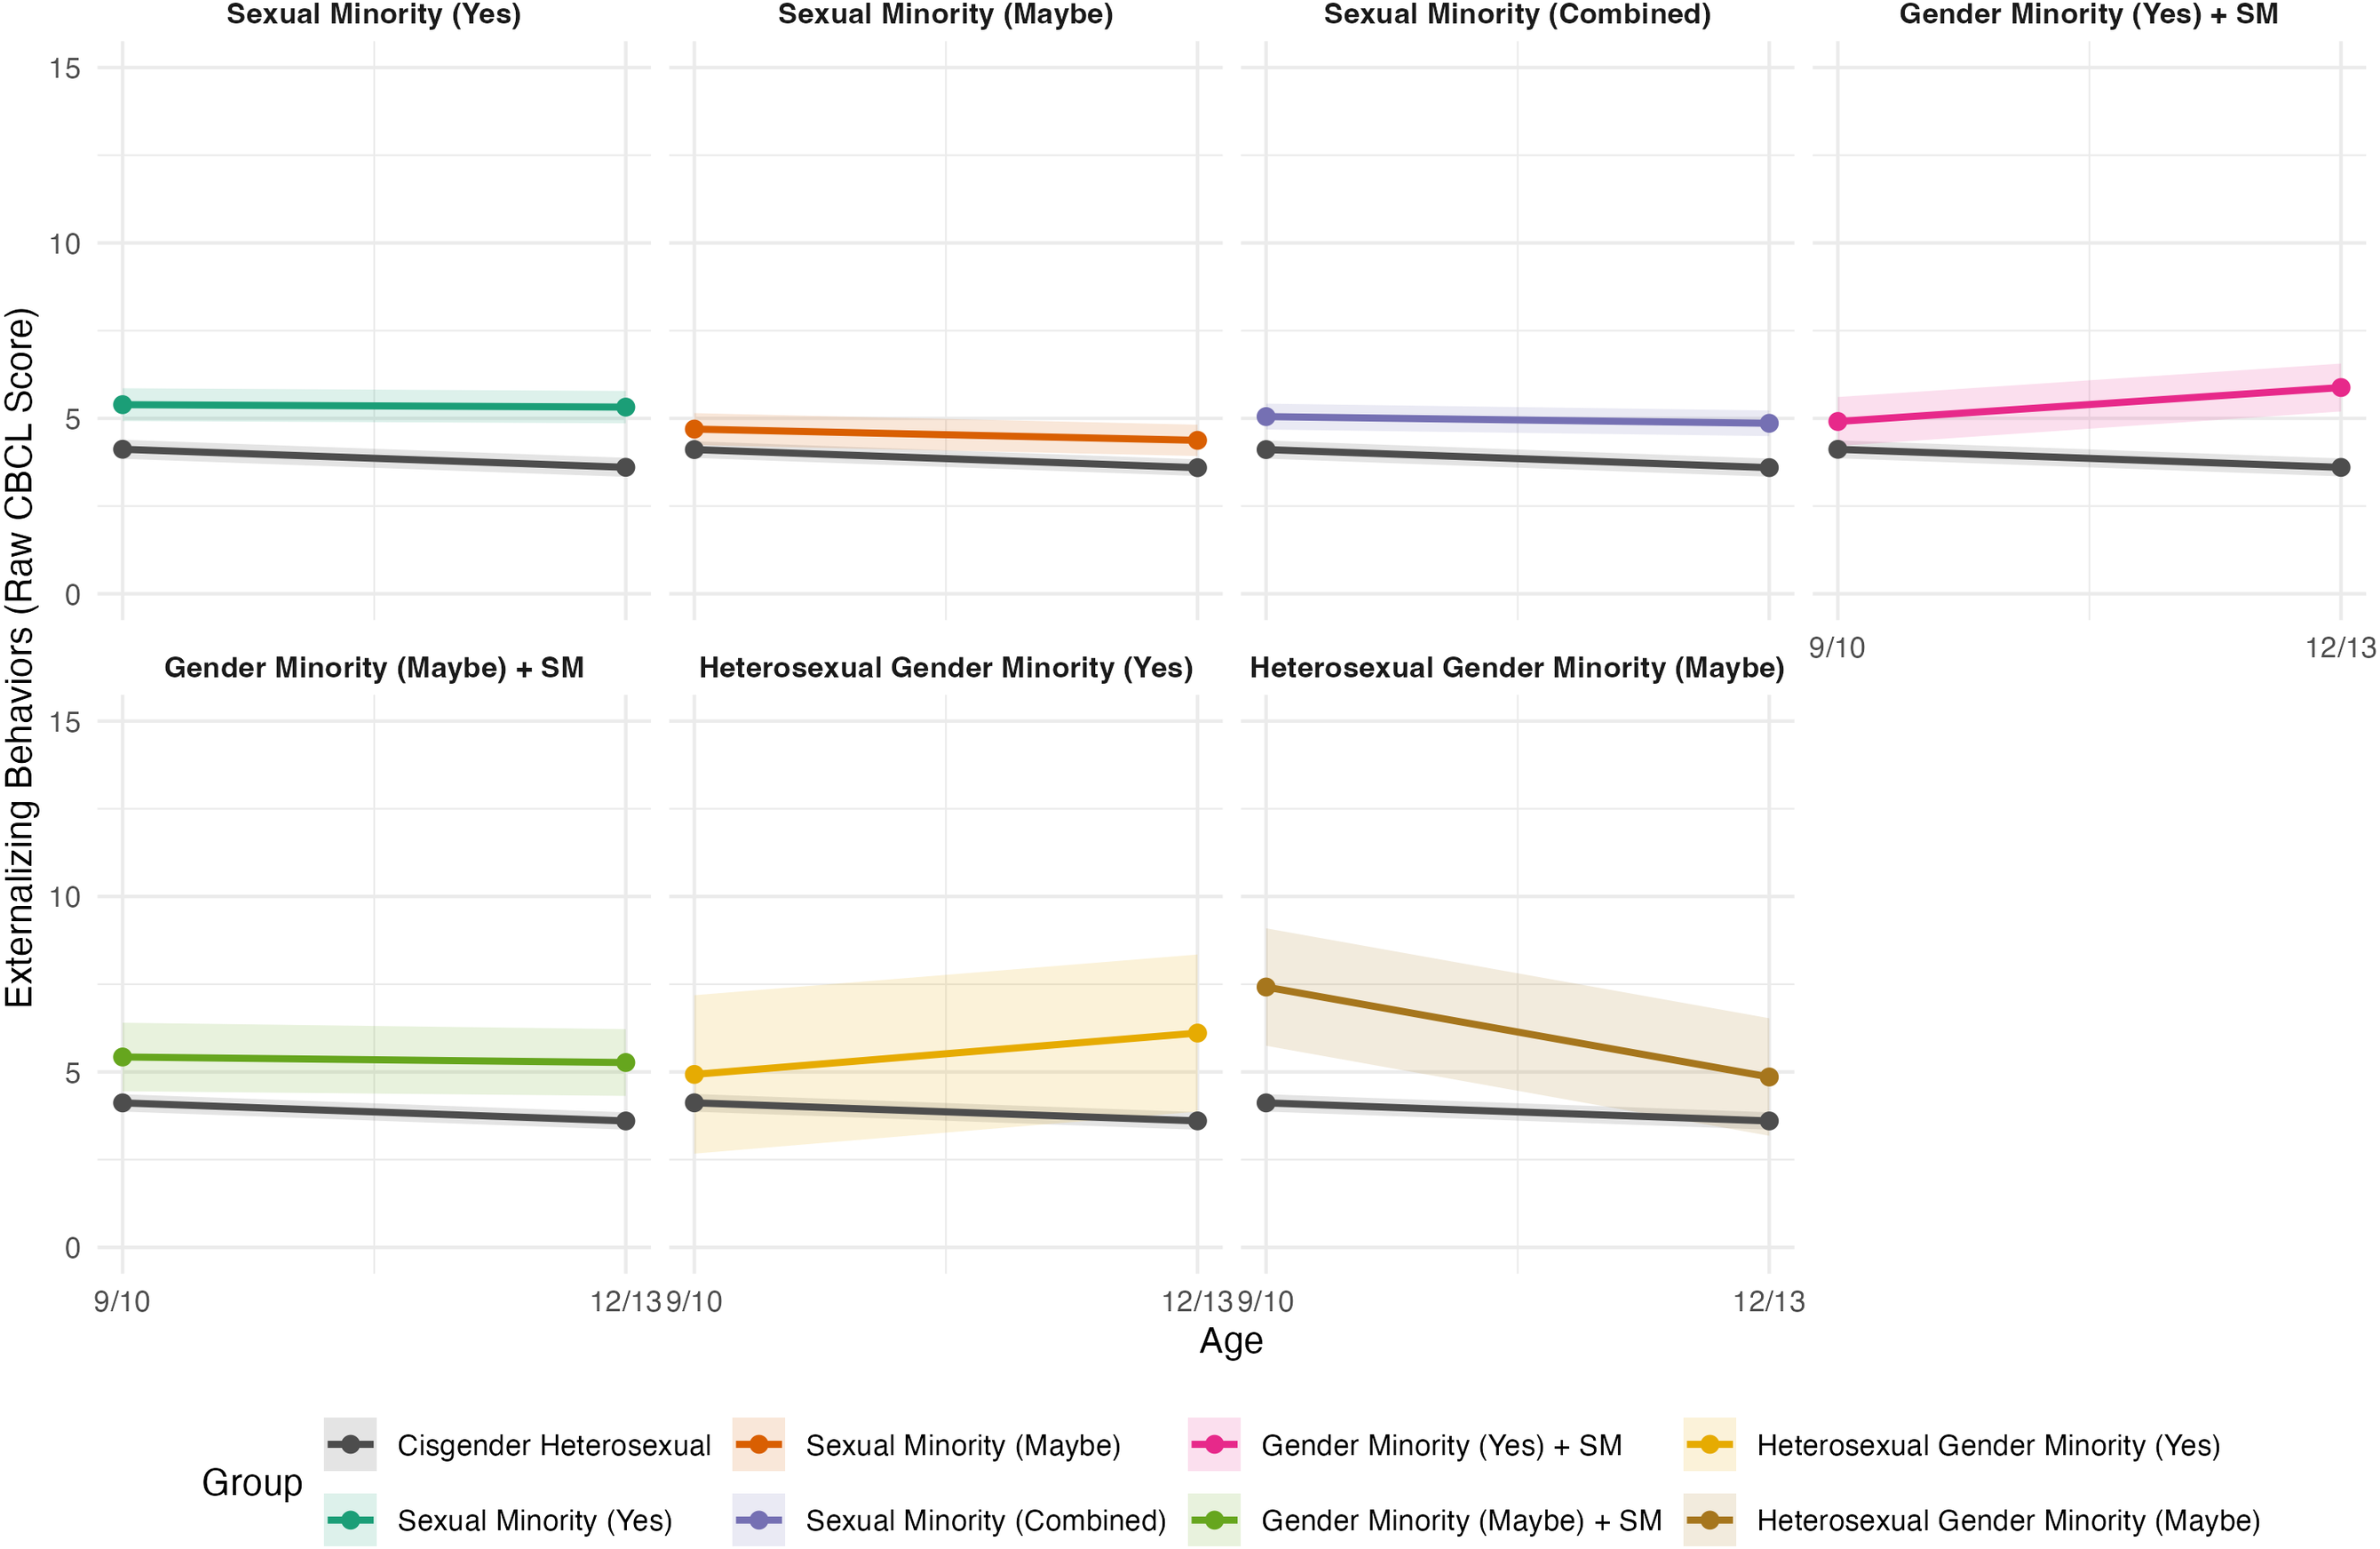
Figure 3. Long description
Panel A: The line graph shows externalizing behaviors for Sexual Minority (Yes) in teal, Sexual Minority (Maybe) in orange, and Sexual Minority (Combined) in purple, compared to the cisgender heterosexual reference group in gray. The x-axis represents age (9/10 to 12/13), and the y-axis represents externalizing behaviors (raw CBCL score). Panel B: The line graph shows externalizing behaviors for Gender Minority (Yes) + SM in magenta, Gender Minority (Maybe) + SM in green, Heterosexual Gender Minority (Yes) in gold, and Heterosexual Gender Minority (Maybe) in brown, compared to the cisgender heterosexual reference group in gray. The x-axis represents age (9/10 to 12/13), and the y-axis represents externalizing behaviors (raw CBCL score). Shaded bands represent 95% confidence intervals.
Overall LGBTQ+ trajectories
In the omnibus model comparing all LGBTQ+ youth to their cisgender, heterosexual peers, LGBTQ+ youth exhibited significantly higher externalizing behaviors at age 9/10 relative to non-LGBTQ+ peers (B = 1.00, SE = 0.14, β = 0.18, CI [0.13, 0.23], p < .001). LGBTQ+ youth also showed a significantly more rapid increase in externalizing behaviors over time (B = 0.15, SE = 0.04, β = 0.03, CI [0.01, 0.04], p < .001), though the magnitude of this trajectory divergence was considerably smaller than that observed for internalizing behaviors (β = 0.10).
Sexual minority youth
Among cisgender youth who explicitly identified as a sexual minority (i.e., answered “yes”), sexual minority youth exhibited significantly higher externalizing behaviors at age 9/10 compared to cisgender heterosexual peers (B = 1.27, SE = 0.21, β = 0.22, CI [0.15, 0.30], p < .001), and showed a significantly more rapid increase in externalizing behaviors over time (B = 0.15, SE = 0.06, β = 0.03, CI [0.01, 0.05], p < .001). While the baseline elevation was comparable in magnitude to that observed for internalizing behaviors (β = 0.19), the trajectory divergence was slightly attenuated for externalizing (β = 0.03 vs. β = 0.08 for internalizing).
Among cisgender youth who were questioning their sexual identity (i.e., answered “maybe”), questioning youth exhibited significantly higher externalizing behaviors at age 9/10 relative to cisgender heterosexual peers (B = 0.58, SE = 0.22, β = 0.10, CI [0.03, 0.18], p = .007); however, the difference in externalizing trajectories over time was not significant (B = 0.07, SE = 0.06, β = 0.01, CI [−0.01, 0.03], p = .310). This pattern contrasts with findings for internalizing behaviors, where questioning youth showed a significant, albeit modest, trajectory divergence (β = 0.06, p < .001). In the combined LGBQ+ model, youth who responded “yes” or “maybe” to the sexual minority item showed significantly elevated externalizing behaviors at age 9/10 (B = 0.94, SE = 0.16, β = 0.17, CI [0.11, 0.22], p < .001) and a significantly more rapid increase in externalizing behaviors over time (B = 0.11, SE = 0.05, β = 0.02, CI [0.003, 0.04], p = .02).
Gender minority youth with a co-occurring sexual minority identity
Youth who identified as transgender who also identified as a sexual minority exhibited significantly higher externalizing behaviors at age 9/10 compared to cisgender heterosexual peers (B = 0.80, SE = 0.34, β = 0.14, CI [0.02, 0.26], p = .020), and showed a significantly more rapid increase in externalizing behaviors over time (B = 0.49, SE = 0.10, β = 0.09, CI [0.05, 0.12], p < .001). Notably, while the baseline elevation for this group was smaller than observed for internalizing behaviors (β = 0.14 vs. β = 0.24), these youth showed a significantly more rapid increase over time in both domains (β = 0.09 externalizing vs. β = 0.25 internalizing), suggesting a somewhat domain-general pattern of increasing behaviors over time among multiple-identity youth.
Among youth who responded “maybe” to the transgender item and who had sexual minority identity, gender-questioning sexual minority youth exhibited significantly higher externalizing behaviors at age 9/10 (B = 1.31, SE = 0.49, β = 0.23, CI [0.06, 0.40], p < .001); however, the difference in externalizing trajectories over time was not significant (B = 0.12, SE = 0.15, β = 0.02, CI [−0.03, 0.07], p = .216). Unlike internalizing behaviors, this group showed a large baseline elevation without significant trajectory divergence, and the baseline effect was notably smaller for externalizing than internalizing (β = 0.23 vs. β = 0.31).
Heterosexual gender minority youth
In models restricted to heterosexual gender minority youth, results differed markedly from models that included youth with co-occurring sexual minority identities. Among heterosexual youth who identified as transgender, neither the baseline difference in externalizing behaviors (B = 0.81, SE = 1.15, β = 0.14, CI [-0.25, 0.54], p = .481) nor the difference in trajectory (B = 0.57, SE = 0.35, β = 0.10, CI [−0.02, 0.22], p = .104) reached statistical significance, consistent with the null findings observed for this group in the internalizing models. Among heterosexual youth questioning their gender identity, a distinctive pattern emerged: externalizing behaviors at age 9/10 were elevated relative to cisgender heterosexual peers (B = 3.30, SE = 0.85, β = 0.58, CI [0.28, 0.88], p < .001), the largest baseline difference observed across all groups for both internalizing and externalizing behaviors. In contrast to all other groups, however, the trajectory was significantly more negative than that of cisgender heterosexual peers (B = −0.68, SE = 0.26, β = −0.12, CI [−0.21, −0.03], p = .008), indicating that externalizing behaviors in heterosexual gender-questioning youth declined more steeply over time, converging towards cisgender heterosexual peers over time. This pattern of elevated but converging externalizing behaviors stands in notable contrast to the internalizing profile for this group, where baseline elevation was similarly large (β = 0.54) but trajectories neither diverged nor converged (β = −0.01, p = .882).
Discussion
A substantial body of research has documented elevated mental health concerns among sexual and gender minority youth, alongside growing attention to the developmental course of these disparities (Birkett et al., Reference Birkett, Newcomb and Mustanski2015; Bista et al., Reference Bista, Werner-Seidler, Maston, Lin, Perry, Davies, Graham, Christensen, Marino and Skinner2025b; Gower et al., Reference Gower, Rider, Brown and Eisenberg2022; Irish et al., Reference Irish, Solmi, Mars, King, Lewis, Pearson, Pitman, Rowe, Srinivasan and Lewis2019; Jones et al., Reference Jones, Robinson, Oginni, Rahman and Rimes2017; Marshal et al., Reference Marshal, Dietz, Friedman, Stall, Smith, McGinley, Thoma, Murray, D’Augelli and Brent2011; Martin-Storey et al., Reference Martin-Storey, Lemelin, Temcheff and Dery2020). What has remained less well understood is how early these disparities emerge and whether they are observed for both internalizing and externalizing behaviors. Using four annual waves of data from the large, nationally representative ABCD Study, we examined developmental trajectories of internalizing and externalizing behaviors from late childhood (age 9/10) into early adolescence (age 12/13), disaggregating youth by sexual minority status, gender minority status, and their co-occurrence. In the overall group comparison, LGBTQ+ youth showed higher internalizing and externalizing behaviors at age 9/10 and more rapid increases over time than non-LGBTQ+ peers, consistent with our preregistered hypotheses. Decomposing this overall grouping, however, made clear that the omnibus trajectory was not representative of any single sexual or gender identity subgroup and was instead disproportionately shaped by a small number of youths holding multiple minoritized identities.
Sexual minority youth
Among cisgender youth, those who explicitly identified as a sexual minority showed the most consistent and interpretable disparities. They exhibited elevated internalizing (β = 0.19) and externalizing (β = 0.22) behaviors already at age 9/10 (baseline) and a diverging internalizing gap over the follow-up period (β = 0.08), with a smaller but significant widening in externalizing (β = 0.03). Youth who were questioning their sexual orientation (i.e., responded “maybe”) showed a parallel but attenuated pattern: significant yet smaller baseline elevations on both outcomes (internalizing and externalizing β = 0.10), a significant but modest internalizing divergence (β = 0.06), and, notably, no significant divergence in externalizing behaviors over time (β = 0.01, p = .310). This pattern is consistent with prior methodological work using nationally representative datasets, including in the YRBS, distinguishing youth who identify as lesbian, gay, or bisexual from those who are unsure or questioning (Baiden et al., Reference Baiden, LaBrenz, Asiedua-Baiden and Muehlenkamp2020; Gaylor et al., Reference Gaylor, Krause, Welder, Cooper, Ashley, Mack, Crosby, Trinh, Ivey-Stephenson and Whittle2023; Pollitt & Mallory, Reference Pollitt and Mallory2021). At the same time, the presence of significant disparities even among questioning youth indicates that uncertainty about one’s sexual identity in late childhood is itself associated with measurable mental health risk, rather than marking a “lower-risk” intermediate category. That these disparities were already evident at age 9/10 underscores that the developmental window for prevention and early intervention opens well before adolescence.
Gender minority and multiply-minoritized youth
The clearest departure from the overall group pattern emerged when gender minority identity was considered. Because most gender minority youth in the sample also identified as a sexual minority, we first examined youth holding both identities. These youth showed the most rapid internalizing divergence of any group in the study (β = 0.25), more than three timesFootnote 1 the divergence observed for cisgender sexual minority youth (β = 0.08), alongside elevated baseline internalizing (β = 0.24) and a significant increase in externalizing behaviors as well (β = 0.09), one of the few groups to diverge meaningfully in both domains. Youth questioning their gender identity who also held a sexual minority identity likewise showed the largest baseline internalizing elevation of any sexual minority comparison (β = 0.31). In other words, the comparatively small subgroup of youth carrying both a sexual and a gender minority identity accounted for a disproportionate share of the trajectory divergence captured by the omnibus LGBTQ+ slope. Substantively, this pattern is consistent with an intersectional account of minority stress (Brooks, Reference Brooks1981; Frost & Meyer, Reference Frost and Meyer2023; Gower et al., Reference Gower, Rider, Brown and Eisenberg2022; Rivas-Koehl et al., Reference Rivas-Koehl, Rivas-Koehl and McNeil Smith2023), in which youth navigating multiple stigmatized identities encounter compounding stressors that accumulate across development.
A distinct and more complex picture emerged for gender minority youth who did not also identify as a sexual minority. Heterosexual youth who explicitly identified as transgender did not differ significantly from cisgender heterosexual peers on either outcome at baseline or in trajectory. Given the very small size of this subgroup, these null findings may be best interpreted as reflecting limited statistical power rather than an absence of disparity. By contrast, heterosexual youth questioning their gender identity showed the largest baseline elevations of any group in the entire study, on both internalizing (β = 0.54) and externalizing (β = 0.58) behaviors, indicating pronounced distress already present in late childhood. Yet their trajectories did not diverge over time: internalizing behaviors remained elevated but parallel to those of peers (β = −0.01, p =.882), while externalizing behaviors significantly converged toward those of cisgender heterosexual peers across the follow-up period (β = −0.12, p = .008).
The gender minority trajectory findings warrant caution given the small subsample, but several non-mutually exclusive interpretations merit consideration in future work. First, gender identity in late childhood is developmentally fluid, and some youth who endorsed “maybe” at age 9/10 may have resolved this questioning in ways associated with declining behavioral dysregulation, particularly in the more externally observable, parent-rated externalizing domain. Second, because outcomes were parent-reported, shifts in parental perception or in the youth’s outward presentation could contribute to apparent convergence even where internal distress persists – a possibility underscored by the divergent internalizing and externalizing patterns within this same group. Third, regression to the mean and instability of estimates in small samples cannot be excluded. We therefore present these results as hypothesis-generating rather than definitive, and as a clear signal that gender-questioning youth in late childhood represent an understudied group whose early distress merits dedicated attention.
Internalizing and externalizing trajectories
Across groups, a consistent domain asymmetry emerged: internalizing trajectories diverged more reliably and more rapidly than externalizing trajectories. For most groups, externalizing disparities reflected elevations at age 9/10 rather than a more rapid divergence over time; the exception was the multiply-minoritized transgender sexual minority group, which worsened in both domains. This asymmetry coheres with minority stress theory and supports the small body of predominantly cross-sectional literature that finds associations between minority stressors (e.g., homophobic discrimination and peer victimization) and antagonistic externalizing (Brooks, Reference Brooks1981; Frost & Meyer, Reference Frost and Meyer2023; Meyer, Reference Meyer2003; Morgan et al., Reference Morgan, Martin-Storey, Lapalme, Déry and Temcheff2025; Ocasio et al., Reference Ocasio, Tapia, Lozano, Carrico and Prado2022; Poteat et al., Reference Poteat, Scheer and Chong2016). Notably, the externalizing scale examined here captures the antagonistic dimension of externalizing rather than substance use, and the mechanisms linking minority stress to rule-breaking and aggressive behavior specifically are less well understood and constitute an important direction for future research, although emerging literature suggests that, similar to internalizing, emotional regulation processes are salient (Barnett et al., Reference Barnett, Houck, Barker and Rizzo2022; Rocheleau et al., Reference Rocheleau, Rocheleau, Piatak and Thompson2024).
Minority stress, structural stigma, and the policy context
Minority stress theory (Brooks, Reference Brooks1981; Frost & Meyer, Reference Frost and Meyer2023; Meyer, Reference Meyer2003) provides the most plausible interpretive framework for these disparities, though we did not test mechanism directly in the present study. A growing literature indicates that external and structural stressors, such as victimization, discrimination, and stigma, tend to exert stronger effects on the mental health of sexual and gender minority youth than internalized identity processes, and that social support, including parental support in earlier years and peer and romantic support later in development, can buffer these effects (Barnett et al., Reference Barnett, Houck, Barker and Rizzo2022; Leung et al., Reference Leung, Kassel-Gomez, Sullivan, Murahara and Flanagan2022; McCurdy & Russell, Reference McCurdy and Russell2023; McDonald, Reference McDonald2018; Morgan et al., Reference Morgan, Martin-Storey, Lapalme, Déry and Temcheff2025; Parmar et al., Reference Parmar, Tabler, Okumura and Nagata2022; Poteat et al., Reference Poteat, Scheer and Chong2016; Rocheleau et al., Reference Rocheleau, Rocheleau, Piatak and Thompson2024). Our observation that the youth most exposed to stigma on multiple fronts (those holding both a sexual and a gender minority identity) showed the most rapid increase is consistent with this externally driven account of risk.
These trajectories also unfolded against a shifting structural backdrop that warrants explicit consideration. Prior work has commented on the structural impact of state-level policy on LGBTQ+ youth (Fish, Reference Fish2020; Hatzenbuehler, Reference Hatzenbuehler2016, Reference Hatzenbuehler2017). ABCD Study enrollment began in 2016, and the assessments analyzed here span a period during which state-level movements against LGBTQ+ identities were increasingly visible in public discourse. This period began with the wave of “bathroom bills” introduced and widely reported in the media in 2015 and 2016, most prominently North Carolina’s HB2 (Mallory & Sears, Reference Mallory and Sears2016), and escalated into a broader and increasingly youth-focused surge of state legislation targeting transgender young people in the early 2020s, continuing today (Trans Legislation Tracker, 2026). Because the later follow-up waves, during which gender minority youth showed the most rapidly increasing trajectories, coincided with this intensifying climate, structural stigma operating at the level of state policy represents a plausible contextual contributor to the disparities we observed, and one considerably more specific than the general experience of minority stress. We advance this as contextualization rather than as a tested effect; the present analyses did not model state of residence or policy exposure. The ABCD Study’s geographic breadth nonetheless offers a valuable opportunity for future work to test directly whether trajectories of internalizing and externalizing behavior differ for youth residing in states with more versus less restrictive policy environments, and whether gender minority youth are differentially affected, as the present pattern of results would predict.
Strengths and limitations
This study has several strengths, as well as important limitations that should guide future research. A central strength is the disaggregated subgroup analytic approach, which allowed us to separate sexual from gender minority youth, identification from questioning, and single-from multiple-identity youth, revealing heterogeneity that prior overall LGBTQ+ group-level analyses could not. We coded identity status using youth reports of their sexual and gender identity at each assessment wave in Data Release 5.1.Footnote 2 A sizeable portion of youth responded “I do not understand what you are asking me” to the sexuality and gender identity items (n = 4,692 at age 9/10; n = 2,054 at age 10/11; n = 388 at age 11/12), prompting us to code youth as a sexual or gender minority if they endorsed the relevant item at any assessment, given that younger youth may not yet have had the language to identify. It is likely that additional youth will identify as sexual or gender minorities at older ages. We also acknowledge that treating identity status as time-invariant in growth models does not capture the nuanced ways in which identities may shift and evolve over time, and that some youth may be miscategorized under this approach. This is a particularly salient consideration in light of the distinctive, non-diverging trajectories observed among gender-questioning youth.
Several limitations bear specifically on the subgroup findings. First, although the ABCD Study includes a relatively large LGBTQ+ subsample overall, the gender minority subgroups (especially heterosexual gender minority youth) were very small, limiting statistical power and the stability of trajectory estimates for those groups. The transgender-specific findings should accordingly be regarded as preliminary and hypothesis-generating, intended to inform future work. Relatedly, we were unable to disaggregate sexual minority youth by specific identity (e.g., gay/lesbian vs. bisexual/pansexual). This is a meaningful limitation given evidence that plurisexual and questioning youth, particularly bisexual youth, show larger mental health disparities than monosexual gay/lesbian youth (Chai, Reference Chai2024; Gnan et al., Reference Gnan, Rahman, Ussher, Baker, West and Rimes2019; Ross et al., Reference Ross, Salway, Tarasoff, MacKay, Hawkins and Fehr2018; Shearer et al., Reference Shearer, Herres, Kodish, Squitieri, James, Russon, Atte and Diamond2016), with more limited evidence available for pansexual (Borgogna et al., Reference Borgogna, McDermott, Aita and Kridel2019; Nath et al., Reference Nath, Matthews, DeChants, Hobaica, Clark, Taylor and Muñoz2024) and asexual (Xu et al., Reference Xu, Ma and Rahman2023) youth specifically.
In addition, although the precision afforded by the large sample yielded effect sizes with small standard errors, the magnitude of many effects was modest. Nonetheless, even small effects can translate into clinically meaningful difficulties in daily life. Also, the largest effects we observed among multiply-minoritized and gender-questioning youth were far from small, with standardized baseline elevations as large as β = 0.54–.58 and a trajectory divergence of β = 0.25. Finally, internalizing and externalizing behaviors were assessed via parent report; later ABCD assessments (beginning at youth age 15/16) incorporate youth self-report, and future releases extending through age 19/20 will permit examination of these trajectories into later adolescence, a period of heightened mental health risk for many youth (Bista et al., Reference Bista, Tait, Straker, Lin, Steinbeck, Graham, Kang, Lymer, Robinson, Marino and Skinner2025a; Nivard et al., Reference Nivard, Lubke, Dolan, Evans, St. Pourcain, Munafò and Middeldorp2017).
Despite these limitations, this study advances the literature in showing not only that mental health disparities between LGBTQ+ and non-LGBTQ+ youth emerge by late childhood and persist into early adolescence, but that these disparities are heterogeneous across LGBTQ+ subgroups. Disparities were most acute, and worsened most rapidly, among youth holding multiple minoritized identities, while gender-questioning youth presented a distinctive profile of high early distress without trajectory divergence. These findings argue for early, identity-specific support rather than a one-size-fits-all approach, and for further research into the structural mechanisms that may drive these disparities emerging in late childhood and the protective factors that may buffer against them as youth transition from childhood into adolescence.
Conclusion
Analyses of a large, nationally representative cohort in the United States indicate that mental health disparities affecting LGBTQ+ youth are present by late childhood, persist or widen into early adolescence, and differ substantially across sexual and gender minority subgroups. Youth holding both sexual and gender minority identities showed the most rapid increase, and gender-questioning youth showed pronounced early distress. These findings highlight the need for early, identity-specific support and intervention, and for research that explicitly examines how identity, development, and the surrounding policy environment interact to shape mental health in this population.
Data availability statement
This study followed Transparency and Openness Promotion Level 2 guidelines.
Acknowledgements
The authors acknowledge and thank the youth and families who participated in the study.
Funding statement
The ABCD Study is supported by the National Institutes of Health and additional federal partners under award numbers U01DA041048, U01DA050989, U01DA051016, U01DA041022, U01DA051018, U01DA051037, U01DA050987, U01DA041174, U01DA041106, U01DA041117, U01DA041028, U01DA041134, U01DA050988, U01DA051039, U01DA041156, U01DA041025, U01DA041120, U01DA051038, U01DA041148, U01DA041093, U01DA041089, U24DA041123, U24DA041147. A full list of supporters is available at https://abcdstudy.org/federal-partners.html. A listing of participating sites and a complete listing of the study investigators can be found at https://abcdstudy.org/consortium_members/. The ABCD data repository grows and changes over time. The ABCD data used in this report came from Data Release Version 5.1 (November 2023). DOIs can be found at https://dx.doi.org/10.15154/z563-zd24. The content is solely the responsibility of the authors and does not necessarily represent the official views of the National Institutes of Health. ABCD consortium investigators designed and implemented the study and/or provided data but did not necessarily participate in the analysis or writing of this report. This manuscript reflects the views of the authors and may not reflect the opinions or views of the NIH or ABCD consortium investigators. Research reported in this article was also supported by the National Institute on Drug Abuse of the National Institutes of Health (SW, R01DA056499).
Competing interests
The authors have no competing interests to declare.
Pre-registration statement
This work has been preregistered on OSF.
Active link: https://osf.io/rq9n3/overview?view_only=adb56bb0c7d8477d912d0548c9fa237c.
Date stamped: Created March 15th, 2024.
Deviations: At the suggestion of the editor and an anonymous reviewer, additional comparisons disaggregating the LGBTQ+ omnibus into eight subgroup models distinguishing sexual minority from gender minority identification and explicit (“yes”) from questioning (“maybe”) identity status were added.

 Open access

